If Nasdaq can crack the pressure line then...🔱 We have a Hagopian on the down-move. 🔱
Price was (so far) not able to reach the L-MLH of the red fork.
If buyers can eat through the pressure cheese, then the Long-Play is on.
Most often we see price breaking the pressure line and then coming back to it, scaring out the early longs, just to rush upwards again. So don’t panic if this happens. Place a proper stop and you're good.
As for targets, there is the red Centerline and the white Centerline.
On a break of the red CL, we have a high chance to see the same scenario as with the pressure line: UP-Down-MoreUp.
First snow in Switzerland arrived and Santa is preparing the reindeer to bring us some dough ;-)
Wish you all a profitable Friday.
Howtochart

BTC (MBT) on the way ot 86'000Price reacted very well at the white and red fork lines (see arrows).
We have left the white centerline, and now price is hovering around the red one. If we get an open and close below it, we’ll have a new target: the WL1 of the white fork, which unsurprisingly, lines up with the red L-MLH.
Rough times ahead...

A Pitchfork For The LEAPI enjoy a good challenge.
Probably more than is strictly healthy.
That’s why I jumped into the LEAP.
This time I’ve actually got enough hours in the day to show up for the fight. I’m genuinely curious whether I can trade my way into the top 50, even though I’ve already committed a few strategic blunders that shaved off some perfectly good profit.
But that’s trading in the real world, isn’t it?
A comedy of precision errors.
My plan is simple: stick to the Andrews Pitchfork framework and nothing else. The goal isn’t just to place well; it’s to demonstrate how much of an edge this tool offers when you use its rules properly.
Don’t wish me luck - I’m aiming to get there by skill and stubbornness.
S&P500/ES Intraday Trade Idea VideoThoday I see a potential trade setting up in the S&P500 Futures.
My overall thesis is to the upside, so no Shorts today. Unless we come up to the first resistance level, or even beter, the 1/4 line. From there I'll be willing to risk some of my money.
Long option 2:
From the CIB or Centerline, after a pullback to these lower levels.
Happy Monday all §8-)

KRBN - Clear resistance for a potential short🔱 The multiple struggle at the Centerline gives us a hint for a potential short. 🔱
The thin slanted support needs to be broken and only then can we consider a move to the downside.
The L-MLH is my first PTG and the red Centerline my second.
Wish you all a happy new week and don't forget to watch my 👉 Weekly Trading Watchlist.

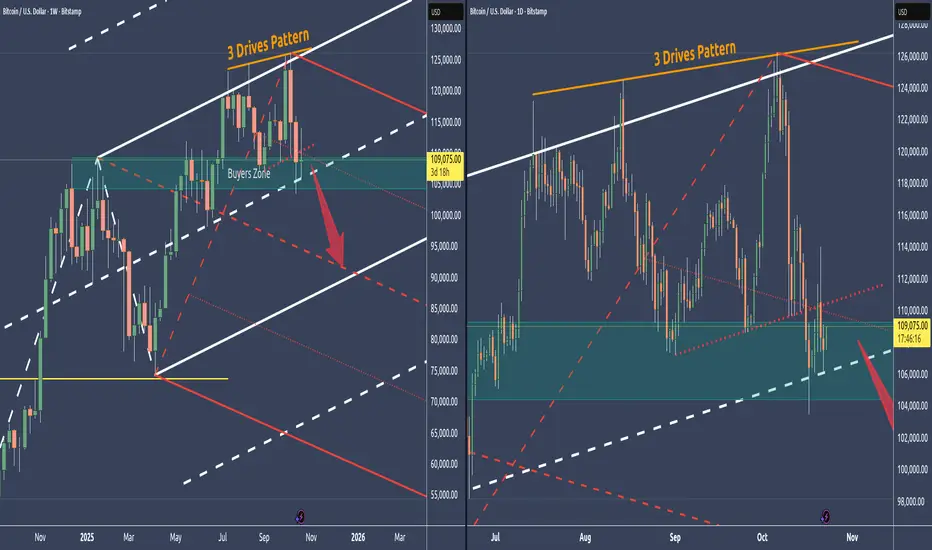
Bitcoin - We've reached the last line of support🔱 The Buyers’ Zone represents the last major support before price potentially drops toward the red centerline. 🔱
👉 The 3-Drives pattern, signaling exhaustion in the current move.
👉 Broader markets are highly stretched; a broader trend reversal would likely pull Bitcoin down with it.
👉 The slanted support line in the dayli chart is now resistance that could not be washed away.
Given these conditions, there’s a strong possibility that this final support zone won’t hold, leading to a deeper flush.
For targets I see the red Centerline, and even the L-MLH, which gives us a natural support.
Stay sharp and trade safe—wishing you a profitable week ahead
ARKK — A “Short” Ranting🔱 ARKK isn’t a revolution - it’s a high-fee, high-drama lottery ticket dressed in a lab coat. 🔱
🏦 Here's my take on the Fundamentals 🏦
⚠️ Overpriced Dreams:
You’re paying luxury prices for companies that don’t make money—most can’t even spell “free cash flow.”
⚠️ Interest-Rate Kryptonite:
When rates rise, ARKK melts. Its “future profits” vanish faster than smoke in a wind tunnel.
⚠️Liquidity Trap:
It owns too much of too little; one wave of redemptions and it’s forced to dump stocks into a falling market.
⚠️ Weak Alpha, Big Fee:
For all the hype, it lags a plain NASDAQ ETF - you’re paying 0.75% to underperform.
⚠️ Factor Suicide:
It’s built from the worst statistical factors. Expensive, volatile, unprofitable stocks that hate inflation.
⚠️ Concentration Bomb:
Half the fund sits in a handful of “disruptors.” If one blows up, the whole thing shakes.
⚠️ Dumb Money Flow:
Retail investors chase this thing at highs and bail at lows. Every short seller’s dream.
⚠️ Copycats and Fee Drag:
Competitors now clone the “innovation” pitch cheaper and better, while ARKK drags its old fee chain.
📈 And finally, here's the Chart Analysis
This flying Pig is ready to be Barbequed.
It missed the pump up to the Warning Line and fell back into the Fork. Today it opened inside, and if nothing superstitious happens, it’ll close inside too.
So, I’m short - period.
As always, my first target is the Centerline.
Have a great weekend, everyone and grab some gas for the BBQ.

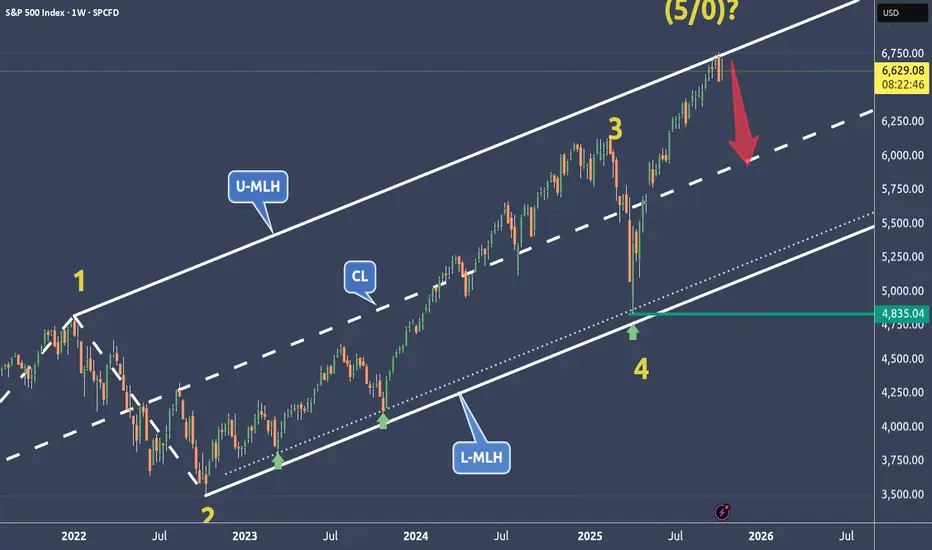
SPX is weakening at a very dangerous price level🔱 SPX is at a very dangerous price level ⚠️
...right at the Upper Median Line Parallel.
💰 If this market turns, the Centerline becomes the next target.
The 0-5 Count is also a good indication when prices start to turn at these extreme levels.
⚠️ Stay sharp — momentum is fading.
I wish you all a relaxing weekend.
METAs Short Target At $630🔱 The Cracks Are Showing 🔱
🏦 Let’s talk fundamentals.
The biggest storm cloud hanging over META right now? Regulation — in both the EU and the U.S. If fines or compliance costs ramp up, profits get squeezed and strategy shifts become inevitable.
👉 Competition is biting too. New apps are stealing attention, and every second users spend elsewhere chips away at Meta’s moat.
⚠️ Then there’s the AI spending spree. Billions are burning to build infrastructure, but if those bets don’t pay off fast, margins will bleed.
Add growing media pressure — from content moderation to child safety — and you’ve got a brand walking through a minefield of reputational risk.
📈 Now, look at the chart.
The price has fallen below the Centerline. That’s not noise — that’s a message. It’s a classic short signal.
Before the drop, we saw price action stall again and again at the upper quarter line. That’s not random congestion. That’s distribution — the big whales quietly unloading while everyone else was still bullish.
Then came the pullback to the Centerline. followed by a weak close. Translation: buyers are drying up.
💰 Target? $630 at the L-MLH. With smart position sizing, this could be a sweet Christmas trade.

CVNA - Carvana on the way down
Since August, CVNA has been moving sideways without any real direction.
At the upper quarter line, sellers appeared at nearly every price level, keeping CVNA pinned down.
Now that the price is trading below the centerline, the next target is the lower median line (L-MLH).
Is it too late to short?
Perhaps—but I’d at least wait for a pullback, or better yet, hold off until after earnings.

SI1! - Dancing on the SILVER Tracks🔱 I like risk. Specially when it's skewed to my favor 🔱
WL1 has been reached, and the market is wildly overextended.
Is it crazy to stand in front of this speeding train?
Absolutely — if you don’t know when to jump.
I’ve done my warm-up, and I’m ready to leap off the rails the moment it gets too close, too fast.
My move is with options — that means my risk is defined, my escape route mapped.
I would never short the underlying — not in a million years.
Now let’s see if this setup earns me that Steak & Lobster target.

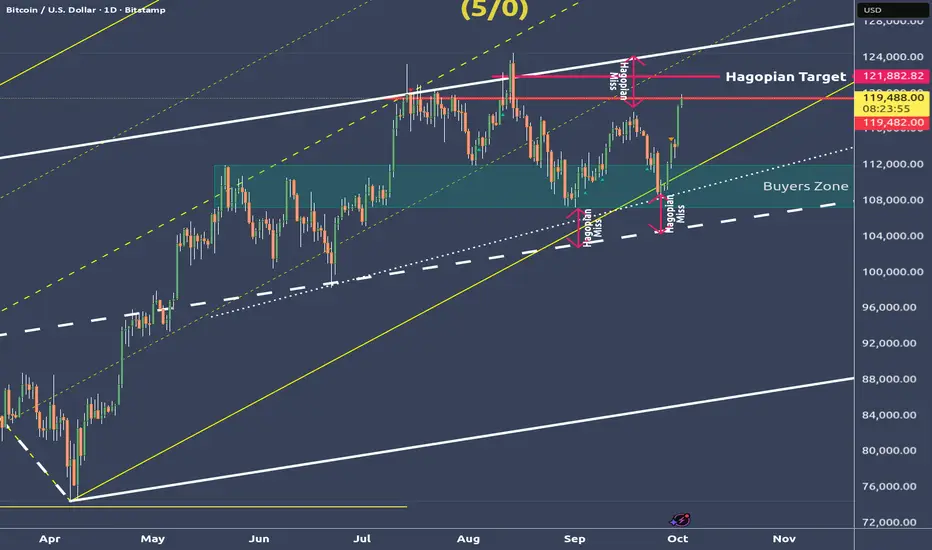
Bitcoin Hodlers are happy campers - BUT🕷️ 🌕 🦇 In Switzerland it’s now 11:50 PM 🕷️ 🌕 🦇
I’m tired from a long day in the markets, but I feel I have to get this one out because it’s important for many of you holding Bitcoin.
In my last post, I said we’d run upward to reach the Hagopian Line, and here we are, even higher.
We’ve just tagged the U-MLH for the third time.
There’s an old pattern from the futures markets that farmers once noticed. It’s called the “Three Drives” pattern.
The old farmers knew that when this pattern appeared, it was time to hedge their crops, or add to their hedge.
When I was a student at MarketGeometry, Tim Morge explained this pattern, and ever since it’s served me well as a signal for a trend reversal.
I don’t know exactly how this will help each of you, but I’m sure it’s worth a heads-up. Whether you decide to hedge, close your positions, or just HODL until the sun burns out, it’s something to keep in mind.
Meanwhile, the Harvest Moon is shining into my office tonight, twinkling with a strange grin... 🌕
Time for me to rest.
Good night, everyone.
🌾 🌾 🌾 🌾 🌾 🌾 🌾

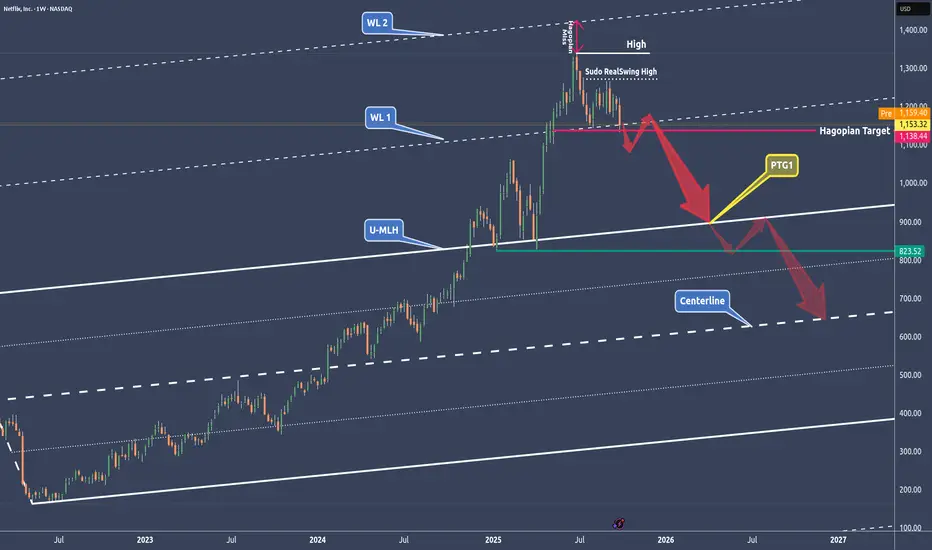
NFLX - NetFlix done after the run?🔱 A break of the WL1 could be the technical short signal 🔱
NetFlix had a monster run.
✅ Here’s a grounded fundamental breakdown of risks that could push Netflix downward. None of these are certainties, instead think of them as warning signs, not predictions.
👉 Slowing subscriber growth – growth in mature markets may plateau, and churn could rise if hit shows underperform.
👉 Rising competition and costs – rivals like Disney+ and Amazon force Netflix to spend more on content, squeezing profit margins.
👉 High valuation risk – expectations are lofty, so even a small earnings miss could trigger a sharp sell-off.
✅ Chart analysis
After missing WL2, we’ve got a Hagopian in play, which I’d say still hasn’t been fulfilled. The line was touched by a few ticks, but usually these lines break more decisively.
🔨 If we open and close below WL1, I’m stalking a pullback to it, just to hit the market on the head. If this break really happens, we’ll also have a clean structure for our stop, placed above the last RealSwing high.
🎯 The target is set in stone for me: It's the U-MLH and beyond, down to the Centerline.
Let’s stay focused and keep our cool.
Happy new week!
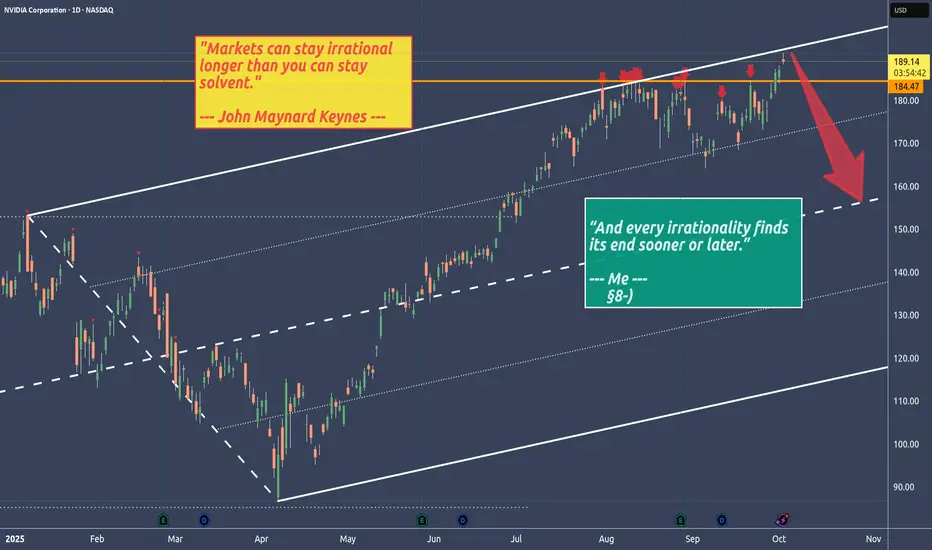
NVIDIA - Stalking NVDA with a short trade in mind🔱 Second approach to crack the U-MLH 🔱
No matter how irrational markets get, sooner or later the Black Bird strikes them down.
We’re back at the U-MLH where price is stretched.
Could it trade through it?
Absolutely.
Even better would be if price trades above the U-MLH and then falls back into the fork — that would be a strong confirming short signal.
But a turn right at the U-MLH would also be a heads-up for me.
👉 Stalking NVDA with a short trade in mind.
Bitcoin deep dive - We go up to the Hagopians line🔱 Up to the HAGOPIAN's line! 🔱
My last post showed what the possible moves are.
Bitcoin blew through both U-MLH's and is now on the way to the HAGOPIAN-Line.
I could imagine that we even tag the white U-MLH again.
That would be about where the confluence with the yellow forks 1/4 line is.
Because there is much more to say about this chart, I thought I'll do a video.
⛏️ I constructed the Chart from the ground up so you can see all the details and thoughts running through my Mycel Network §8-)
👉 Just check my SOM links.
🙏 Thanks you all for the Boosters I got lately. You all are absolutely awesom and I really appreciate it! 🙏
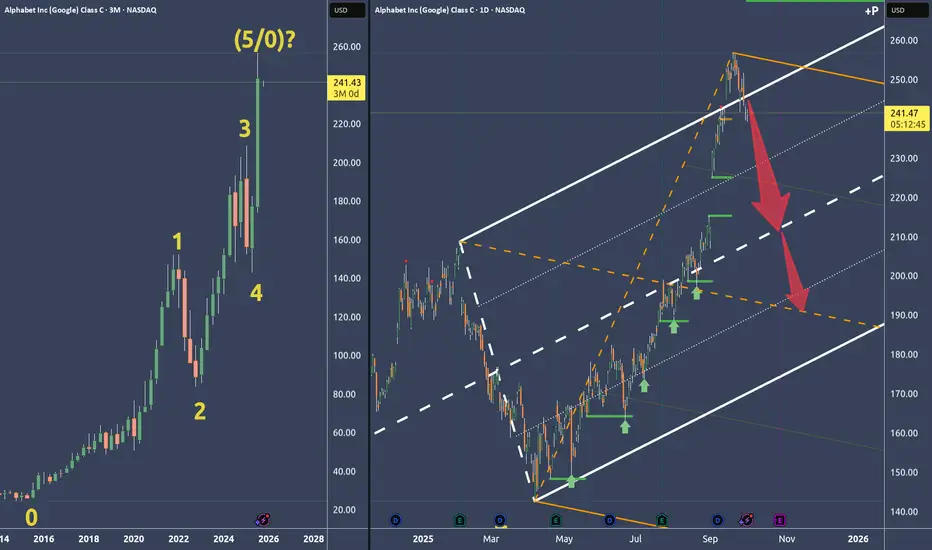
Google Alphabet: Why I think it's time to short🔱 Simple decision because of the Fork framework 🔱
Left Chart:
Zero-to-five count with a potential P5 and a turn.
Why P5?...
Right Chart:
...because price broke out of the U-MLH, then fell back into the fork. As a filter I like it when price is opening and closing inside the fork again. All in all it's a new and weak behaviour.
Or in short: That’s a pretty darn strong short signal to me.
Following the rules, taking acceptable risks, and hunting a fat profit.
👉 PTG1: The white centerline
👉 PTG2: The orange centerline
🛷 Happy Sleigh Ride 🎄
USDCHF - The LONG Shift At Extreme & Confluence Points North🔱 Could this is the turn for USDCHF? 🔱
🏦 Some condensed economic fundamental points first 🏦
📈 Rate Differential: Fed ≈ 5.25-5.50 % vs SNB 0 % → strong yield advantage for USD. Growth Gap: U.S. GDP resilient; Swiss economy soft from tariffs and weak demand → CHF under pressure.
💰 Carry & Flows: Higher U.S. yields attract capital into USD assets.
⚠️ Risk Sentiment: If markets stay risk-on, CHF’s safe-haven bid fades. Sudden risk-off shocks, faster Fed cuts, or unexpected SNB tightening.
🌍 Bias: USD supported by yield spread and stronger growth unless risk-off returns.
🔱 What The Chart Is Telling Us 🔱
he white pitchfork seems to be catching price rather loosely around the centerline — and only now do we see why. It’s likely due to a shift in play.
See the orange parallel? It’s shifted upward if we use the overshoot above the centerline as the reference for the parallel lines.
The red, downward-sloping pitchfork gives us a strong confluence point where price stops falling. It’s also sitting at the L-MLH, the extreme relative to the red fork.
HAGOPIAN?
Yes! If we start to trade away from the red centerline, then I also expect a Hagopian is cooking and we go up farther than from where we came!
I’ll be watching it on lower timeframes, looking to catch the bus north. If this setup plays out, it could be a significant move, so the stop-loss needs to be well-placed.
Just follow me and maybe we can travel together 🚌💨

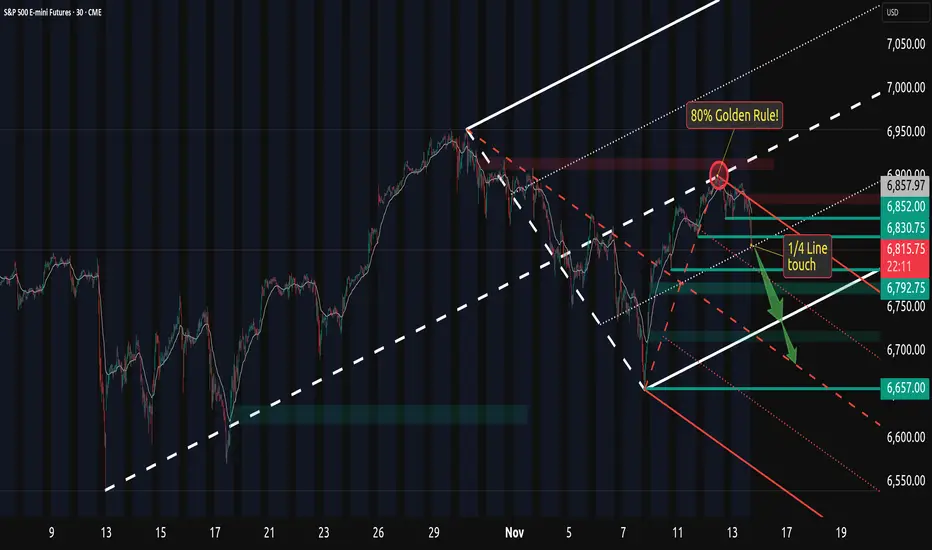
Nasdaq Pre-Market Long CIB Trade🔱 Here comes the CIB Trade 🔱
Price came down in 5 waves.
The CIB line gives us a heads-up if price breaks through it, and it did!
Now everyone and it's Grandma is long on the breakout.
"...let's scare them out, let's hit their Stop!"
Then we take off upon a test of the CIB-Line, which in essence is the same as a test fo a U-MLH or L-MLH after a break.
We have a nice target with a chance to hit of about 80% at the Centerline, and a fantastic tiny stop below the test at the CIB line.
Let's watch how this unfolds.

BTCUSD - Nothing broken - so farUp where the 0 (zero) is, at the white Centerline, BTC was trying to re-test it, when it came from the white 1/4 line. So a larger Hagopian kicked in, projecting price to go further down than from where it originally came.
Price did what was projected by the Hagopian and cracked the low of 111'920.
Then from Point 1, Bitcoin made it up to the red U-MLH.
It was just natural resistance up there.
Now we see a pullback to the south, which I had not expected last week.
Even if we stop in the buyers zone, chances that BTC is trading down to the Centerline are around 80%.
And down there we will find out if the white L-MLH will hold or not.
If not, then we are in a 0 to 5 count to the south and we will see much lower prices.
But as long as price can stay within the white Fork, we are still projecting it's most probable path to the upside in the long term timeframe.
Happy new week and stay tuned for the news §8-)
