IBM, This is Huge, Massive BULL-Acceleration, BREAKOUT-Setup!Hello There!
Welcome to my new analysis of IBM. In recent times I have analyzed the stock and I have detected major important historical determinations within the analytics backend that are actually indicating an epical breakout has a high potential to emerge within the next times. Not every stock within the market is bullish however with IBM there are clear signs that it already had the potential to rebound since the grievous corona market shock lows and now as digitization increases this is already building a bullish base for IBM.
Within my chart, I have detected this gigantic inverse head-shoulder formation in combination with the paramount bull flag formation, both being two bullish formations that have the potential to be major bullish trend accelerants once the breakout above the boundary has shown up this is going to activate a major double confirmation here. The trend is supported by the major underlying demand structure as well as the EMAs and the main ascending trend line. Once the final breakout above the upper boundary of the inverse head-shoulder formation in combination with the upper boundary of the bull flag has shown up this is going to accelerate the demand trend dynamics.
Taking all these factors into consideration here as digitization since the corona pullback lows have been completed increased massively this is increasing the actual digitization demand within the market and for a stock like IBM, this means that there is a main underlying demand base that is accelerating a bullish trend dynamic. Once the main breakouts as mentioned within the next times have shown up this is going to activate the minimum target of 250 and above further continuations have an increased potential once the main demand and momentum spread into the trend direction increases. Because of the importance of this setup forming here, I am keeping the stock in my current watchlist.
In this manner, thank you everybody for watching my analysis of IBM. Support from your side is greatly appreciated.
VP
IBM

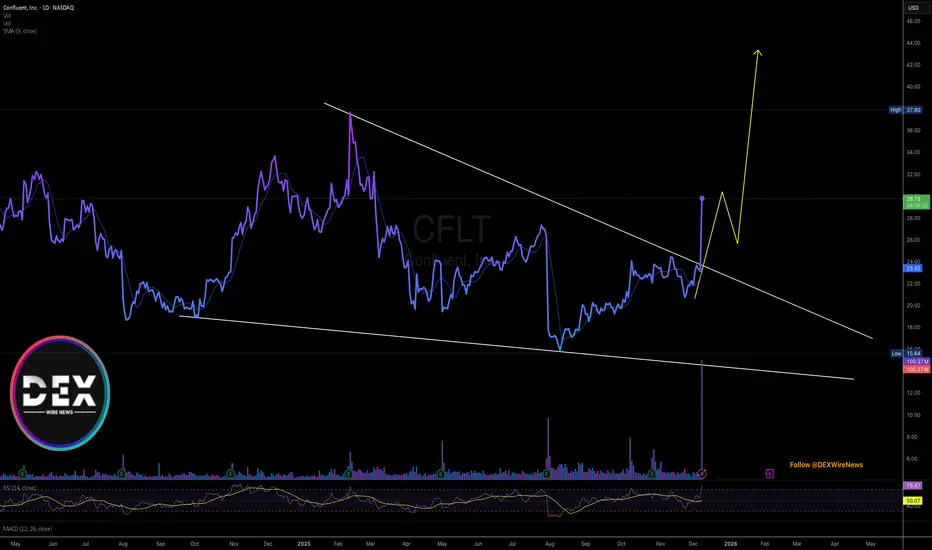
Breaking: Confluent, Inc. (NASDAQ; $CFLT) Spike 28% Today Confluent, Inc. (NASDAQ; NASDAQ:CFLT ) experience a noteworthy uptick of 28% today amidst amidst breaking out of a bullish symmetrical triangle pattern.
The asset broke the ceiling of the triangle near the $23 resistant aiming for a move to the $50 resistant. However, with the RSI at 78, the asset might col off a bit at the ceiling it recently broke in order to pick liquidity up.
In recent news, Confluent, Inc. (NASDAQ: CFLT), today announced they have entered into a definitive agreement under which IBM will acquire all of the issued and outstanding common shares of Confluent for $31 per share, representing an enterprise value of $11 billion. Confluent provides a leading open-source enterprise data streaming platform that connects, processes and governs reusable and reliable data and events in real time, foundational for the deployment of AI.
IDC estimates that more than one billion new logical applications will emerge by 20281, reshaping technology architectures across industries. To fuel meaningful outcomes and drive productivity in operations, these applications, as well as AI agents, need access to connected and trusted data – in real time. IBM and Confluent will enable end-to-end integration of applications, analytics, data systems and AI agents to drive intelligence and resilience in hybrid cloud environments.
About CFLT
Confluent, Inc. operates a data streaming platform in the United States and internationally. The company provides platforms that allow customers to connect their applications, systems, and data layers comprising Confluent Cloud, a managed cloud-native software-as-a-service (SaaS); and Confluent Platform, an enterprise-grade self-managed software.
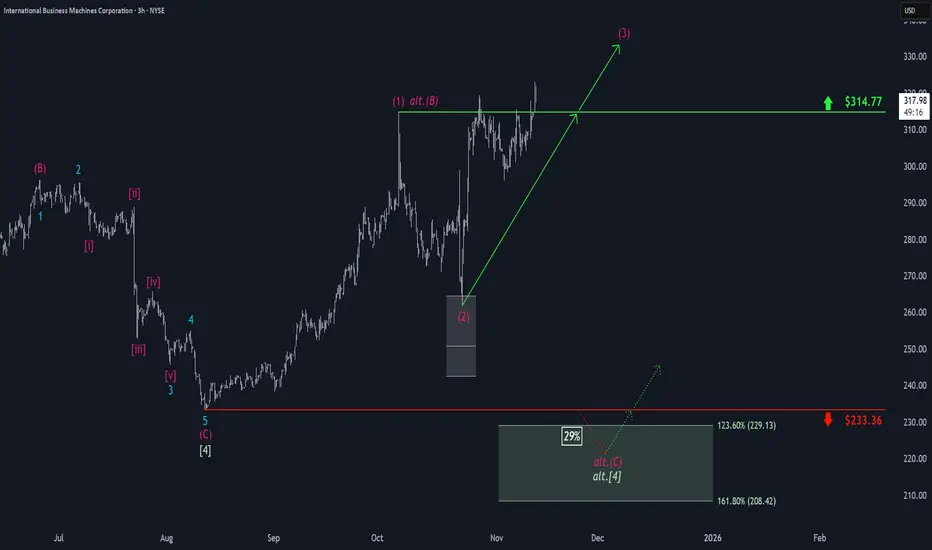
IBM: Breaking Out Above Key ResistanceIBM shares have been contending with stubborn resistance at $314.77 for the past two weeks. After an initial breakout attempt was firmly rejected, the stock has made three more efforts to decisively clear this level—and today, it once again surged purposefully above that mark. In the near term, we expect the high of magenta wave (3) to be established. If the alternative scenario plays out, however, a pullback into our green alternative Target Zone between $229.13 and $208.42 will be likely (probability: 29%).
Is IBM Building an Unbreakable Cryptographic Empire?IBM has positioned itself at the strategic intersection of quantum computing and national security, leveraging its dominance in post-quantum cryptography to create a compelling investment thesis. The company led the development of two of the three NIST-standardized post-quantum cryptographic algorithms (ML-KEM and ML-DSA), effectively becoming the architect of global quantum-resistant security. With government mandates like NSM-10 requiring federal systems to migrate by the early 2030s, and the looming threat of "harvest now, decrypt later" attacks, IBM has transformed geopolitical urgency into a guaranteed, high-margin revenue stream. The company's quantum division has already generated nearly $1 billion in cumulative revenue since 2017—more than tenfold that of specialized quantum startups—demonstrating that quantum is a profitable business segment today, not merely an R&D cost center.
IBM's intellectual property moat further reinforces its competitive advantage. The company holds over 2,500 quantum-related patents globally, substantially outpacing Google's approximately 1,500, and secured 191 quantum patents in 2024 alone. This IP dominance ensures future licensing revenue as competitors inevitably require access to foundational quantum technologies. On the hardware front, IBM maintains an aggressive roadmap with clear milestones: the 1,121-qubit Condor processor demonstrated manufacturing scale in 2023, while researchers recently achieved a breakthrough by entangling 120 qubits in a stable "cat state." The company targets deployment of Starling, a fault-tolerant system capable of running 100 million quantum gates on 200 logical qubits, by 2029.
Financial performance validates IBM's strategic pivot. Q3 2025 results showed revenue of $16.33 billion (up 7% year-over-year) with EPS of $2.65, beating forecasts, while adjusted EBITDA margins expanded by 290 basis points. The company generated a record $7.2 billion in year-to-date free cash flow, confirming its successful transition toward high-margin software and consulting services. The strategic partnership with AMD to develop quantum-centric supercomputing architectures further positions IBM to deliver integrated solutions at exascale for government and defense clients. Analysts project IBM's forward P/E ratio may converge with peers like Nvidia and Microsoft by 2026, implying potential share price appreciation to $338-$362, representing a unique dual thesis of proven profitability today combined with validated high-growth quantum optionality tomorrow.
IBM Bullish: Flag Breakout Toward 335–345IBM on the 1D chart has reversed higher since mid-August, sprinted to a new high at $319.35, and is now digesting in a classic bull-flag. Price is hovering near $312.57, with the flag’s upper boundary around $315 and a well-defined demand zone turned support at $299.50. Trend structure remains constructive (price above key MAs), but momentum has cooled during consolidation—exactly what you want to see if a continuation is coming.
Primary path: a daily close above $319.50 with expanding volume would confirm the flag and open room toward $335 first, with a stretch objective near $345. For traders preferring pullbacks, an orderly dip into $299.50–$305 that holds bid would keep the pattern intact and can set the stage for another test of $319.35.
Alternative: failure to hold $299.50 on a sustained daily close invalidates the immediate bullish read and shifts risk toward $305 initially, then $295 and even $285 if sellers press the breakdown. Invalidation for the upside thesis sits cleanly below $299.50; the setup improves materially only on a break-and-hold back above $315–$319.35.
This is a study, not financial advice. Manage risk and invalidations.

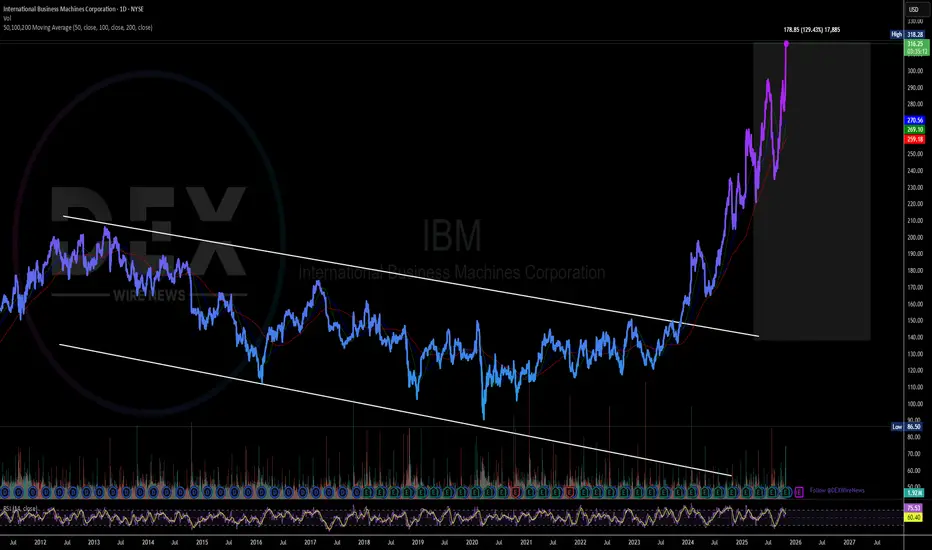
International Business Machines (IBM) Gearing for Breakout Ever since breaking out of a falling wedge on November 2023, International Business Machines (IBM) spike 130% breaking highs after highs.
In recent news, IBM plans to launch a platform that will enable financial institutions, governments and corporations to manage digital assets across various blockchains while meeting their compliance obligations.
The IBM Digital Asset Haven is being developed in collaboration with Dfns, a digital wallet infrastructure provider that has created 15 million wallets for 250 clients, the companies said in a Monday (Oct. 27) press release.
About IBM
International Business Machines Corporation, together with its subsidiaries, provides integrated solutions and services in the Americas, Europe, the Middle East, Africa, and the Asia Pacific. It operates through Software, Consulting, Infrastructure, and Financing segments. The Software segment offers hybrid cloud and AI platforms that allows clients to realize their digital and AI transformations across the applications, data, and environments in which they operate.
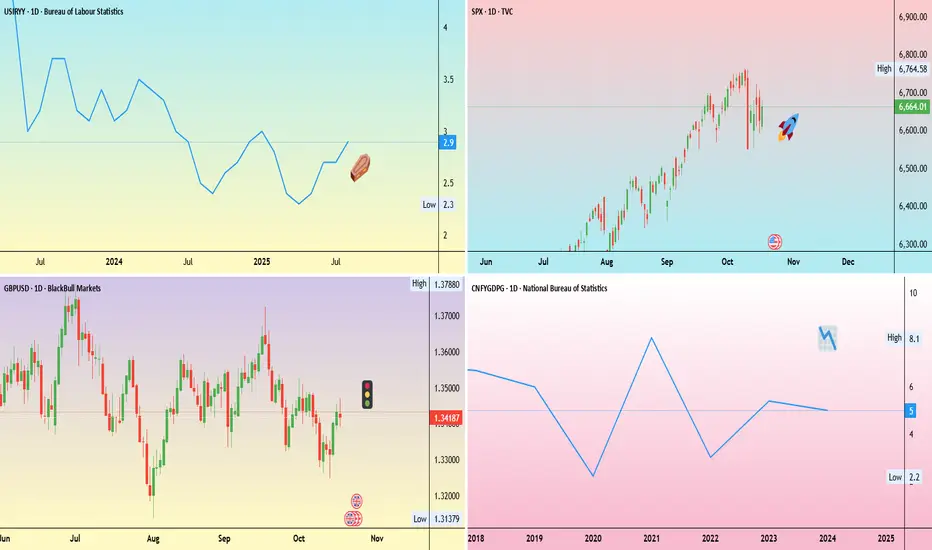
Weekly Trading Opportunities | October 21–25 • Monday: China GDP data
China’s third-quarter GDP report will be closely watched as growth is expected to slow to 4.8% year-on-year from 5.2% in Q2.
Slowing growth in China could reduce demand and prices for commodities. A surprise upside could support commodity prices.
• Tuesday: Coca-Cola and Netflix earnings.
Earnings season continues with Coca-Cola, Netflix, and others including Tesla, IBM, and Intel.
Strong results could offset soft U.S. data and help reignite the risk-on environment.
• Wednesday: U.K. inflation data and Tesla earnings
U.K. inflation is expected to edge back toward 4%. A softer reading could boost U.K. equities and pressure the pound.
• Thursday: Intel earnings
• Friday: U.S. CPI report
With the U.S. government shutdown entering its fourth week, the CPI release remains the week’s key data point. A hotter print could lift the dollar.
IBM | The Trend Is Your Friend | LONGInternational Business Machines Corp. is an information technology company, which engages in the provision of integrated solutions that leverage information technology and knowledge of business processes. It operates through the following segments: Software, Consulting, Infrastructure, Financing, and Other. The Software segment combines hybrid cloud platform and software solutions to help clients become more data-driven, and to automate, secure, and modernize their environments. The Consulting segment focuses on integrating skills on strategy, experience, technology and operations by domain and industry. The Infrastructure segment offers solutions for hybrid cloud and is the foundation of the hybrid cloud stack. Infrastructure is optimized for infusing AI into mission-critical transactions and tightly integrated with IBM Software including Red Hat for accelerated hybrid cloud benefits. The Financing segment refers to the client and commercial financing, facilitating IBM clients' acquisition of IT systems, software, and services. The company was founded by Charles Ranlett Flint and Thomas J. Watson Sr. on June 16, 1911 and is headquartered in Armonk, NY.

IBM International Business Machines Options Ahead of EarningsIf you haven`t bought IBM before the rally:
Now analyzing the options chain and the chart patterns of IBM International Business Machines prior to the earnings report this week,
I would consider purchasing the 290usd strike price Puts with
an expiration date of 2025-9-19,
for a premium of approximately $17.30.
If these options prove to be profitable prior to the earnings release, I would sell at least half of them.
Disclosure: I am part of Trade Nation's Influencer program and receive a monthly fee for using their TradingView charts in my analysis.

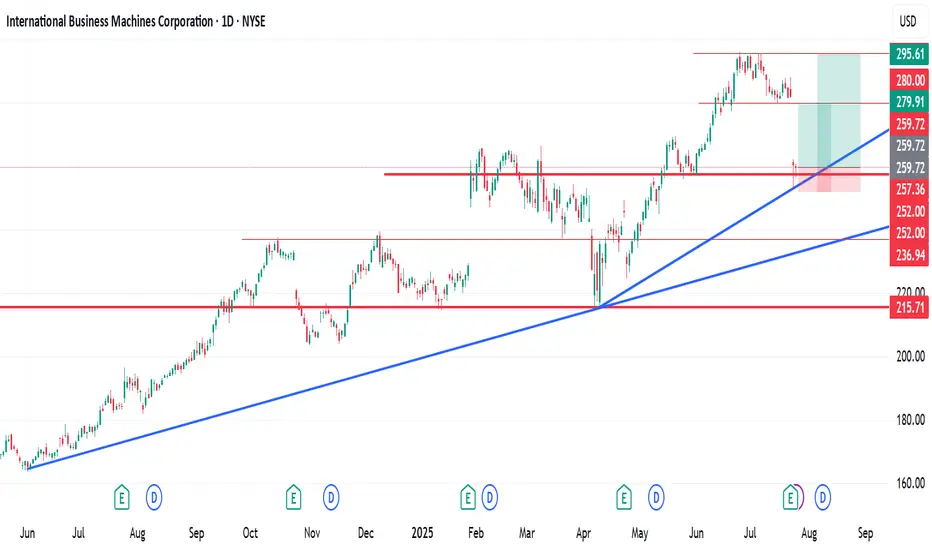
IBM Stock Forecast and Technical OutlookIBM Stock Forecast and Technical Outlook.
International Business Machines Corporation (IBM) reached a recent peak in June 2025 before experiencing a gradual decline. On July 24th, the stock saw a significant drop of over 10%, likely triggered by investor reaction to recent company news or broader market sentiment.
Despite this sharp decline, technical indicators on my chart suggest the potential for a short- to medium-term recovery. Based on my analysis, there are two potential setups with favourable Risk-to-Reward (R:R) ratios:
Scenario 1: R:R of 1:2.63
Scenario 2: R:R of 1:4.65
I bought some shares at $260.17
These figures indicate that for every unit of risk taken, there is a potential return of 2.63x or 4.65x, respectively, depending on the chosen entry and exit strategy.
As always, investors are advised to conduct their due diligence and apply proper risk management techniques before entering any position.
Hey friends, if this is helpful, kindly like, follow, subscribe, share and comment
Looking like an immediate buy on IBM! OptionsMastery:
🔉Sound on!🔉
📣Make sure to watch fullscreen!📣
Thank you as always for watching my videos. I hope that you learned something very educational! Please feel free to like, share, and comment on this post. Remember only risk what you are willing to lose. Trading is very risky but it can change your life!

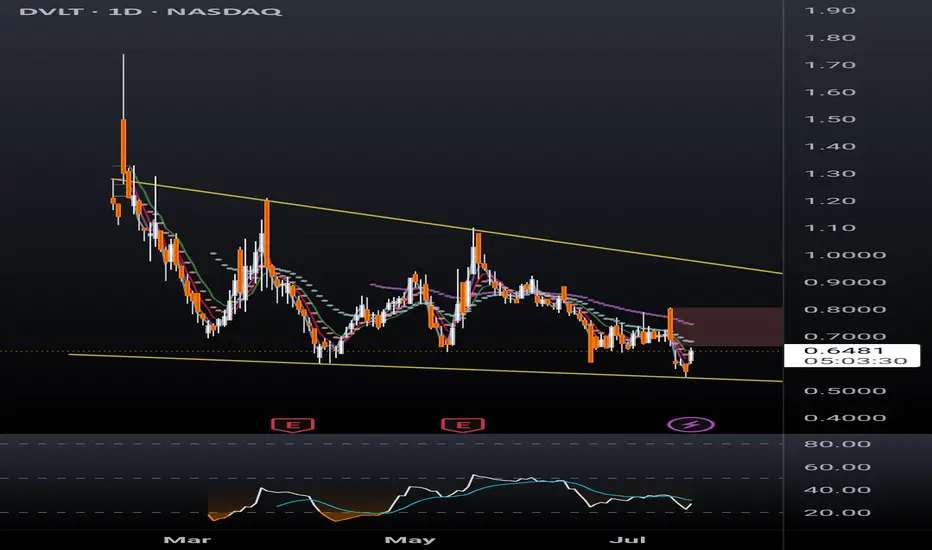
DVLT falling wedge, TP $1+DVLT a relatively new ticker is already drawing a lot of attention. Up 13% today after hitting new all time low yesterday, sure to catch a lot of eyes from retail investors. With recent news releases such as a licensing agreement with IBM, a lawsuit against naked short selling, and US patent allowances, target prices have been announced ranging from $3 to $11/share.
Disclaimer, this ticker is PRONE TO HEAVY DILUTION, however in order to remain listed on NASDAQ the SP will have to hit $1 and remain there. This being the case, the company must have something in the books to break upward out of this falling wedge and give shareholders a reason to stay with the company long term.
I'm just a cat not a financial advisor.
IBM: Still BullishAfter the increases over the recent weeks, we still place IBM within the magenta wave (3) and expect a bit more bullish headroom in the short term. However, in our medium-term alternative scenario, we would see a larger pullback with the green wave alt. . Such a detour is considered 30% likely and would be confirmed by a drop below the support at $260.48.
📈 Over 190 precise analyses, clear entry points, and defined Target Zones - that's what we do.

IBM: Bullish AttemptsIBM has made progress in our scenario: Currently, the price is rising above the crucial resistance at $265.72; clearly surpassing this mark is important in the ongoing wave (3) in magenta. While we cannot entirely remove our alternative scenario with a new low for wave alt. in green, it still holds a 33% probability. We primarily expect that the regular wave in green was already completed at $211.52 and are therefore preparing for a direct continuation of the increases in the broader wave in green.
📈 Over 190 precise analyses, clear entry points, and defined Target Zones - that's what we do.

Breaking: International Business Machine (NYSE: $IBM) Tanks 6% International Business Machine Corporation, (NYSE: NYSE:IBM ) together with its subsidiaries, provides integrated solutions and services in the United States, Europe, the Middle East, Africa, Asia Pacific, and internationally Plummets 6% in early premarket trading on Thursday albeit reporting better-than-expected earnings and revenue for the first quarter on Wednesday.
Earnings Overview
a. Earnings per share: $1.60 adjusted vs. $1.40 expected
b. Revenue: $14.54 billion vs. $14.4 billion expected
Revenue increased 0.6% in the quarter from $14.5 billion a year earlier, according to a statement. Net income slid to $1.06 billion, or $1.12 per share, from $1.61 billion, or $1.72 per share, in the same quarter a year ago.
For 2025, IBM reiterated its expectation for $13.5 billion in free cash flow and at least 5% revenue growth at constant currency. At current exchange rates, currency will provide 150 basis points of benefit for 2025 growth, down from the company’s forecast of 200 basis points in January.
IBM has been an outperformer this year as the broader market has sold off due largely to concerns around President Donald Trump’s tariffs and their potential impact on the economy. As of Wednesday’s close, IBM shares were up 11%, while the Nasdaq was down almost 14%.
The stock slipped 6% in extended trading on Wednesday, extending the loss to Thursday's premarket session. NYSE:IBM shares need to break pass the $266 resistant to negate any bearish barriers. Failure to break pass this level could resort to consolidatory move to the $216 support point.
IBM Share Price Falls Following Earnings ReportIBM Share Price Falls Following Earnings Report
Yesterday, after the close of the main trading session, International Business Machines (IBM) released its Q1 earnings report, exceeding Wall Street analysts’ expectations in several key areas. According to FactSet:
→ Earnings per share came in at $1.60 (forecast = $1.42), although this was below last year’s figure of $1.68.
→ Quarterly revenue reached $14.54 billion (forecast = $14.39 billion), marking a 1% increase year-on-year.
Initially, IBM shares rose on the news, but then dropped by approximately 6% during after-hours trading, according to Google Finance.
This suggests that today’s trading session may see IBM shares open below the $230 mark.
Market participants may have been disappointed by the following:
→ IBM’s mainframe business (large-scale computing systems designed for high-volume data processing) continued its decline, falling by 6% year-on-year.
→ Revenue from software and consulting divisions increased, but only by 3% compared to the same period last year.
→ The revenue forecast for Q2 stands at $6.6 billion – a 3% decline relative to the same quarter in 2024.
Technical Analysis of IBM Share Price
The chart shows signs of seller activity above the psychological level of $250. As indicated by the arrows, the price attempted several rallies above this level with varying momentum, but each time retreated back.
At the same time, price fluctuations formed a downward channel, which was extended to the downside in early April amid news regarding new tariffs in international trade.
Price stabilisation observed between 15–17 April suggests that supply and demand were temporarily balanced ahead of the earnings release. However, the negative market reaction to the report may shift sentiment and act as a catalyst for further price movement towards the lower boundary of the channel, around the key support level of $215.
This article represents the opinion of the Companies operating under the FXOpen brand only. It is not to be construed as an offer, solicitation, or recommendation with respect to products and services provided by the Companies operating under the FXOpen brand, nor is it to be considered financial advice.

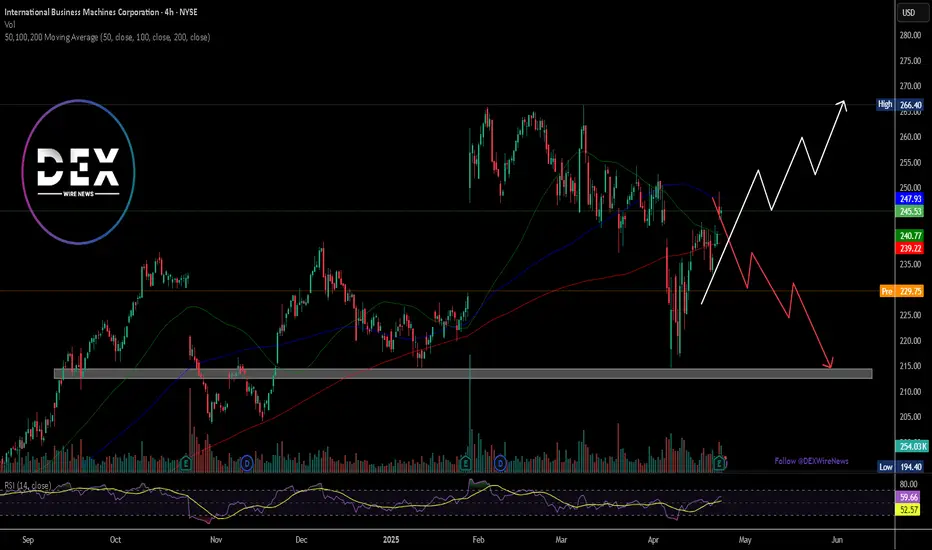
IBM Earnings PlayTechnical Analysis NYSE:IBM
On the 4-hour chart, IBM’s stock price is currently trading at approximately $260.50. Applying Bollinger Bands, the price is hovering near the 20-period moving average, with the bands moderately contracted, indicating relatively low volatility. The stock has shown resilience above the lower Bollinger Band, suggesting potential for an upward move if bullish momentum builds post-earnings. A recent green candle indicates buying interest, but the stock remains below the upper band, which sits near $270.00, signaling room for upside if catalysts align.
Target
Wait for bullish confirmation post-earnings.
Entry LONG : Around $262.00, Targeting $270.00.
Secondary Target: $275.00.
Resistance Levels: $265.00, $270.00, $275.00.
Support Levels: $255.00, $250.00, $245.00.
The price is testing the 20-period moving average, and a strong earnings report—particularly with positive AI or cloud revenue updates—could push the stock toward the upper Bollinger Band at $270.00 or higher. Conversely, a disappointing earnings report or weak guidance could see the price drop toward $255.00 or lower, especially if broader market conditions weaken.
QuantSignals
Best AI news analysis and signals

IBM - Move Up to Trend LineTrend Line in green shows a place where price likes to move along
Right now price is under this line, and looking to move back up towards the line for another test
The smaller structure to the left is very similar to the one we are experiencing now hence why I have made this comparison with the bars pattern tool
Bullish up towards the Green solid line on this Weekly timeframe

$IBM $250 retestNYSE:IBM Looking for a resistance zone tap of a retest. Earnings is a week and a half away as well which could score you some premium; wouldn't hold into earnings (craps shoot). Want to see a strong test on $240 then could see a boost to $248-$250 before earnings.
WSL.

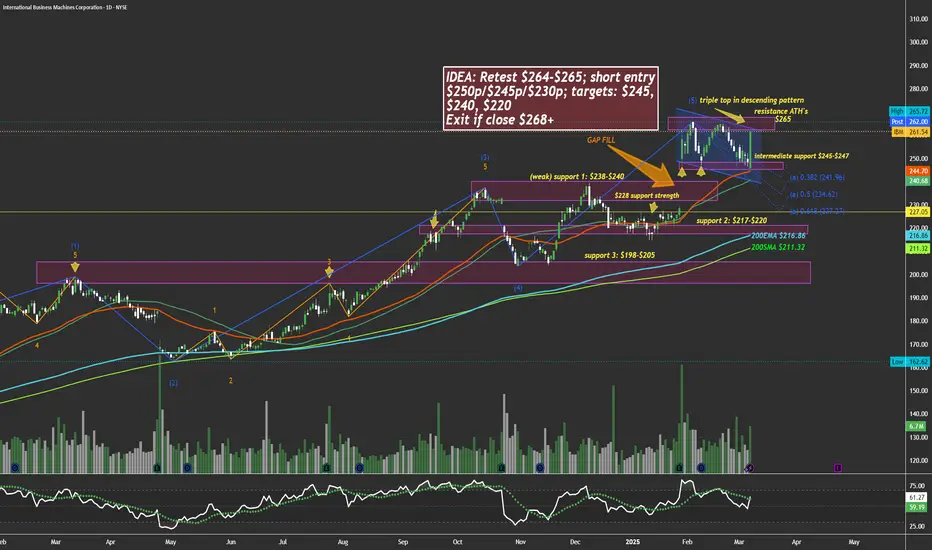
$IBM too hot, due for a chillHi, constructed a chart here showing many levels. I personally think NYSE:IBM will face some downside weeks to come. My trade plan is written in the idea box. The two lines that aren't labeled are 50ema and 50sma.
WSL
IBM, Long, 15m✅ IBM is oversold and is expected to move upward toward the key resistance at 251.80.
LONG 🚀
✅ Like and subscribe to never miss a new analysis! ✅

$QTUM Maybe Trying to break out of This Wedge (VCP)I have been long this name for a few months now in my investment account. I have added more today with a stop on the added position size just below today’s low. There are some very big names in this ETF, it invests in AI learning as well as Quantum Computing.
It looks to me to be in a Volatility Contraction Pattern (VCP), more popularly called a wedging pattern. I went long more shares as indicated above in anticipation of a break above the declining upper trendline. It also is supported by both the 8 and 20 EMAs and has consolidated to get more inline with the 50 DMA (red).
If you like it, make the trade your own and make sure it fits your trading plan.
Look at the fund holdings in “More About Fund” link supplied by TradingView. Here are some of the names you might recognize: NASDAQ:KLAC NYSE:IBM NASDAQ:PLTR NYSE:RTX NYSE:BABA
From Defiance ETF Website:
QTUM
Index Description: The BlueStar® Machine Learning and Quantum Computing Index (BQTUM) tracks liquid companies in the global quantum computing and machine learning industries, including products and services related to quantum computing or machine learning, such as the development or use of quantum computers or computing chips, superconducting materials, applications built on quantum computers, embedded artificial intelligence chips, or software specializing in the perception, collection, visualization, or management of big data.

IBM International Business Machines Options Ahead of EarningsIf you haven`t bought IBM before the previous earnings:
Now analyzing the options chain and the chart patterns of IBM International Business Machines prior to the earnings report this week,
I would consider purchasing the 230usd strike price Calls with
an expiration date of 2025-1-31,
for a premium of approximately $5.40.
If these options prove to be profitable prior to the earnings release, I would sell at least half of them.
