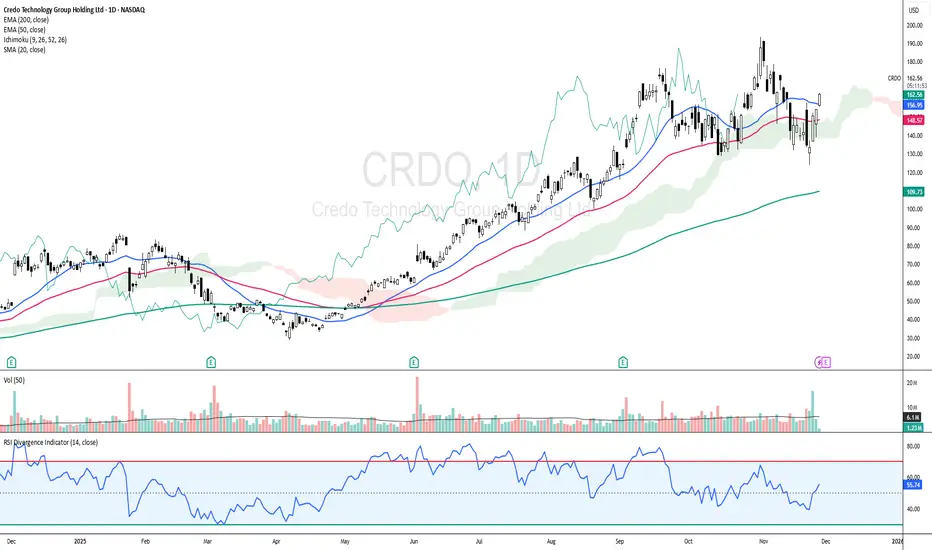
CRDO: Cloud + EMAs Aligning for Upside ContinuationCRDO - CURRENT PRICE : 162.95
CRDO is showing a bullish reversal setup as price rebounds and closes back above the EMA50 while holding firmly above the Ichimoku Cloud , signaling the major trend remains intact. Momentum is improving with RSI rising above 50 and not yet overbought, supported by increasing volume on the recent bullish white candlestick.
Today’s move above the 20-day SMA adds a positive layer to the short-term trend structure. Short term targets are 175.00 and 185.00 while support is 148.00.
ENTRY PRICE : 160.00 - 162.95
FIRST TARGET : 175.00
SECOND TARGET : 1.85
SUPPORT : 148.00
Ichimokuchart
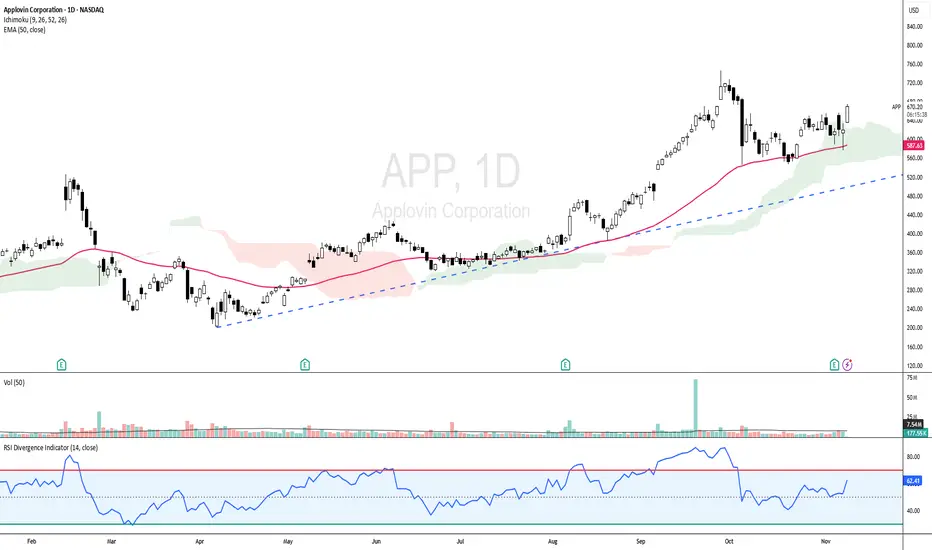
APP - UPTREND STILL INTACT!APP - CURRENT PRICE : 670.00 - 674.00
APP is showing strong bullish momentum as the price trades above the 50-day EMA and ICHIMOKU CLOUD , indicating a sustained uptrend. The RSI is in bullish territory but not yet overbought, indicating room for further upside. With the current setup, the stock has potential to retest its all-time high area if momentum continues.
ENTRY PRICE : 670.00 - 674.00
FIRST TARGET : 727.00
SECOND TARGET : 770.00
SUPPORT : 50-day EMA
IQV - BUY ON DIPS IQV - CURRENT PRICE : 184.08
From May to July, IQVIA (IQV) staged a strong upward rally, supported by rising volume. Following this advance, the stock underwent a healthy retracement, consolidating recent gains without breaking its long-term uptrend. Take note that the up trendline is still intact.
Currently, price action shows signs of support around the Fibonacci 38.2% retracement level , coinciding with both the Ichimoku Cloud and the 50-day EMA . This confluence suggests the retracement phase may be complete, presenting a good opportunity to apply a Buy on Dips strategy as the stock prepares for its next upward leg.
ENTRY PRICE : 183.50 - 184.50
TARGET : 205.00 and 215.00
SUPPORT : 166.00

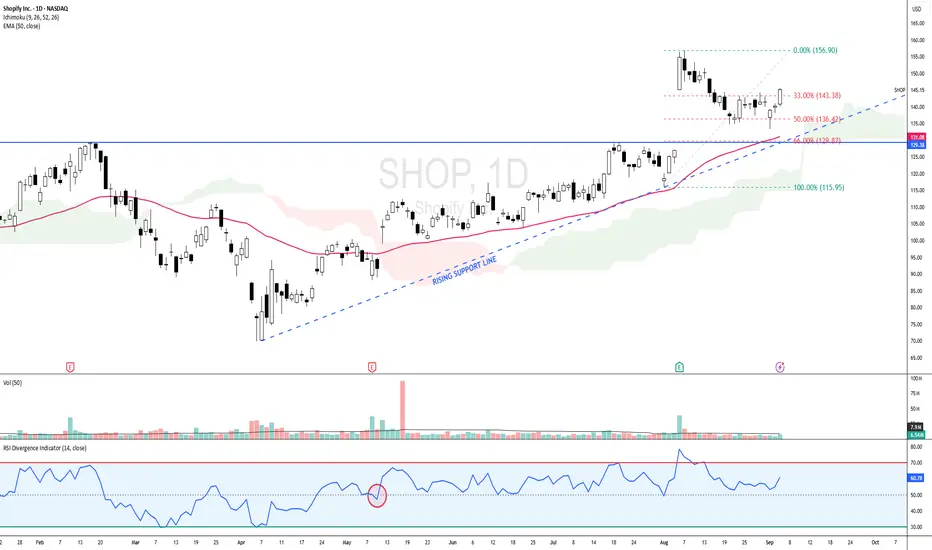
SHOP - BULLISH SCENARIO since 12 MAY 2025 SHOP - CURRENT PRICE : 145.15
SHOP is bullish as the share price is above 50-day EMA. Price action on 12 MAY 2025 is considered starting of bullish scenario because supported by several key indicators :
Share price gap up
Price broke out 50-day EMA
Price moving above ICHIMOKU CLOUD
RSI moving above 50
From 1 August (near 50-day EMA support) to 6 August, the stock recorded a strong upward rally. Following this advance, prices entered a corrective phase and retraced approximately 50% of the prior upswing. According to Dow Theory, such a retracement is considered a normal and healthy correction within an ongoing uptrend. Retracements in the range of one-third to two-thirds of the prior move are typical, with the 50% level often serving as a natural equilibrium point where buyers re-enter the market. Sustaining above the 50% retracement level would reinforce the bullish structure, while a recovery from this zone could pave the way for a retest of the recent highs. However, a decisive break below the 61.8% retracement may imply weakening momentum and a deeper corrective phase.
Take note that until now the share price is still above 50-day EMA and ICHIMOKU CLOUD while RSI also moving steadily above 50 level. There is also rising support line - strengthening bullish outlook.
ENTRY PRICE : 141.00 - 145.50
TARGET : 159.00 and 175.00
SUPPORT : 50-day EMA (CUTLOSS below 50-day EMA on closing basis)
QUBT - All MAs Pointing North!QUBT - CURRENT PRICE : 21.32
Technical Analysis Summary
Trend Analysis: The 20-day SMA is sloping upward, indicating short-term bullish momentum. Both the 50-day EMA and 200-day EMA are also trending higher, confirming that the medium- and long-term trends remain positive. Price is trading above all key moving averages, reinforcing a healthy uptrend structure.
Momentum Indicator (RSI): The RSI (14) is currently around 56, which is within the bullish territory (above 50). This shows positive momentum and room for further upside before entering overbought conditions.
Volume Analysis: Recent up-moves have been accompanied by rising volume, suggesting that the buying interest is supported by strong participation from investors.
Ichimoku Cloud: The price is above the Ichimoku Cloud, confirming the bullish sentiment and strong price structure. Chikou Span is above candlesticks and cloud further strengthening bullish outlook.
ENTRY PRICE : 21.20 - 21.40
FIRST TARGET : 25.00
SECOND TARGET : 28.00
SUPPORT : 18.00

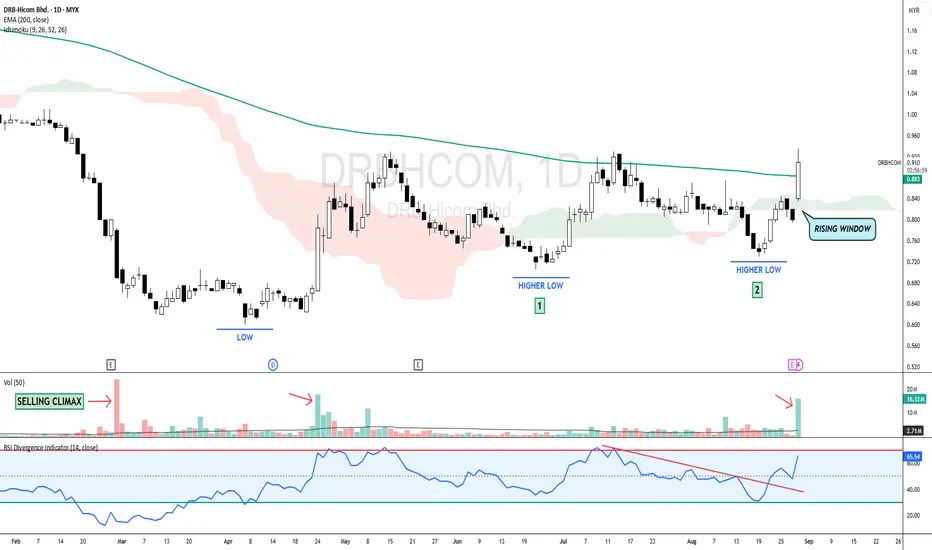
DRBHCOM - BREAKOUT EMA 200 with VOLUME !DRBHCOM - CURRENT PRICE : RM0.910
DRBHCOM broke out EMA 200 with high trading volume. At the same time, the stock is also above ICHIMOKU CLOUD. Take note that the lows in price are getting higher - indicating demand is increasing. This bullish scenario is also supported by recent breakout down trendline in RSI oscillator. RSI is rising and currently at 65.54.
Take note also that there is a double bottom chart pattern with the second low is slightly higher than previous low.
There is possibility that the price may trend higher in near term. Rising window low RM0.820 may acts as strong support.
ENTRY PRICE : RM0.900 - RM0.910
TARGET : RM0.980 and RM1.09
SUPPORT : RM0.820
Notes : The company just announced its QUARTER REPORT. For more details, please visit their website. Previously I had wrote technical report for the company (already hit my both targets). I share the link below here.
CELH - From BEARS to BULLSCELH - CURRENT PRICE : 57.82
After completing a bearish reversal formation in the shape of a Double Top , the stock broke down from the neckline and entered a prolonged downtrend phase. This weakness was confirmed by the Relative Strength Index (RSI) , which stayed consistently below the 50 level, indicating persistent bearish momentum.
Subsequently, the stock established a saucer (bottom reversal) pattern , signaling a gradual shift in sentiment from selling pressure to accumulation (indicating a slow accumulation phase rather than a sharp reversal). Although there was no distinct breakout point, the gradual price recovery signaled a shift in market sentiment. This transition is supported by the RSI moving above and holding above the 50 level, suggesting strengthening bullish momentum.
Additionally, the stock has recently bounced off an internal trendline , reinforcing a "buy-on-dips" opportunity within the current uptrend. With this setup, there's an estimated upside potential of around 9% toward retesting its 52-week high, making it a favorable technical setup for short- to medium-term traders. For ICHIMOKU CLOUD traders, take note also that the share price is trading above cloud since 17 March 2025.
ENTRY PRICE : 56.00 - 58.00
TARGET : 63.00 and 69.00
SUPPORT : 52.00 (CUTLOSS below 52.00 on closing basis)
Notes : INTERNAL TRENDLINES are variations of the trendline that don't rely on extreme highs or lows. Instead, internal trendlines are drawn through the price action and connect as many internal peaks or troughs as possible. Some chartists develop good eye for this type of trendline and find them useful. The problem with internal trendlines is that their drawing is very subjective, whereas the rules for drawing of more traditional trendlines along the extreme highs and lows are more exact.

MU - POTENTIAL 52-WEEK HIGHMU - CURRENT PRICE : 118.89
The share price rises almost 111% from the bottom of 07 April 2025 to the high of 26 June 2025. Then the stock starts to pullback. It retraces at Fibonacci golden ratio of 38.2%. Last Friday the stock rises and closed as a bullish LONG WHITE CANDLE with high volume - indicating strong buying interest from investors/traders.
This bullish scenario is also supported by some other indicators such as :
1) Price above 50-days EMA
2) Price closes above ICHIMOKU CLOUD (KUMO)
3) RSI reading at 58.95 (above 50 considered bullish)
4) Price is trading near 52-week high level
With all the evidence mentioned above, now may considered as a buying opportunity. 1st target should be one- or two-dollar below the actual 52-week high resistance level.
ENTRY PRICE : 115 - 119
TARGET : 128 and 135
SUPPORT : 108

Gold MCX Bullish MoveGold as long as it is staying above the ichimoku cloud it can show a bullish move from here within a few days.. this month we can expect some movement on the upside clearing highs.
Stop loss can be kept near 94700-95300 levels with target of 102000 - 105000 with this month.

HSSEB - ASCENDING TRIANGLE BREAKOUT !HSSEB - CURRENT PRICE : RM0.710
HSSEB is bullish because :
The stock is above 50-day EMA.
The share price is above ICHIMOKU CLOUD
CHIKOU SPAN is above CANDLESTICK
RSI is above 50
Today (20 August 2025) the stock broke out ASCENDING TRIANGLE pattern with high trading volume - indicating strong bullish momentum. The stock may trend higher in near term.
ENTRY PRICE : RM0.700 - RM0.710
TARGET : RM0.780 and RM0.845
SUPPORT : 50-day EMA (CUTLOSS if price close below 50-day EMA)

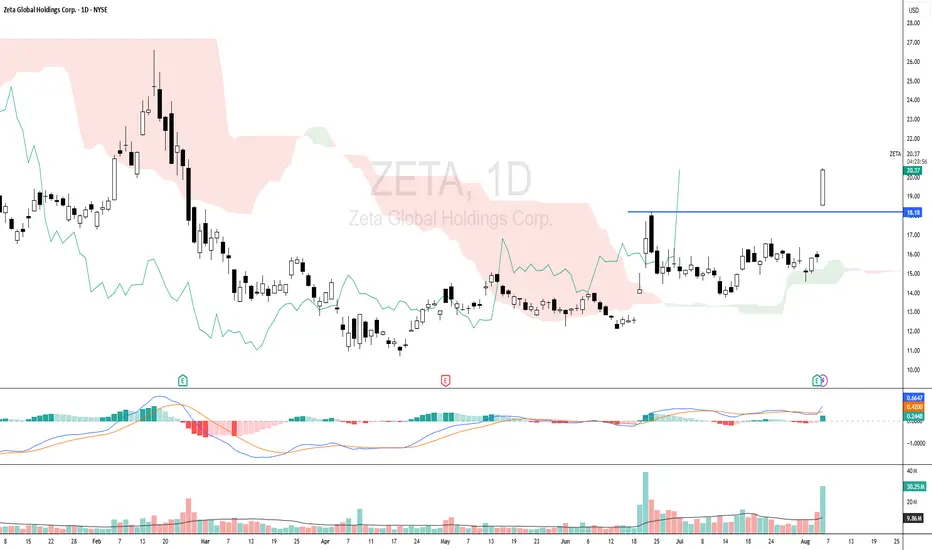
ZETA - BREAKOUT NEAREST RESISTANCEZETA - CURRENT PRICE : 20.10 - 20.25
ZETA broke out its nearest resistance 18.18 after the company announced its Quarter Earnings. For more details regarding earnings, investors/traders may visit company's website.
This bullish price action is supported by high trading volume - indicating strong buying interest from investors/traders. MACD is bullish. For ICHIMOKU CHARTS TRADERS, take note that CHIKOU SPAN is moving above candlestick which give a bullish outlook.
ENTRY PRICE : 20.00 - 20.30
TARGET : 21.50 , 23.00 and 24.50
SUPPORT : Below 18.18 (CUT LOSS below 18.18 on closing basis)
The cloud with the help of the Tenkan we will rise!!Shit is about to get real.
I was telling folk to look at BTC @ $19....
This could be the time.
NOT FINANCIAL ADVICE

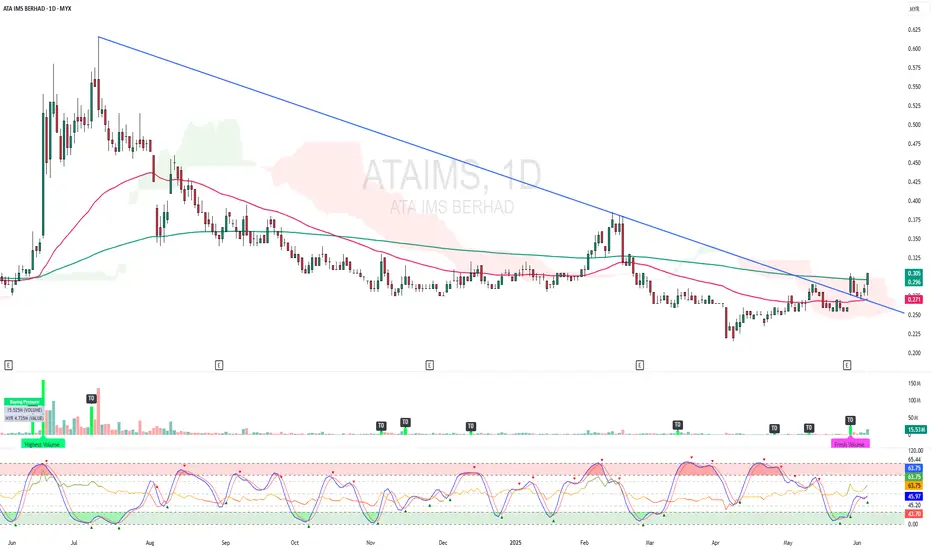
ATAIMS - BREAKOUT EMA 200 and CLOUD !ATAIMS - CURRENT PRICE : RM0.305
ATAIMS is bullish as the price is above EMA 50 and 200. The stock broke above EMA 200 and ICHIMOKU CLOUD on last FRIDAY (06 JUNE 2025) with high volume. Supported by technical reading in RSI heading upward, the stock may continue to move higher in the upcoming session.
ENTRY PRICE : RM0.300 - RM0.305
TARGET PRICE : RM0.340 and RM0.370
SUPPORT : RM0.270
XAGUSD bullish momentum to uptrendPrice is above the cloud, Tenkan and Kijun sen showing a clear uptrend. Expected target is 35. The future cloud is expanding showing a continuing uptrend.

MicroStrategy (MSTR) – Ichimoku Cloud Reclaim SetupMSTR needs a daily close above $318 to officially reclaim the Ichimoku Cloud on the 1D chart. This would flip the bias back bullish and invalidate the recent mid-cloud rejection seen near the $315–317 zone.
Why $318?
That’s the top of the current Kumo (Senkou Span B = $317.96)
A close above confirms a full cloud reclaim, shifting trend momentum
MACD is turning bullish, and RSI is recovering above 50 — signs of building strength
🔍 What I'm Watching:
✅ Daily close > $318
✅ Confirmed MACD crossover (on Ultimate MACD)
✅ RSI holds above 50
🎯 Trade Plan (if confirmed):
Long bias above $318
Initial target zone: $340–$355
Risk: Daily close back below Tenkan ($311)

GADANG - Turning BULLISH based on ICHIMOKU CLOUD ?GADANG - CURRENT PRICE : RM0.355
GADANG is changing trend from sideways to UPTREND. Take note that the high is getting higher and the low is getting higher.
The stock is BULLISH based on ICHIMOKU CLOUD because :
i) CHIKOU SPAN is above candlestick
ii) Price is above CLOUD
iii) CHIKOU SPAN is above CLOUD
iv) There is a bullish crossover (TENKAN SEN crosses up KIJUN SEN) - Personally i don't use TENKAN SEN and KIJUN SEN to trading or analysing.
ENTRY PRICE : RM0.355
TARGET : RM0.385 , RM0.410 , RM0.440
STOP LOSS : RM0.320
Notes : GADANG is a construction company. According to TA Research, the group's construction order book stood at RM1bil as of end-November 2024. The company is syariah compliant.

NATGATE - 11 RECORD SESSION LOWS ?NATGATE - CURRENT PRICE : RM1.79
On 02 August 2024, the stock made a FALLING WINDOW . The selling pressure continues until price starts to stabilize and create a double bottom support level near RM1.65 - 1.68.
On 29 October 2024, the share price closes above the top of FALLING WINDOW resistance level indicates strong bullish momentum. At the same time, the share price also successfully closed above ICHIMOKU CLOUD (after trading below KUMO almost 3 months). This two scenario gives strong bullish outlook for NATGATE. From here, the stock continue moving upside until RM3.03 (ALL TIME HIGH) - upside movement of 40% from the breakout point on 29 OCTOBER 2024.
After reach ALL TIME HIGH, the stock made an EVENING STAR pattern. From there, the stock starts declining and makes 11 RECORD SESSION LOWS.
Here is the important points to have a look. We can expect a rebound from current price as there are some hints given by chart :
1) 11 RECORD SESSION LOWS creates an OVERSOLD situation (The record session topic is discussed by STEVE NISON in his book - BEYOND CANDLESTICK , PAGE 121 - 127)
2) The last two session was bullish HAMMER - the long lower shadows give hint that potential bottom had reached and the bears are getting tired.
3) Price bounce from the previous DOUBLE BOTTOM support level area near RM1.65 - RM1.68 indicates that the BULLS are aggresively buying the shares near the support level.
In conclusion, as a aggresive trader, this is an oppurtunity for me to buy the stock at price RM1.79 - RM1.81. If as expected the share price starts rebound higher, i would take my profit at RM1.95 (+8%) and RM2.05 (+14%). My support level will be RM1.68 (the low of bullish hammer). My time frame for trading this stock is only one month.
ENTRY PRICE : RM1.79 - RM1.81
TARGET PRICE : RM1.95 , RM2.05
STOP LOSS : RM1.68
TIME FRAME - Not more than ONE MONTH
TAYOR !

AUMAS - Positive corelation with GOLD price movement ?AUMAS - Current price : RM0.890
AUMAS is bullish as the share price is above 50-day EMA. Note that the price breakout ICHIMOKU CLOUD on 31 JANUARY 2025 with high trading volume.
Gold future price surge to new high due to uncertainty and weak global sentiment. AUMAS is engages in gold mining business in Malaysia. The share price have a positive corelation with gold price movement. As such, i expect the share price may move higher in the upcoming session.
ENTRY PRICE : RM0.890
TARGET : RM0.980 (+10%)
STOP LOSS : RM0.820 (-7%)
Notes : The company was formerly known as Bahvest Resources Berhad and changed its name to AuMas Resources Berhad in December 2024. AuMas Resources Berhad was incorporated in 2004 and is headquartered in Tawau, Malaysia.

BTC Trend in 2025: (Based on Ichimoku)Based on my previous analysis from march 22, 2024 , the BTC trend is still bullish.
According to our medium-term analysis , it has hit our TPs and we see retracement nowadays.
Bitcoin will record new ATH(s):
113866
122524
137082.5
And important support levels:
87800
69000

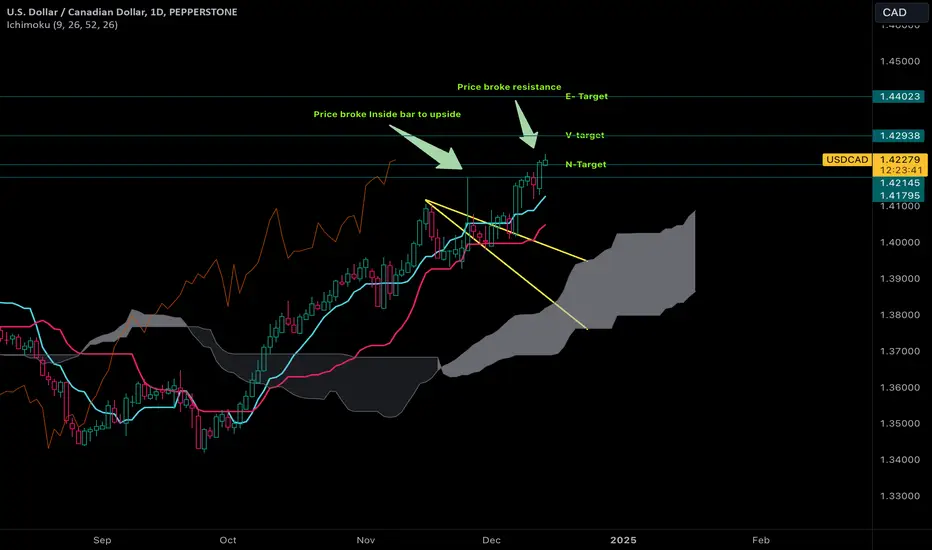
How High Can USD-CAD Go? USD - CAD has been going up and is in a strong bullish trend according to Ichimoku signals.
Ichimoku:
-Tenkan Sen is avove Kijun Sen and pointing up
-Kumo is up, thick and Senkou Span A and B are pointing up
-Chikou Span is above the candles and has no resistance in the future
-Price broke Yellow focus lines to the upside
Price action:
-broke big inside bar to upside
-broke couple doj at resistance level
-broke resistance level
Price Target:
-Price reached n-target but could get tot V and E, because there are no signals of slowing down.
Weekly is also strong bullish.
*im a beginner trader and learning. I make these analyses for myself. Please comment on my analysis because i want to learn.
www.tradingview.com
DOGE/USDT Long Setup: Breakout and Trend ContinuationThis trade setup for DOGE/USDT highlights a bullish continuation opportunity. The price is consolidating above the key support level, with Ichimoku indicators signaling an ongoing uptrend. A breakout above the recent high supports the bullish bias, targeting the resistance zone near $0.6990. The stop-loss is set below $0.3560, ensuring risk is managed effectively. This setup aligns with the overall market structure, indicating strong momentum and trend continuation potential.

Potential short position EURJPYBias
On the H4 chart, we have potential bullish signal.
Entry
Entry is on the 15M chart, where we will use the 61.8% and 78.6% retracement level.
Stop Loss
For the 61.8% entry, the stop loss is at 78.6% while for the 78.6%, the stop loss is at the 100% level
Risk
Risk is at 0.1% of the account
Comments
This strategy tends to have a low win rate but a relatively high risk reward ratio. We therefore have to proceed with caution.

BTC Weekly Analysis (Daily Timeframe)If Bitcoin breaks the 69489 range, along with Ichimoku components in the weekly time frame, it will reach the mentioned high levels and will react to them.
The support levels are important for downward movement and at these levels we think about buy trades.
