EUR to do the Pounding? Ichimoku EUR/GBP Trade IdeaThis pair has been on a nice bullish run lately and we are now looking for this strong support level to hold. I am looking to enter a kijun bounce trade here which will allow us to keep a pretty tight stop loss and a nice risk reward ratio. I am targeting the previous candle stick body close as my take profit point. If we break below kijun or our bullish confirmations change to bearish, this setup may become invalidated.
Ichimokuchart

Don't Swiss out on this one - Ichimoku USD/CHF Trade IdeaPrice has made two moves to the upside now and has been rejected. With the current movement I am expecting price to try and continue to push lower. If we get the drop we're looking for, it will also be confirmed with a bearish kumo twist that has been trying to complete for the past few trading days. As soon as we break below our previous low, I'll be looking to enter a sell, with a long term target of our previous low. If we fail to break our recent low, or our bearish signs change to bullish, this setup may become invalidated.

EUR going to profit with this one - Ichimoku EUR/USD SetupPrice fell and and found support in the cloud, it's now looking to get a kumo breakout along with a TK cross. I'll be looking to enter a long on a confirmed move up and I've marked out several areas we can take profit at. We may get more opportunities to add to the position if those blue lines I drew also end up acting as support. If we fail to breakout and hold above the cloud, or our bullish confirmations change, this setups may become invalidated.

Future of Aurelia Metals Limited2018.06.28 TA Report
Aussie Market Buy/Sell ratio = 0.35
Buys: 251 (12.2%)
Sells: 716 (34.8%)
Hold: 1091 (53.0%)
Let's see previous 5 days relative timing values by VectorVest on this stock:
28-Jun = 1.26
27-Jun = 1.28
26-Jun = 1.31
25-Jun = 1.33
22-Jun = 1.31
AMI.AX has a current Value of $1.10 per share, which is undervalued compared to its Price of $0.57 per share. Value is computed from forecasted earnings per share, forecasted earnings growth, profitability, interest, and inflation rates.
RT analyzes a stock's price trend. AMI.AX has a Relative Timing of 1.26, which is very good on a scale of 0.00 to 2.00. RT is computed from an analysis of the direction, magnitude, and dynamics of a stock's price movements day-over-day, week-over-week, quarter-over-quarter and year-over-year. If a trend dissipates, RT will gravitate toward 1.00.
As RT -0.90% hits close to 2.00, we considered CLV -0.55% .AX is overbought atm. For a longer run, Midas Touch graph still look very well.
Let’s have a look on the technical analysis for more information:
Today’s insights
On 8th Jun, AMI.AX announces that it has been informed that Pacific Road Capital’s entire 36.7% shareholding (313.7M shares) in the Company was successfully sold and placed to a range of existing and new institutional investors overnight.
Well, that news didn't quite stimulate the stock price, but it shot up 10% to form a Lower High, forming a symmetry triangle pattern (see the left chart), MACD crossover downward began on 12th Jun.
We can also see the recent RT values has been descending for a few days, it tells us that the timing is not right of this particular stock. We have a principle in trading penny stocks: “Buying shares in rising market”, not “Buying shares in declining market” nor “Averaging shares in declining market.”
Conversely, In the Ichimoku analysis, the chinkou span is still currently above price, and there is no sign of tankan-sen cross below kijun-sen at this moment.
At last, we cannot conclude AMI will fall, but we at least protect our profit by the support levels below:
VectorVest suggested stop price at $0.49
Fibonacci Ratio 38.2% at $0.535
Ichimoku’s chinkou span support at $0.54

EURJPY IS A SELLAs I go over the timeframes, price and lagging line has passed the cloud going down. Since its based from the one hour chart, it will take a day to get a major effect going down.

NXT : made with love !Pending Buy Limit NXT/BTC at 0. 000 008 29
SL : 0. 000 005 00
TP1 : 0. 000 073 56tt
TP2 : 0. 000 140 00
TP3 : 0. 000 265 19
Enjoy the #khalilShow ( ^ _ ^ )

EUR/JPY - Ichimoku Long Trade IdeaThis pair has broken up and out of the cloud and is now attempting to break our previous recent high. If we can break that high then I see more room for potential upward movment. I'll be looking to enter upon a breaking of that support, tarting a previous strong level of support/resitance as my TP level. If our bullish signs change to bearish, or we fail to break resistance. This setup may become invalidated.

GBP/CHF - Ichimoku Short Trade IdeaThis pair has lost some momentum and started to consolidate here. I am looking for a break to the downside for a chance to short this pair. If price falls down below Tenken sen I will look for my entry. All confirmations remain bearish despite the loss of momentum so it will continue to be my bias until proven otherwise. If our bearish signs change to bullish, or we fail to break below Tenken sen, this setup may become invalidated.

AUD/USD - Ichimoku Long IdeaThis pair fell into the cloud before finding a bit of support. it is now prepped to try and challenge recent highs as it tries to breakout of the cloud. Ideally we would see a bullish TK cross to as price rises above our recent high to help verify a chance to get long. I am targeting a previous high as my TP level, should I enter. If our bullish confirmations change to bearish or we fail to break above resistance, this setup may become invalidated

EUR gonna want to see this! Ichimoku EUR/USD Trade Idea!While this pair is bearish on the daily, a bullish breakout here could confirm we are in for a drawback on the daily chart. I've drawn out a few TP levels to be targeted. I am waiting to enter until we get a bullish kumo breakout and the kumo twist completes to a bullish cloud. Chikou span is just starting to break through price so I'd like to see it rise a little and get clear of it as well. If we fail to break through the cloud, we go back to a bearish TK cross, or the kumo twist does not complete, it may invalidate this setup.

Swiss Miss? Ichimoku USD/CHF Trade IdeaThis is a continuing entry from the setup a couple weeks ago. We had been tracking a sell on this pair from the daily for a while and I am still looking to add to my sell as price keeps falling. I am looking for either an entry at a kijun rejection or a break of the blue line I drew for a secondary entry point. I am still targeting the same TP level from our original entry that is now up around 90 pips. If we start getting bullish confirmations, it may signal its time to get out of our sell position.

Sushi Down Under? Ichimoku AUD/JPY Trade IdeaThis pair has been stuck in a range on the daily chart and I am looking to capture some pips on the way back to the top of that range. I am looking for a bullish kumo twist to complete, a bullish kumo breakout, and chikou span to get above and free of price to enter a buy. I am targeting a previous candle body close at the top of that zone as my larger TP, but i've drawn out a couple more that I will close partial if it rises. If we fail to get these bullish confirmations, this setup may become invalidated.

Get your Guns, Its *ALMOST Turkey Shootin' SeasonHello to anyone who might be reading this! Going to be writing more of these as a personal practice and reference so that I can become a more thoughtful trader of coins. If this gives you a thought, great! But this is not investing advice
We have various buy signals on a dipping Ethereum. Let us remind ourselves that there are MANY other ERC-20 coins that have promise (ex: 0x, REP, OMG) and all of them still depend on the success of ETH which gives ETH validation that it is going nowhere for some time.
With that being said then, where's the lowest price we can get into this damn thing?
*****************
TECHNICALS
-RSI downward trend just breached the lower margin
-Stochastic just breached the lower margin twice forming a "w"
-"Natural" ABCD fall is currently setup perfectly for the first and second Elliott Wave
-"Fibinoci Rebuy Zone" of 61.8% to 78.6% resistances
ICHIMOKU's
-Chikou (Lagging span) just crossed the Tenkan-sen (Blue) and the Kijun-sen (Red) but had a sharp spike up so keep your eye on this to see if it follows upwards with the Kijun-en.
-Price action is finding resistance on the lower margin of the the ichimoku cloud on Span B.
Note:
Most likely to continue downward as BTCUSD also takes a last correction dip before heading to 3rd Elliott Wave. According to a few other posts, this exact day might be on the "6th" due to historical patterns.
Buy: Below 520
Sell Half for profit: 900

EURUSD IS A BUY INTRADAY TRADEIts a clear sign that EURUSD is a buy based on the lagging line and price are above cloud. This is a good for Intraday trade.
Tp: 1.152 to 1.155

Bullish Aussie to rule the yen? Ichimoku AUD/JPY Trade IdeaThis pair is currently in the cloud but looks to be setting up to try and have a bullish breakout soon. I'll be looking to enter on a kumo breakout and I've drawn out a few take profit levels I'll be looking to close partial positions at. If our bullish signs or confirmations change to bearish, this setup may become invalidated.

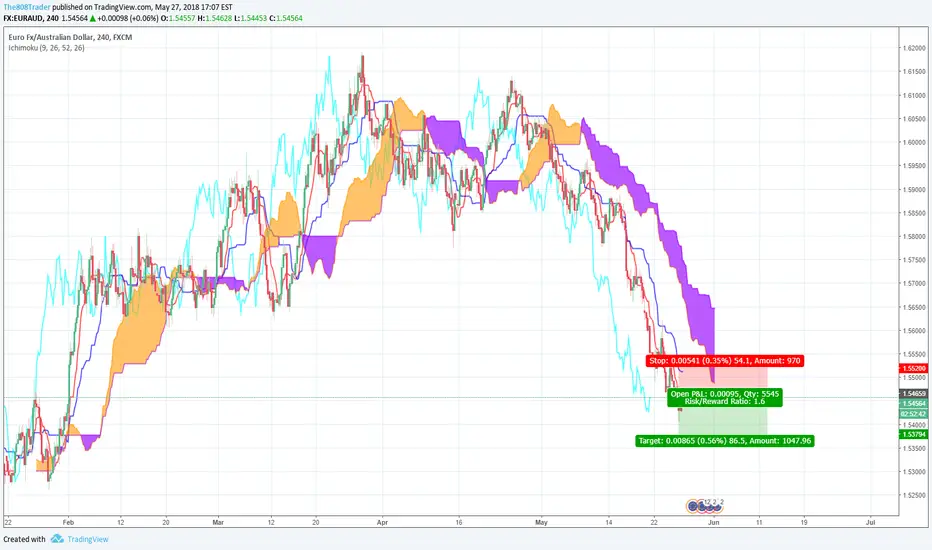
Aussie going down under? Ichimoku EUR/AUD Trade IdeaThis pair has been on a strong bearish run for a while now, and I'm looking to get back into it. We're testing tenken sen right now and I am looking for a rejection to enter a sell. I'l be setting my stop just above kijun, and targeting a previous level of support/resistance for my TP. If our bearish signs and confirmations change, this setup may become invalidated.
The Golden Hour - Ichimoku Gold Trade IdeaGold had been on a slight rise last week and the news of the North Korea summit being put on hold send it sharply higher. I am looking for this trend to continue once we get a bullish breakout. We got othe kumo twist we were looking for and it held at tenken sen. I am targeting previous resistance for my TP. If our bullish signs and confirmations change, this setup may become invalidated.

UPDATE GBPJPY May 27th-June 1st, 2018As I mentioned in my previous idea for GBPJPY as the market closed this week, it did hit my take profit at 145.412 based on the 4 hour chart yesterday. Most likely, we should be seeing price go 144 or below. Please stay on the look out this upcoming week as this could possibly continue as a sell.

GBPJPY is a Strong SellAfter looking at most of the timeframes, GBPJPY price has broke through the cloud on a indication for a sell.
Your Take Profit should be at 145.412 based on the 4 hour chart.
Tp: 145.412

NEOETH 1D Oversold / C-clamp bouceNEOETH offering potential upward move on daily.
RSI oversold, MACD crossing and disequilibrium between Kijun and Tenkan-Sen.
Watch for Tenkan price crossover for entry and Kijun as resistance.
Stop loss below support line.

Aussie Oi Oi Oi! - Ichimoku Long AUD/USD Trade IdeaWe rode this one down for some nice profit last week, and now signs have reversed. We've broken up into the cloud then out. I am looking to take advantage of this temporary USD weakness to get in a long position. I am looking for a drop to support then up and back out again with our TP at a strong level of support/resistance. If support fails to hold or our bullish confirmations change to bearish, this setup may become invalidated.

I Looovvee GOOOOOLLLLDD - Ichimoku XAU/USD Trade IdeaGold has finally broken up and out of the cloud, but I am looking for a drop to support to act a spring board to push further up. If we drop to support that is where I'll look to get long, targeting a major area of previous resistance. If support fails to hold or our bullish confirmations change to bearish, then this setup may become invalidated.

Swiss Cheese and Profit? Ichimoku USD/CHF Trade IdeaThe Swiss Dollars has been on a text book bullish breakout and run over the past few weeks. We've finally started to fall down and test Tenken Sen. If we break below Tenken Sen the I will be looking to sell on the drawback to Kijun. We can also confirm this early by watching the 1 hour and 4 hour charts for a bearish breakout since I know it can can mess with your psychology to counter trend trade on a larger chart. If we fail to have a bearish breakout on the smaller time frame charts or we fail to break below Tenken Sen on the daily, this setup may become invalidated.
