SILVER: The Market Is Looking Down! Short!
My dear friends,
Today we will analyse SILVER together☺️
The market is at an inflection zone and price has now reached an area around 49.885 where previous reversals or breakouts have occurred.And a price reaction that we are seeing on multiple timeframes here could signal the next move down so we can enter on confirmation, and target the next key level of 49.478.Stop-loss is recommended beyond the inflection zone.
❤️Sending you lots of Love and Hugs❤️
Ict

EURUSD: Strong Bullish Sentiment! Long!
My dear friends,
Today we will analyse EURUSD together☺️
The price is near a wide key level
and the pair is approaching a significant decision level of 1.15720 Therefore, a strong bullish reaction here could determine the next move up.We will watch for a confirmation candle, and then target the next key level of1.15950.Recommend Stop-loss is beyond the current level.
❤️Sending you lots of Love and Hugs❤️

EURUSD BEARISH BREAKOUT|SHORT|
✅EURUSD confirms a clean breakout below the key level, showing bearish continuation as price rejects premium pricing. Liquidity has been cleared above structure, and Smart Money targets the 1.1520 zone for rebalancing. Time Frame 6H.
SHORT🔥
✅Like and subscribe to never miss a new idea!✅

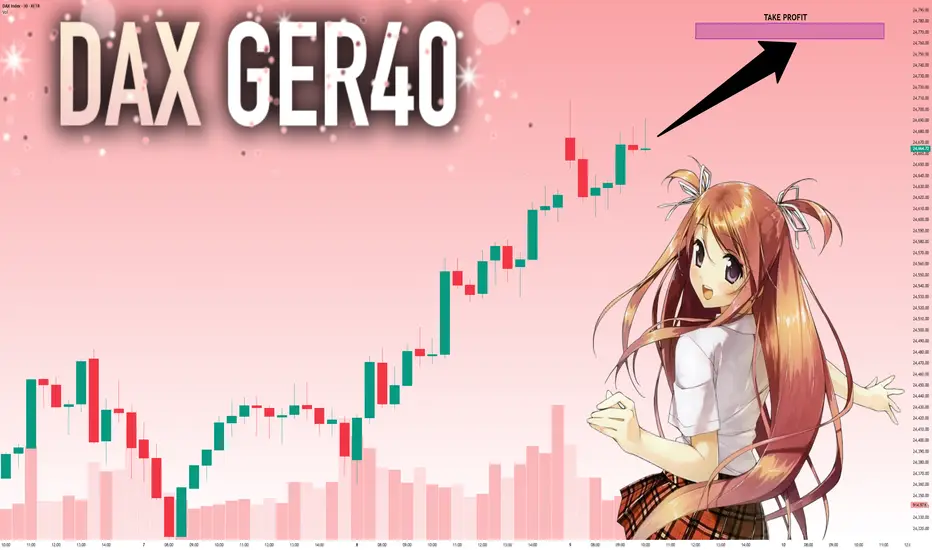
DAX: Bulls Are Winning! Long!
My dear friends,
Today we will analyse DAX together☺️
The recent price action suggests a shift in mid-term momentum. A break above the current local range around 24,671.00 will confirm the new direction upwards with the target being the next key level of 24,764.14 and a reconvened placement of a stop-loss beyond the range.
❤️Sending you lots of Love and Hugs❤️
EURUSD: Target Is Down! Short!
My dear friends,
Today we will analyse EURUSD together☺️
The in-trend continuation seems likely as the current long-term trend appears to be strong, and price is holding below a key level of 1.16237 So a bearish continuation seems plausible, targeting the next low. We should enter on confirmation, and place a stop-loss beyond the recent swing level.
❤️Sending you lots of Love and Hugs❤️

SILVER: Move Up Expected! Long!
My dear friends,
Today we will analyse SILVER together☺️
The market is at an inflection zone and price has now reached an area around 49.658 where previous reversals or breakouts have occurred.And a price reaction that we are seeing on multiple timeframes here could signal the next move up so we can enter on confirmation, and target the next key level of 50.087.Stop-loss is recommended beyond the inflection zone.
❤️Sending you lots of Love and Hugs❤️

GOLD: Local Bearish Bias! Short!
My dear friends,
Today we will analyse GOLD together☺️
The price is near a wide key level
and the pair is approaching a significant decision level of 4,037.82 Therefore, a strong bearish reaction here could determine the next move down.We will watch for a confirmation candle, and then target the next key level of 4,029.18.Recommend Stop-loss is beyond the current level.
❤️Sending you lots of Love and Hugs❤️

EUR/NZD Correction Loading… or Just a Trap? Watch 2.0000 Closely🔹 COT (Commitment of Traders)
Euro Futures: Non-commercial longs slightly decreased (-789) while shorts increased (+2,625) → mild bearish tone on EUR.
NZD Futures: Non-commercial longs rose sharply (+3,044) along with shorts (+6,160) → institutional traders adding exposure on both sides, but still heavily net short on NZD (≈3:1 short/long).
📌 Combined Interpretation: Despite the small decline in EUR sentiment, the strong short positioning on NZD keeps the broader bias bullish for EUR/NZD in the medium term, though near-term correction is likely after recent highs.
🔹 FX Sentiment (Retail Positioning)
82% short vs 18% long.
📌 Retail traders are extremely net short → strong contrarian bullish signal. This suggests the downside could be limited before another potential upside leg.
🔹 Seasonality
October is typically positive for NZD.
EUR tends to be flat to slightly negative in October.
📌 Seasonal bias: mildly bearish for EUR/NZD — NZD’s seasonal strength could fuel a temporary pullback, aligning with the current technical setup.
🔹 Price Action
Rejection from major supply zone 2.0250–2.0350, forming a potential double-top.
Price now consolidating near 2.0050–2.0000, sitting just above key structure and ascending trendline support.
RSI neutral → room for further retracement.
Break below 2.0000 could accelerate the correction toward 1.9850–1.9750 demand zone.
Bullish structure would resume only above 2.0250.
🎯 Outlook: Expect a corrective leg toward 1.9850–1.9750 before potential bullish continuation. Structure remains constructive as long as price stays above 1.9700.

GBPNZD RISKY LONG|
✅GBPNZD is reacting from a clean demand level after liquidity grab below short-term lows. Price structure remains bullish, suggesting a possible continuation toward the 2.3200 target zone as Smart Money accumulates long positions. Time Frame 2H.
LONG🚀
✅Like and subscribe to never miss a new idea!✅

XAU/USD Update 1Next move on the way, focus on proper risk management & stay disciplined. Wishing you successful trades..!
Key Reason:
1. Market structure remain bullish with BOS confirmation.
2. Fresh demand zone still pending.
3. Price expected to retrace towards strong demand zone for liquidity grab.
4. If bullish momentum remain strong then we'll see further upside move.
This is not a financial advice. Confirmation very important. Let's see how it will work.

DXY: Will Go Down! Short!
My dear friends,
Today we will analyse DXY together☺️
The recent price action suggests a shift in mid-term momentum. A break below the current local range around 98.437 will confirm the new direction downwards with the target being the next key level of 98.260 and a reconvened placement of a stop-loss beyond the range.
❤️Sending you lots of Love and Hugs❤️

GOLD: The Market Is Looking Up! Long!
My dear friends,
Today we will analyse GOLD together☺️
The market is at an inflection zone and price has now reached an area around 4,030.40 where previous reversals or breakouts have occurred.And a price reaction that we are seeing on multiple timeframes here could signal the next move up so we can enter on confirmation, and target the next key level of 4,056.64.Stop-loss is recommended beyond the inflection zone.
❤️Sending you lots of Love and Hugs❤️

EURUSD: Strong Bullish Sentiment! Long!
My dear friends,
Today we will analyse EURUSD together☺️
The in-trend continuation seems likely as the current long-term trend appears to be strong, and price is holding above a key level of 1.16347 So a bullish continuation seems plausible, targeting the next high. We should enter on confirmation, and place a stop-loss beyond the recent swing level.
❤️Sending you lots of Love and Hugs❤️

SILVER: Bears Are Winning! Short!
My dear friends,
Today we will analyse SILVER together☺️
The price is near a wide key level
and the pair is approaching a significant decision level of 49.015 Therefore, a strong bearish reaction here could determine the next move down.We will watch for a confirmation candle, and then target the next key level of 48.691.Recommend Stop-loss is beyond the current level.
❤️Sending you lots of Love and Hugs❤️

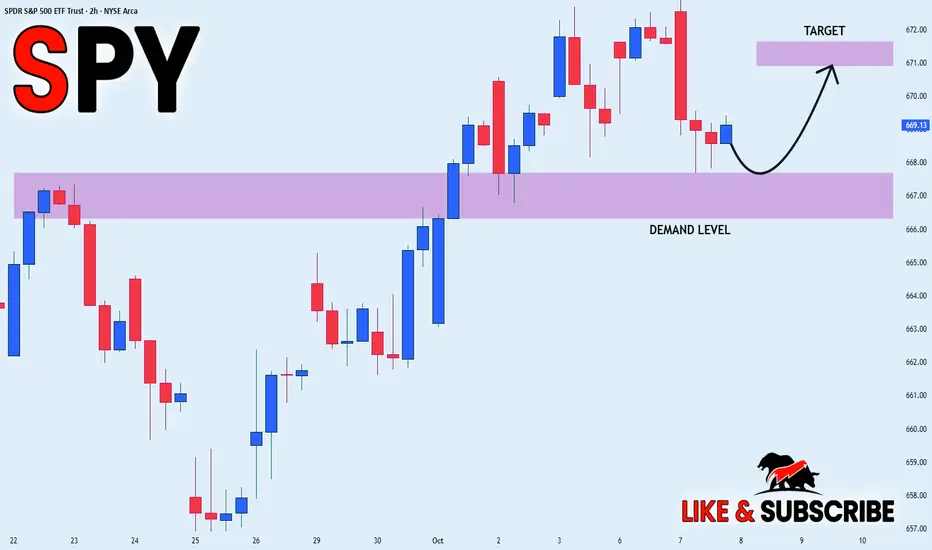
SPY STRONG UPTREND|LONG|
✅SPY showing a strong bullish structure with clear rejections from the demand level. Price continues to form higher lows, confirming institutional support and momentum toward the 671$ target zone. Time Frame 2H.
LONG🚀
✅Like and subscribe to never miss a new idea!✅
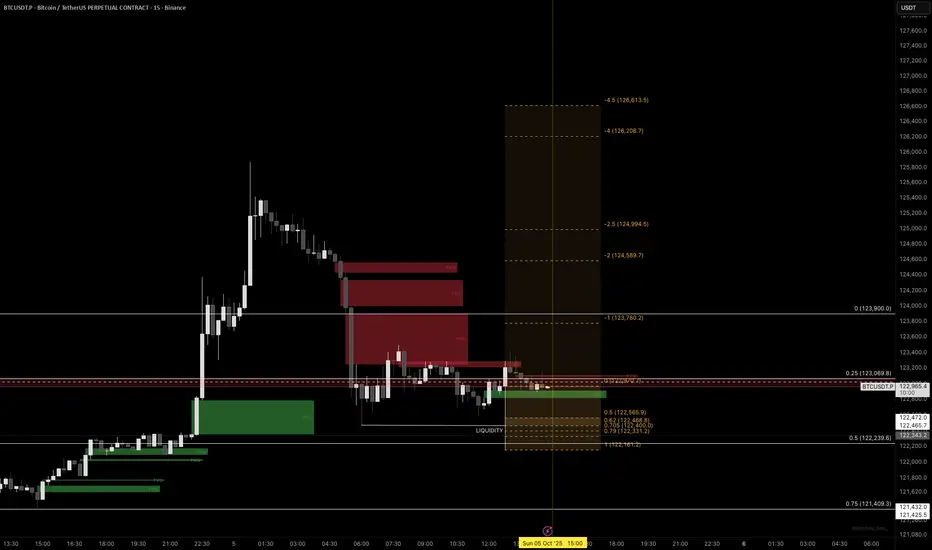
BTC Upside target move possible for monday closeLook for a buy position in BTCUSD from 0.5 level or 122565 level after 3 PM EST New York time
TP-1 123,780
TP-2 124,589
TP-3 126 208
THIS IS NOT A TRADE ADVISE. JUST FOR LEARNING PURPOSES
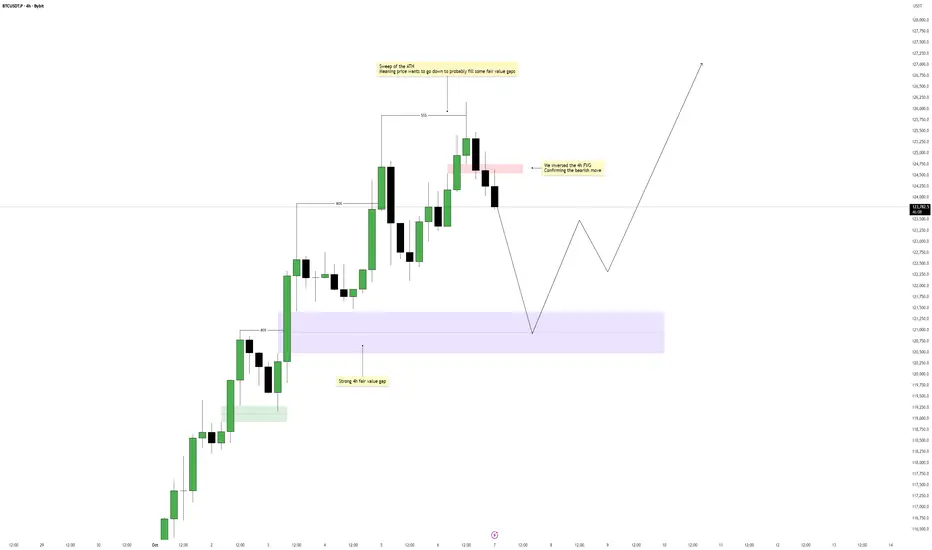
Bitcoin – Short-Term Weakness, Long-Term StrengthBitcoin has recently swept the all-time high, triggering a short-term reaction from liquidity resting above that level. This move often signals that the market has completed its buy-side run and is now seeking to rebalance inefficiencies created during the aggressive push upward. The current structure indicates that price is shifting momentum in the short term, preparing for a deeper retracement before resuming its bullish trajectory.
Imbalance and Structure Shift
Following the liquidity sweep, a clear 4-hour imbalance (IFVG) has formed, acting as the first sign of bearish pressure entering the market. This inefficiency shows that the prior move lacked sufficient counter-orders, meaning price may need to return there to restore balance. The bearish move was further confirmed as price inverted a smaller 4-hour FVG, signaling a potential continuation to the downside in the short term.
Bearish Scenario
If the market continues to respect the newly formed IFVG, we could see a sustained bearish retracement develop. Price may use this imbalance as a draw, seeking to fill deeper inefficiencies left behind during the prior expansion. This corrective phase is not necessarily a trend reversal but rather a short-term redistribution phase before buyers potentially step back in from lower levels.
Bullish Scenario
Once the 4-hour fair value gap below is filled, the market could begin forming a base for a new bullish leg. The liquidity collected from the downside move and the rebalancing of inefficiencies would give price enough fuel for a strong continuation higher. Traders should look for a clean market structure shift or displacement from that demand area as the signal of renewed bullish intent.
Expectations and Outlook
In summary, Bitcoin appears to be in a healthy retracement phase after sweeping liquidity at the highs. The 4-hour imbalance provides a clear short-term target for price to seek, and once filled, the bullish structure could resume. This setup favors patience, waiting for confirmation that the downside rebalancing is complete before anticipating another impulsive rally.
Conclusion
Overall, Bitcoin’s structure suggests a temporary bearish move to fill the 4-hour FVG, followed by a potential bullish continuation once that inefficiency is resolved. Watching how price reacts upon entering that zone will be key in determining whether the next expansion phase begins.
___________________________________
Thanks for your support!
If you found this idea helpful or learned something new, drop a like 👍 and leave a comment, I’d love to hear your thoughts! 🚀
MNQ1! Shorts to RTH Range for Monday 10-6-25This is my idea for Monday Oct 6 2025 that MNQ1! can be a bearish day looking for levels 24,980.

Potential GOLD Correction Phase IncomingGold FOREXCOM:XAUUSD has been making new record highs almost every day for the past 30 days.
It could come to a halt this week before maybe continuing higher...
WHY? you may ask,
Reason 1:
When Price fails to follow through on Expansions, there is a weakning i momentum and that usually signals corrections/full on reversals, however in this case, we cannot expect a full on reversal seeing as gold is constantly in demand due to the sever decline in investor confidence in basically, every currency out there right now.
In the terms of a correction however, there are inefficiencies on the 4H chart that price can seek to reprice to and then continue higher.
Case in point here:
Reason 2: The short term bearish bias is also backed by a mean reversion wirth silver forming intraday during tuesday's regular trading hours
There are much more things I could talk about, but for now, I want to keep it as clear as possible,
The bias ia Bullish Long term, small correction to the downside and another expansion higher after the H4 gap has been filled.
Follow for more.

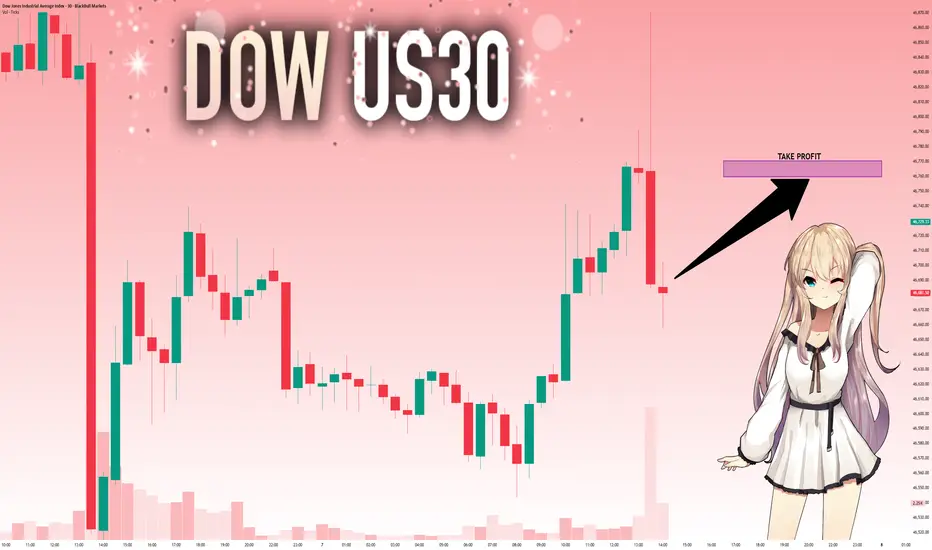
US30: Next Move Is Up! Long!
My dear friends,
Today we will analyse US30 together☺️
The recent price action suggests a shift in mid-term momentum. A break above the current local range around 46,689.60 will confirm the new direction upwards with the target being the next key level of 46,759.66 and a reconvened placement of a stop-loss beyond the range.
❤️Sending you lots of Love and Hugs❤️
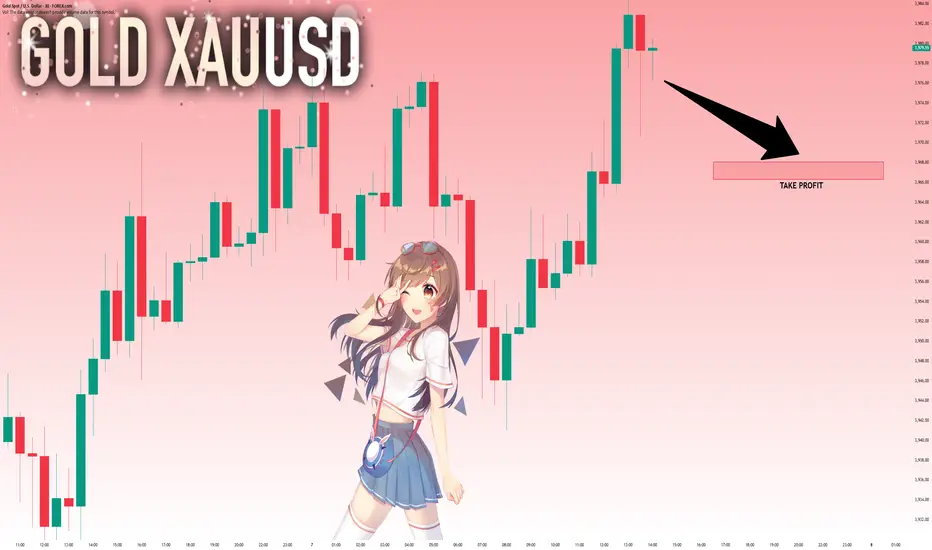
GOLD: Target Is Down! Short!
My dear friends,
Today we will analyse GOLD together☺️
The in-trend continuation seems likely as the current long-term trend appears to be strong, and price is holding below a key level of 3,976.35 So a bearish continuation seems plausible, targeting the next low. We should enter on confirmation, and place a stop-loss beyond the recent swing level.
❤️Sending you lots of Love and Hugs❤️
EURUSD: Absolute Price Collapse Ahead! Short!
My dear friends,
Today we will analyse EURUSD together☺️
The market is at an inflection zone and price has now reached an area around 1.16614 where previous reversals or breakouts have occurred.And a price reaction that we are seeing on multiple timeframes here could signal the next move down so we can enter on confirmation, and target the next key level of 1.16445.Stop-loss is recommended beyond the inflection zone.
❤️Sending you lots of Love and Hugs❤️

SILVER: Will Go Up! Long!
My dear friends,
Today we will analyse SILVER together☺️
The price is near a wide key level
and the pair is approaching a significant decision level of 48.448 Therefore, a strong bullish reaction here could determine the next move up.We will watch for a confirmation candle, and then target the next key level of 48.655.Recommend Stop-loss is beyond the current level.
❤️Sending you lots of Love and Hugs❤️
