EURUSD Pullback Before Bullish ExpansionQuick Summary
EURUSD is still showing strong bullish momentum, but a short term correction toward 1.15903 is likely before price continues higher to break the previous high. The presence of liquidity and an order block at the retracement zone increases the probability of a sweep before a new bullish push begins.
Full Analysis
The EURUSD continues to maintain its upward structure, and the current price action suggests that a temporary pullback may occur before the next bullish expansion. The level around 1.15903 stands out as a logical correction point
This retracement zone is significant because it contains both resting liquidity and a strong order block. These factors often attract price, as the market tends to sweep liquidity before continuing its primary direction. A sweep in this zone would remove weak hands, fill inefficiencies, and position the pair for a stronger continuation move.
Once liquidity below 1.15903 is taken, the expectation is for EURUSD to resume its bullish trajectory and aim for a break above the previous high. Waiting for a reaction or confirmation at the level can provide a higher quality entry, but the overall bias remains bullish as long as the structure stays intact.
Ict

Gold is still showing us it's bearish intent on the macroEasy peasy reading on the week so far. Let me know if I missed anything. I'm here for the sharing of info 💎

EURUSD SMC ICT ANALYSISMarket mostly move from external range liquidity to internal range liquidity.
now in eurusd , market has already taken buy side trendline liquidity & form strong bearish reaction which mean we can expect selling move.
4hr bullish ob is unmitigate , which increase the chance of selling.
Currently smc market structure is bearish , which signal selling looks valid.

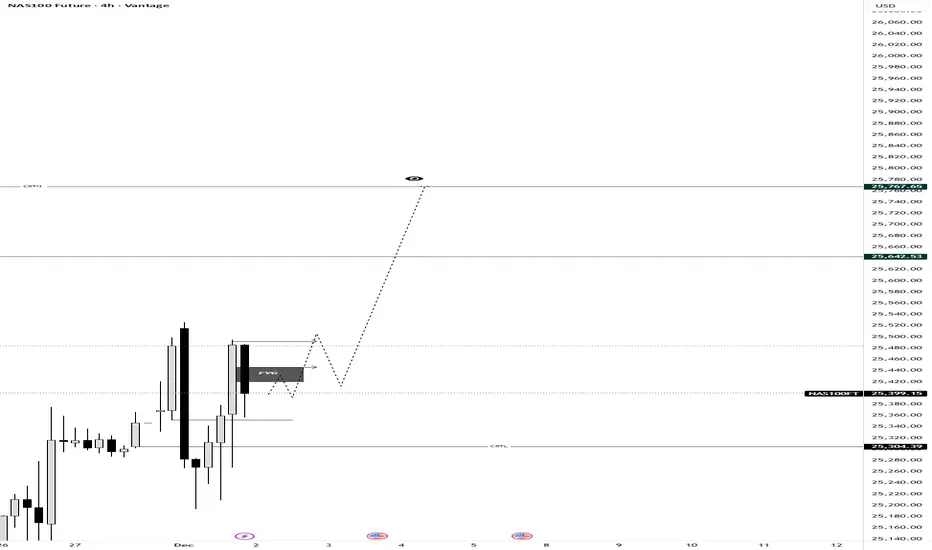
NAS100 Decoded: The Anatomy of a CRT SetupMost traders see random candles; we see a structured story. On this 4H NAS100 chart, we are witnessing a textbook example of Candle Range Theory (CRT) in motion.
If you understand the "Three-Phase Engine" inside every candle, the next move becomes clear.
The 3-Step Logic Behind This Setup:
The Purge (Accumulation): Notice how price dipped to sweep the CRTL (Candle Range Theory Low). This wasn't a random breakdown; it was a Purge Phase designed to grab liquidity and trap retail shorts. By sweeping the low (PL), the market collects the necessary fuel for the reversal.
The Mitigation (The Current Trap): Price has reclaimed the range and is currently mitigating within the FVG (Fair Value Gap). In CRT, this is the Mitigation Phase, where price returns to balance or "Equilibrium" (EQ) to fill imbalances before the real move begins. This phase often confuses traders, but it is simply smart money rebalancing positions.
The Expansion (The Delivery): With the internal liquidity harvested and the imbalance filled, the logic dictates a move toward the CRTH (Candle Range Theory High). This is our Expansion Phase, targeting the "Expansion Level" (EL). The "eye" icon on the chart represents the Draw on Liquidity (DOL)—the magnetic attraction pulling price toward the liquidity pools resting above the highs.
💡 The Lesson: Don't chase the red candles during the purge. Wait for the mitigation. As the theory states:
"The Purge phase creates the opportunity, the Mitigation phase provides the entry, and the Expansion phase delivers the profit".
Are you watching this FVG hold, or are you waiting for a break of structure confirmation? Let me know in the comments! 👇
Greetings,
MrYounity
EURJPY FREE SIGNAL|SHORT|
✅EURJPY is tapping into a fresh mitigation block after sweeping local buy-side liquidity, aligning with the higher-timeframe displacement. A corrective pullback is expected before delivering the next move into the downside objective.
—————————
Entry: 180.506
Stop Loss: 180.650
Take Profit: 180.350
Time Frame: 30M
Risk Level: High
—————————
SHORT🔥
✅Like and subscribe to never miss a new idea!✅

CHFJPY REBOUND AHEAD|LONG|
✅CHFJPY price is drawing back toward the demand leg, setting up a clean retest after a shallow liquidity grab beneath the wick lows. If the rejection confirms, price should expand toward the target premium zone above. Time Frame 2H.
LONG🚀
✅Like and subscribe to never miss a new idea!✅

GBPUSD DEMAND LEVEL AHEAD|LONG|
✅GBPUSD is poised to retest the demand zone after sweeping nearby liquidity, signaling a potential draw back into the imbalance before targeting higher pricing. Time Frame 2H.
LONG🚀
✅Like and subscribe to never miss a new idea!✅

EURUSD Retracement Before Bullish ContinuationQuick Summary
Although the overall outlook remains bullish, the EURUSD may go down first to collect liquidity below the Tokyo Low. This zone aligns with equal lows and a clean order block after, making 1.15855 a strong area for a continuation buy if a clear rejection or choch forms.
Full Analysis
The bullish structure on the EURUSD is still intact, but before continuing upward, the pair may need to sweep the liquidity sitting beneath the Tokyo Low, The area below the Tokyo Low also aligns with equal lows, which naturally attract liquidity and making this zone even more likely to be tested
The level around 1.15855 stands out as a probable point for bullish continuation once liquidity has been taken. However, entering directly at the level is not ideal. It is safer and more effective to wait for a clear sign of reaction such as a strong rejection or a confirmed choch on a lower timeframe. These signals help validate that the market is ready to shift from sweep to expansion upward.

EURJPY PULLBACK AHEAD|SHORT|
✅EURJPY Price is rejecting the supply zone after a sweep of highs, with a mitigation of the last bearish displacement candle pointing to bearish order flow targeting the next liquidity pocket below. Time Frame: 2H
SHORT🔥
✅Like and subscribe to never miss a new idea!✅

AUDUSD STRONG BREAKOUT|LONG|
✅ AUDUSD is breaking structure as it trades out of the demand block, signalling a continuation toward the upside liquidity pocket. With momentum shifting, the pair aims to draw toward the next clean inefficiency above before reaction. Time Frame 4H.
LONG🚀
✅Like and subscribe to never miss a new idea!✅

GOLD FREE SIGNAL|SHORT|
✅XAUUSD strong sweep into the supply zone triggered a premium-priced rejection, aligning with the ICT narrative shift for a short-term distribution leg targeting inefficiency below.
—————————
Entry: 4,215$
Stop Loss: 4,240$
Take Profit: 4,185$
Time Frame: 4H
—————————
SHORT🔥
✅Like and subscribe to never miss a new idea!✅

AUD-JPY Free Signal! Sell!
Hello,Traders!
AUDJPY tapped into a high-timeframe supply block and printed rejection wicks, signalling distribution after a premium sweep. With liquidity taken above the range, the setup aligns for a displacement down into the next draw-on-liquidity.
Sell!
Comment and subscribe to help us grow!
Check out other forecasts below too!
Disclosure: I am part of Trade Nation's Influencer program and receive a monthly fee for using their TradingView charts in my analysis.

Breakout or shakeout? Gold’s about to show who’s boss.🟡 Hello Goldies,
New month, new battleground.
Gold sits once again at a decisive shelf — cooling off just beneath the premium boundary after an explosive vertical rally. From here, we either ignite the next leg higher… or finally deliver that overdue correction.
This week isn’t about predicting.
It’s about reacting with precision.
🌍 Macro Outlook
A heavy USD data line-up ahead — ISM, Powell, ADP & NFP.
• Strong prints = dollar strength and potential pressure on Gold
• Soft data = fuel for another push toward 4350–4400
Bond yields are steady for now, giving the market a calm breath before the storm later in the week.
📍 Overall Narrative
Gold remains bullish but stretched, trading near 4210 just below the premium ceiling. Structure is still ascending across Weekly, Daily, and H4, but momentum is fading, compression is visible in candles, and RSI divergence signals caution near the highs.
This is a decision-point market, not a breakout-chase environment.
The battlefield is clearly defined:
4210–4260 = breakout trigger zone
4160–4180 = control / equilibrium
4050–3980 = major buyer defense
The market is waiting for US high-impact data (ISM, Powell, ADP, NFP) to unlock direction.
🧭 Weekly Structure Insights
Gold trades just under a premium rejection zone where sellers defended previously.
Trend Condition
Bullish structure still intact (HH/HL)
Candles compressing → loss of drive
Bullish momentum fragile at top
Key Weekly Levels
Premium Resistance
Zone
4260–4350 prior rejection zone + imbalance + liquidity
4480–4560 extended premium cluster
4740–4860 price discovery extension
Discount Supports
Zone
4050–3980 main buyer wall + EMA21
3840–3720 first deep correction magnet
3520–3380 macro accumulation base
Weekly Decision Logic
Close > 4210 → continuation toward 4350–4480
Rejection at 4210–4260 → retrace to 4050–3980
Daily Structure Summary
Still bullish but stretched. Price coiling under premium.
Daily Zones
Supply
4260–4350 → unfilled FVG + rejection wick
4460–4570 → expansion block
4700–4820 → overextension
Demand
4080–4000 → EMA50 + breakout base
3870–3720 → deep discount
3470–3350 → long-term accumulation
Daily Trigger Range
4160–4210 = control zone
H4 Bias Overview
Bullish-to-neutral. Weak high formation, likely liquidity sweep before any true move.
H4 Supply
4235–4265 → short-term reaction shelf
4290–4320 → imbalance + mitigation zone
4355–4385 → thin liquidity
4420–4455 → exhaustion cap
H4 Demand
4145–4110 → retest support
4075–4040 → CHoCH base
3985–3950 → institutional OB
3890–3855 → deeper defensive layer
🎯 Trading Scenarios
🟢 Bullish Play
Requirements:
Hold above 4180 → reclaim 4210
Daily close above 4260 for momentum confirmation
Targets:
→ 4260 → 4320 → 4350 → 4450
🔴 Bearish Play
Triggers:
Rejection at 4210–4260
Break below 4180 or BOS below 4140
Targets:
→ 4110 → 4040 → 3980 → 3870
🧠 Final Summary
Gold is bullish but topping. Momentum fading at premium levels while support remains firm at 4050–3980. The 4160–4210 decision zone controls the week — breakout = 4350+, rejection = correction into discount. Macro catalysts will choose the direction.
This week belongs to reaction, not prediction.
Stay patient — let price speak before positioning.

EURUSD Bullish Setup After Corrective Drop Toward 1.15364Quick Summary
EURUSD may retrace lower toward 1.15364 on the H4 chart. This zone is expected to act as a potential demand area and could offer a buying opportunity, but only if the price shows a clear rejection signal or the price left a liquidity void behind that supports a bullish reaction
Full Analysis
On the H4 timeframe, EURUSD appears to be setting up for a corrective move to the downside before potentially resuming its upward structure. The level around 1.15364 stands out as an important zone where buyers may step back in, as it aligns with previous demand
However, the entry from this area isn’t confirmed yet
If price reaches the zone gradually and forms a strong rejection candle or any clear reaction that shows buyers absorbing liquidity, this could offer a clean long setup
On the other hand, if the market drops sharply into the level... and left a liquidity void behind that type of move can often produce a stronger bullish bounce, making it a valid buying point as well, provided there is a visible reaction

EURUSD Bullish Continuation Toward Key Sell ZoneQuick Summary
EURUSD is showing strong bullish momentum and is expected to continue rising toward 1.15715, where a potential sell setup may form pending a clear rejection trigger.
A secondary confirmation for selling comes from GBPUSD, which must break the 1.31559.
Full Analysis
Continuing the broader outlook on EURUSD, the recent upward movement is developing in a healthy and structurally consistent manner. The bullish progression indicates strong buy program, and as long as price maintains its higher-low structure, the market remains poised to reach the next significant level at 1.15715.
This area represents a notable reaction point where sellers may step in, making it a potential short opportunity. However, the sell setup should only be taken with a clear trigger, such as a sharp wick rejection, or a shift in short-term market structure. Without confirmation, price may simply sweep liquidity and continue higher.
An additional layer of confluence comes from GBPUSD.
If GBPUSD breaks 1.31559, this would signal of weakness.this will create a much stronger environment for EURUSD to form a valid sell reaction from 1.15715.

EURUSD Approaching a Key Demand Zone After Structural BreakAfter the EURUSD broke an important structure on the H1 timeframe, the recent downward movement appears to be driven by a clear intention to capture the liquidity resting below the previous swing low of the bearish structure. This type of price behavior is typical when the market seeks to collect orders before deciding its next larger directional move.
Despite this short-term weakness, the pair is still respecting the overall bullish structure on the Daily timeframe, which means the downward pressure we are seeing may simply be a deeper corrective phase within the broader uptrend.
At the moment , a potential reaction could occur around the 1.14943 level. However, from my perspective, any bounce from this zone is expected to be relatively weak, as the price still seems drawn toward the deeper liquidity pool sitting near 1.14693, which represents an important daily low as well as an area where many traders are likely positioned.
If the market continues pushing lower into this Zone, I will be closely reassessing the pair from the Daily timeframe to determine whether the bullish structure will continue to hold and provide a new long opportunity, or whether the pair is preparing for a more meaningful structural shift to the downside.
Overall, this area will be crucial for understanding the next major move, especially considering how price has been aggressively clearing liquidity pockets during the recent decline.

GOLD for the weekGold has an overall bullish trend but I'll be looking for price to take out the sellside liquidity first before bullish continuation. before the bullish run, i'll expect prce to take out the buyside liquidity where i'll obviously be looking for shorts to the sellside liquidty. From this point I'll be looking to ride the overall bullish bias. #TradeWithCaution and always learn to break even to avoid much losses.

AUDJPY FREE SIGNAL|SHORT|
✅AUDJPY price swept the upper supply wick and tapped into a premium zone, triggering a clean bearish displacement. A corrective pullback into the breaker block is expected before continuation lower.
———————————
Entry: 102.29
Stop Loss: 102.49
Take Profit: 102.01
Time Frame: 2H
———————————
SHORT🔥
✅Like and subscribe to never miss a new idea!✅

EURNZD BEARISH BREAKOUT|SHORT|
✅EURNZD has broken down from the supply level and is now trading in a discount leg, with liquidity resting below recent equal lows. As long as order flow stays bearish, the draw remains toward the target zone. Time Frame 7H.
SHORT🔥
✅Like and subscribe to never miss a new idea!✅

USDJPY BULLISH BIAS|LONG|
✅USDJPY is respecting the rising trendline as discount arrays continue to hold, suggesting a bullish continuation toward the next liquidity pocket above. With structure still shifting upward, the draw remains at the target zone. Time Frame 7H.
LONG🚀
✅Like and subscribe to never miss a new idea!✅

EURUSD Tokyo Break Continuation ScenarioQuick Summary
EURUSD may extend its move after breaking the Tokyo session range and could drop toward 1.15336 which is a possible buy zone supported by an SMT signal between EURUSD and GBPUSD
Full Analysis
EURUSD has already broken the Tokyo session structure and this type of movement often indicates that the market intends to follow through toward a deeper level before showing any reversal behavior The next logical target for this continuation move is the zone around 1.15336 where the pair may find fresh demand and show a stronger bullish response
The current decline appears more like a liquidity seeking move rather than a shift in the overall direction and this idea is further supported by the SMT signal forming between EURUSD and GBPUSD When one pair makes a move that the other fails to confirm it often reflects an imbalance that the market attempts to correct through a short term retracement
Once EURUSD reaches 1.15336 we can monitor the reaction closely If the market shows a clear shift in short term structure or strong buying pressure this area can become a valid entry point for a bullish continuation scenario.

EURUSD LOCAL SHORT|
✅EURUSD reacted off the supply zone after a clear liquidity grab above the prior swing high, shifting order flow back bearish. With the draw on liquidity set below, the market is likely to seek the next inefficiency toward the target area. Time Frame 1H.
SHORT🔥
✅Like and subscribe to never miss a new idea!✅

GOLD IS OVERBOUGHT|SHORT|
✅XAUUSD After sweeping liquidity above the supply zone, price is about to retest the rejection point in a premium area. A draw on liquidity toward the next inefficiency is favored as the market seeks a balanced repricing leg. Time Frame: 3H.
SHORT🔥
✅Like and subscribe to never miss a new idea!✅
