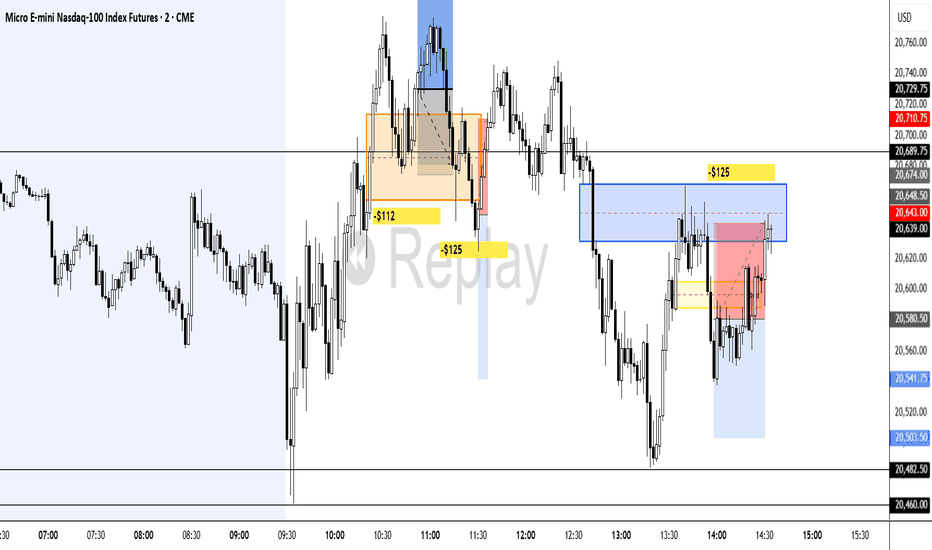
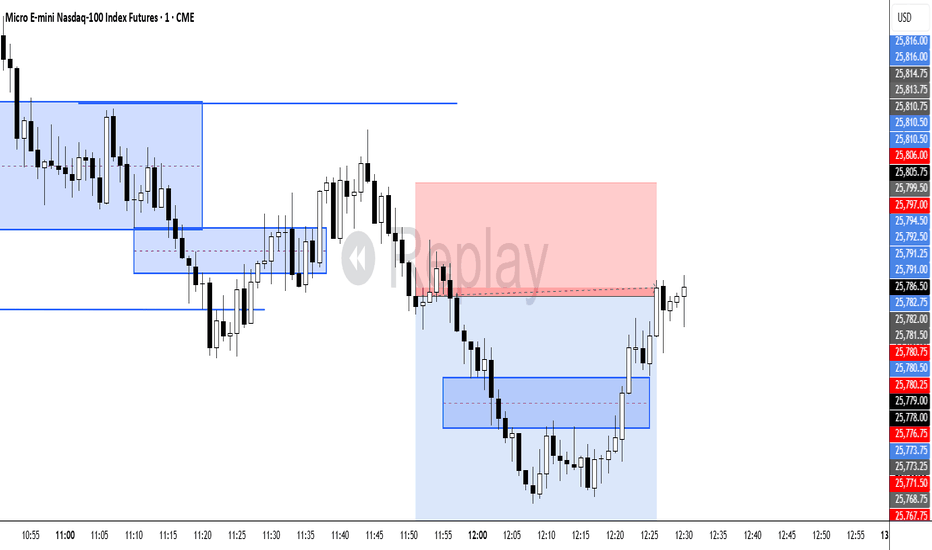
MNQ Daily Analysis - Friday February 28 2025let an awful two day stretch/a Friday turn a solidly profitable week into unprofitable.
0-3 / -$362
---------------
As a learning, beginner day trader I go through the market replay predefining what I am looking for to enter a trade and walk through my thoughts as I experience the market action bar by bar throughout the entire day to see how I handle various events and assess my execution.
This is for me and others to learn if you desire.
Ict
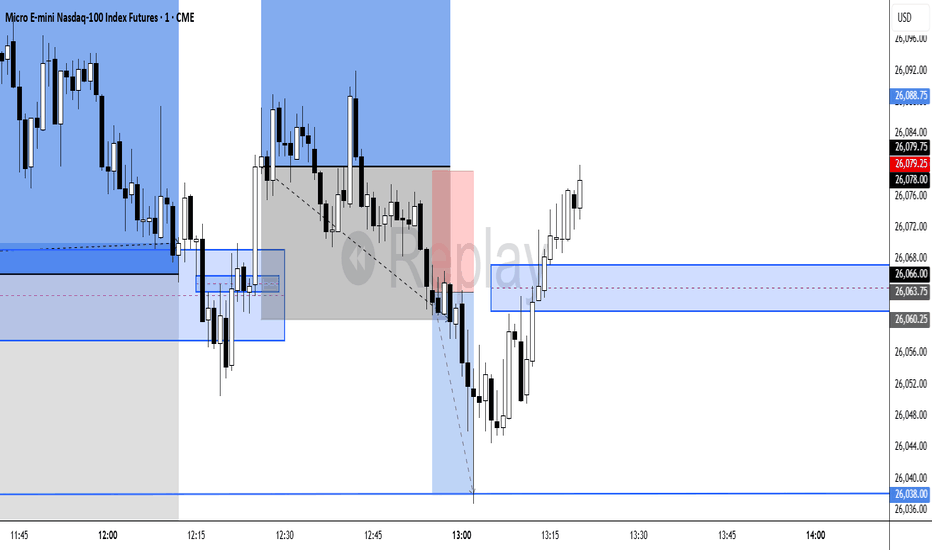
MNQ Daily Analysis - Thursday February 27 2025tunnel vision day with suspect decisions and trade management.
0-2 / -$207
--------------
As a learning, beginner day trader I go through the market replay predefining what I am looking for to enter a trade and walk through my thoughts as I experience the market action bar by bar throughout the entire day to see how I handle various events and assess my execution.
This is for me and others to learn if you desire.
EURUSD Monthly Orderblock ReactionQuick Summary
EURUSD has already started moving lower and This move is a normal reaction from the monthly orderblock, This bearish continuation remains valid
Price is targeting the bullish trendline liquidity on the hourly chart
Short term pullbacks are possible to allow continuation without leaving FVGs behind
Full Analysis
EURUSD has begun to decline which is a normal reaction after interacting with the monthly Fvg
This reaction supports the broader bearish view and confirms that higher timeframe supply is still active
On the hourly timeframe there is a clear bullish trendline liquidity resting below price
EURUSD is currently moving with the intention of breaking this trendline in order to continue the downside move
Before that break occurs price may perform small corrective pullbacks to the upside
These corrections are necessary to rebalance short term inefficiencies and avoid leaving unfilled FVGs behind
As long as price remains below the monthly reaction zone and continues to respect bearish orderflow
Any upside movement should be treated as corrective
The main expectation remains a clean break of the bullish trendline followed by continuation to the downside
MNQ Daily Analysis - Wednesday February 25 2025solid. 1-1-1 / +$97
------------
As a learning, beginner day trader I go through the market replay predefining what I am looking for to enter a trade and walk through my thoughts as I experience the market action bar by bar throughout the entire day to see how I handle various events and assess my execution.
This is for me and others to learn if you desire.
MNQ Daily Analysis - Tuesday February 25 2025 part 2good day that was close to being great.
2-1-2 / +$326
All 1 MNQ trades.
------------
As a learning, beginner day trader I go through the market replay predefining what I am looking for to enter a trade and walk through my thoughts as I experience the market action bar by bar throughout the entire day to see how I handle various events and assess my execution.
This is for me and others to learn if you desire.
MNQ Daily Analysis - Monday February 24 2025tried to stay patient, but wasnt perfect.
1-1 / +$69.
All 1 MNQ trades.
------------
As a learning, beginner day trader I go through the market replay predefining what I am looking for to enter a trade and walk through my thoughts as I experience the market action bar by bar throughout the entire day to see how I handle various events and assess my execution.
This is for me and others to learn if you desire.
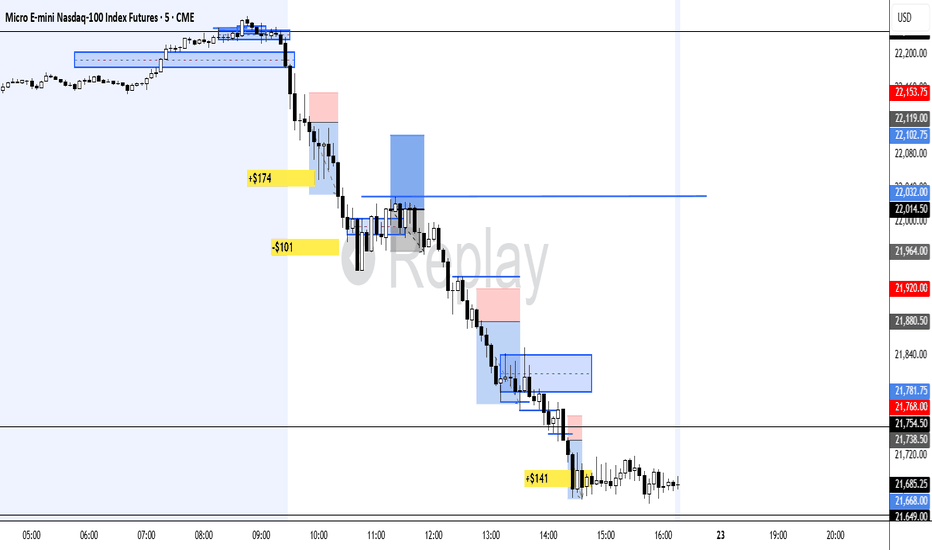
MNQ Daily Analysis - Friday February 21 2025 part 22-1 day / +$214.
All 1 MNQ trades.
smooth bearish continuation trend day.
------------
As a learning, beginner day trader I go through the market replay predefining what I am looking for to enter a trade and walk through my thoughts as I experience the market action bar by bar throughout the entire day to see how I handle various events and assess my execution.
This is for me and others to learn if you desire.
MNQ Daily Analysis - Friday February 21 2025 part 1Lets dive into the bear market of early 2025.
------------
As a learning, beginner day trader I go through the market replay predefining what I am looking for to enter a trade and walk through my thoughts as I experience the market action bar by bar throughout the entire day to see how I handle various events and assess my execution.
This is for me and others to learn if you desire.
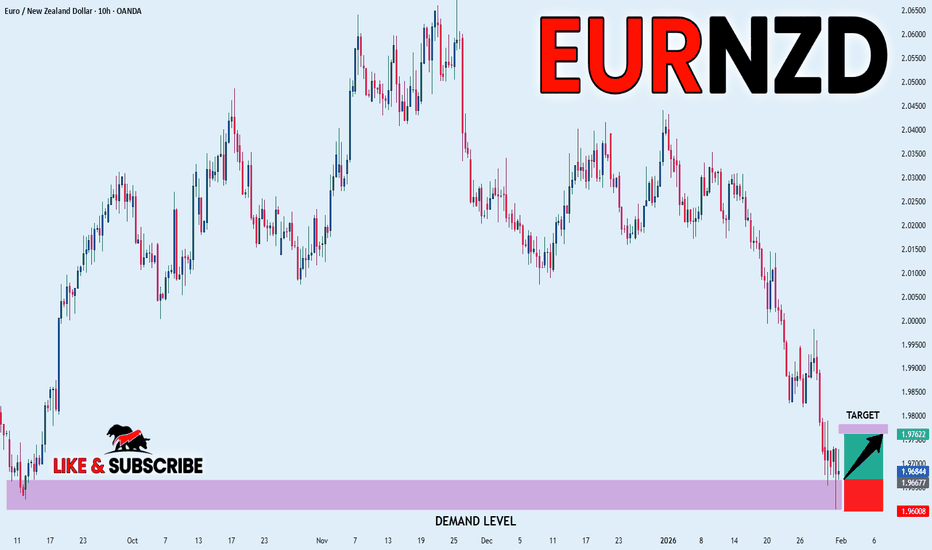
EURNZD FREE SIGNAL|LONG|
✅EURNZD strong displacement into HTF demand with sell-side liquidity swept. Bullish reaction suggests mitigation complete, expecting continuation toward nearby imbalance highs.
—————————
Entry: 1.9667
Stop Loss: 1.9600
Take Profit: 1.9762
Time Frame: 10H
—————————
LONG🚀
✅Like and subscribe to never miss a new idea!✅
EUR/USD: The Ultimate "Deep Discount" Trap?Is the Euro's bull run finally exhausted, or are we just witnessing a massive liquidity hunt? The 100 EMA and a massive Fair Value Gap are about to collide, creating a "Do or Die" zone for traders. If you missed the 1.2000 rally, this retracement might be your last chance to catch the next big wave—or get trapped in a freefall.
The Technical Narrative
The recent rejection from the 1.2050 highs wasn't just a pullback; it was a structural shift. We are currently tracking a Market Structure Shift (MSS) on the 4H timeframe. Price is gravitating toward the 1.1740 - 1.1770 Imbalance (FVG), which perfectly aligns with the 100 EMA.
The Setup: We expect a brief "dead cat bounce" into the 1.1890 supply zone (upper pink box) to trap early buyers before the final flush down to the demand zone.
The Kill Zone: Look for price exhaustion around 1.1750. This is the high-confluence area where institutional "Smart Money" is likely to reload.
🚨 Red Alert: The "Volatility Week"
This isn't a normal trading week. We are facing a "Perfect Storm" of macro data that could invalidate any technical setup in seconds:
ECB Rate Decision (Thursday): Any dovish hint from Lagarde will send the Euro straight into our FVG target.
NFP Friday: The ultimate USD mover. A strong labor report will be the catalyst for the final liquidity sweep.
Trading Advice: Don't be a hero during the news release. Let the market hunt the liquidity first, then join the trend once the dust settles at the 1.1750 support.
DXY Weekly planThe month closed with the formation of a bearish OB. On the weekly timeframe, bearish 1W FVG/OB zones have formed. The plan for the week is a corrective move to the upside into the premium of the daily range, followed by continuation of the bearish 1D OF. A potential mid-term target is the next 1M FP at $94.6.
Gold - “Let price choose. We just execute.”🟡 Hello Goldies —
Hope the week’s started smoothly.
Let’s zoom out and see where gold actually stands on the weekly map.
Gold remains firmly in a strong weekly uptrend, trading in full price-discovery mode. Structure is clean, momentum is in control, and despite being extended, the weekly chart shows no evidence of a structural top — just sustained strength.
The sweep has already happened.
Now gold isn’t choosing direction… it’s deciding how much it wants to pull back before continuing higher.
🧭 BIG PICTURE TAKEAWAY
Weekly trend: Bullish and intact (no CHoCH).
Current phase: Correction / digestion after a liquidity sweep.
Key question: Not direction — depth of pullback.
Weekly structure holds above: 4,650–4,850.
Daily control zone: 4,850–4,950.
H4: Neutral and deciding inside balance.
H1: Bearish until structure is reclaimed.
➡️ Patience is required. Best trades come from reactions at key zones, not from prediction..
🟡 WEEKLY – TREND STILL KING
Higher highs / higher lows intact
No weekly CHoCH → pullbacks = pauses, not reversals
Key Weekly Logic
Above 4,650–4,850: bullish structure survives
Below that: correction deepens, narrative changes
Upside Map (only if momentum rebuilds)
5,300–5,600 → volatile continuation
5,900–6,050 → reaction / slowing zone
6,300–6,500 → blow-off (not base case)
👉 Weekly says: “I’m bullish — but don’t chase me.”
🔵 DAILY – CONTROLLED DAMAGE
Daily is doing what healthy trends do after a sweep: resetting.
Daily Decision Zone
4,850–4,950
Hold = shallow correction
Acceptance below = deeper pullback unlocked
Daily Flow
Supply above: 5,100–5,250 / 5,500–5,600
Support below:
4,450–4,600 (first real rebuild zone)
4,200–4,350 (major accumulation)
3,900–4,050 (aggressive correction)
👉 Daily says: “I’m allowed to bleed without breaking.”
🟠 H4 – THE BATTLEFIELD
H4 trend broke momentum, not structure.
H4 Balance Zone (Most Important)
4,920–4,880
Above → stabilization & rotation higher
Below → continuation of correction
H4 Levels That Matter
Resistance: 5,000–5,040 → corrective only unless reclaimed
Support:
4,680–4,640 (reaction base)
4,560–4,520 (trend foundation)
4,360–4,320 (last H4 defense)
👉 H4 says: “Decide first. Trend later.”
🔴 H1 – FLOW IS STILL BEARISH
This is where most traders get trapped.
Why H1 Is Bearish
Clean CHoCH + BOS from 5530 → 4945
EMA stack bearish
RSI still under pressure
Every bounce capped by supply
H1 Decision Zone
4,920–4,890
Above = retracement opportunity
Below = continuation sells
If Bulls Want Control
They MUST:
Break & hold above 4935
Print BOS
Defend a pullback
Targets if that happens:
5,010–5,040
5,110–5,140
5,210–5,240
If Bears Stay in Control
Expect continuation into:
4,810–4,780
4,705–4,675
4,570–4,540
👉 H1 says: “Structure first. Hope later.”
🎯 FINAL SYNTHESIS (THE TRUTH)
Weekly trend is not broken
Daily correction is healthy
H4 is deciding
H1 is still bearish
This is a market that rewards patience and punishes anticipation.
The trade is not direction. The trade is reaction at the flip zones.
Levels > opinions.
Acceptance > predictions.
ETH Breaks Support, Bearish Continuation
This is a 1-hour ETH/USD chart with Ichimoku Cloud. Price first moved sideways in a defined range, then rallied into a clear resistance zone near the top. After rejection, ETH broke down below key support and the Ichimoku cloud, confirming a bearish shift. Price is now trending lower with weak momentum, and the chart projects a downside target around 2,550, suggesting continuation of the bearish move unless price reclaims the broken level.
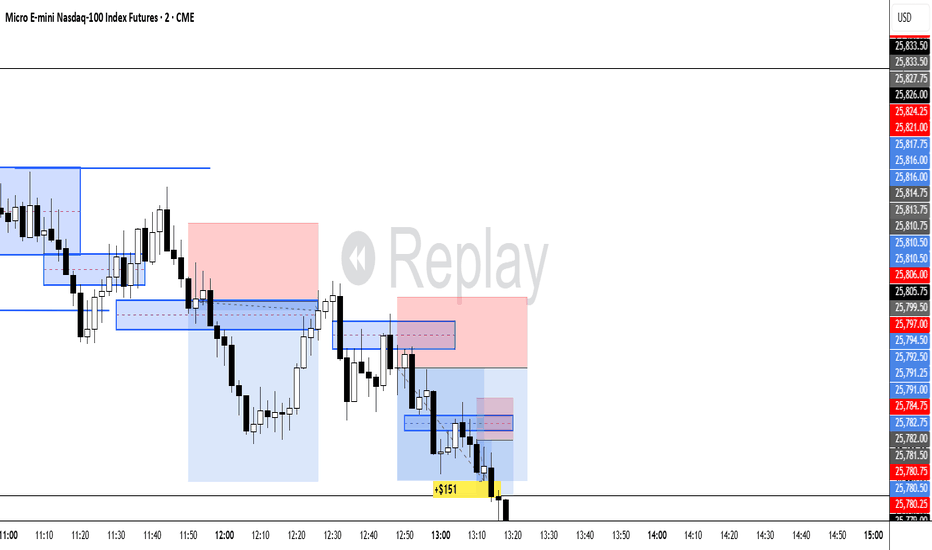
MNQ Daily Analysis - Friday January 30 part 21-0-1 day / +$151
funky ass price action. made lemonade.
-------------
As a learning, beginner day trader I go through the market replay predefining what I am looking for to enter a trade and walk through my thoughts as I experience the market action bar by bar throughout the entire day to see how I handle various events and assess my execution.
This is for me and others to learn if you desire.
MNQ Daily Analysis - Thurs January 29 part 3/Fri Jan 30 part 1Massive Thursday. 5-0 / +$1200.
All one MNQ trades.
--------------
As a learning, beginner day trader I go through the market replay predefining what I am looking for to enter a trade and walk through my thoughts as I experience the market action bar by bar throughout the entire day to see how I handle various events and assess my execution.
This is for me and others to learn if you desire.
MNQ Daily Analysis - Thursday January 29 part 2As a learning, beginner day trader I go through the market replay predefining what I am looking for to enter a trade and walk through my thoughts as I experience the market action bar by bar throughout the entire day to see how I handle various events and assess my execution.
This is for me and others to learn if you desire.
MNQ Daily Analysis - Thursday January 29 part 1As a learning, beginner day trader I go through the market replay predefining what I am looking for to enter a trade and walk through my thoughts as I experience the market action bar by bar throughout the entire day to see how I handle various events and assess my execution.
This is for me and others to learn if you desire.
MNQ Daily Analysis - Wednesday January 280-2 / -$337
---------
As a learning, beginner day trader I go through the market replay predefining what I am looking for to enter a trade and walk through my thoughts as I experience the market action bar by bar throughout the entire day to see how I handle various events and assess my execution.
This is for me and others to learn if you desire.
MNQ Daily Analysis - Tuesday January 27 part 22-1 day / +$102
small positions today, none risked more than $130.
--------
As a learning, beginner day trader I go through the market replay predefining what I am looking for to enter a trade and walk through my thoughts as I experience the market action bar by bar throughout the entire day to see how I handle various events and assess my execution.
This is for me and others to learn if you desire.
MNQ Daily Analysis - Monday January 26 part 2/Tue Jan 27 part 10-0-1 $0 on Monday. Tuesday started in this same video.
------------
As a learning, beginner day trader I go through the market replay predefining what I am looking for to enter a trade and walk through my thoughts as I experience the market action bar by bar throughout the entire day to see how I handle various events and assess my execution.
This is for me and others to learn if you desire.
