XAUUSD (H1) – Bullish channel intact, short pullback...Market context
On January 7, spot gold and silver both saw short-term selling pressure.
Spot gold slipped toward 4450–4455 USD/oz after a recent rally.
Spot silver dropped below 79 USD, reflecting broader short-term profit-taking across precious metals.
This pullback looks technical and corrective, rather than a reversal of the broader bullish trend. The macro backdrop remains supportive: geopolitical risks, long-term central bank demand, and expectations of easier monetary policy continue to underpin precious metals.
Technical view – H1 (Lana’s perspective)
Price is still respecting a rising price channel, showing healthy trend structure despite the current retracement.
Key observations from the chart:
The ascending channel remains valid; higher highs and higher lows are intact.
Price has reacted from the upper half of the channel, triggering short-term selling into sell-side liquidity.
The dotted midline and channel support are acting as dynamic reaction zones.
The recent drop appears to be a liquidity sweep / correction, not a breakdown.
This kind of pullback is common after strong impulsive legs and often provides better positioning for trend continuation.
Key levels to watch
Sell-side reaction (short-term pressure)
Near the channel midline and upper resistance, price may remain choppy.
Expect volatility while sell-side liquidity is being absorbed.
Buy-side interest zones
4458 – 4463: First reaction zone inside the channel.
4428 – 4400: Stronger support aligned with channel base and prior structure.
Acceptance above these zones favors bullish continuation.
Fundamental angle
Short-term weakness in gold and silver is driven mainly by profit-taking after recent highs.
Broader fundamentals remain constructive:
Ongoing geopolitical uncertainty
Strong central bank demand
USD valuation and global risk sentiment
These factors suggest that dips are more likely to be corrective opportunities, not trend-ending signals.
Lana’s trading mindset 💛
Avoid chasing price during pullbacks.
Respect the channel structure and wait for price to come into value.
Look for clear confirmation at support zones before engaging.
As long as the channel holds, the bullish bias remains valid.
This analysis reflects a personal technical view for educational purposes only. Always manage risk carefully.
Ictconcepts

XAUUSD (H2) – Liam View: Buy the liquidity pullback, re-buy...XAUUSD (H2) – Liam View: Buy the liquidity pullback, re-buy at the 0.618 zone
1) Macro snapshot (Venezuela headlines = faster repricing)
Since Maduro was reportedly detained, Venezuela’s market has reacted aggressively — your note highlights the IBC index surging +74.71% in just two sessions and +156% over 30 days, showing a rapid “repricing” of political risk and expectations.
For gold, this kind of backdrop usually means bigger swings + liquidity sweeps: the market can flip between risk-on bursts and renewed safe-haven demand.
➡️ So the best play today is still level-based execution, not chasing candles.
2) Chart read (H2) – Uptrend intact, but it needs a clean pullback
From your H2 chart:
The broader structure is still bullish, but price is in a short-term pullback after the recent push up.
The key level is the 0.618 Buy Zone: 4414–4417 — a classic re-entry area (liquidity + fib confluence).
Above, we have Buyside Liquidity near the recent highs — that’s the magnet if buyers regain control.
3) Trade plan (clear Entry / SL / TP)
✅ Scenario A (priority): BUY the 0.618 pullback
Buy zone: 4414 – 4417
Stop loss (SL): below 4406 (or safer: below the most recent H2 swing low)
Take profit (TP):
TP1: 4460–4470 (recent rebound high area)
TP2: sweep Buyside Liquidity (above the highs)
TP3: if the breakout holds, continue towards the upper resistance band on your chart
Logic: In a bullish structure, the 0.618 pullback is often the cleanest “re-buy” entry — especially when headlines trigger sharp dips and fast rebounds.
✅ Scenario B: Shallow pullback → buy only with confirmation
If price doesn’t reach 4414–4417 and only dips lightly:
Wait for a lower-TF confirmation (M15/H1 shift / rejection)
Take a smaller continuation buy and aim for a quick 8–12$ move
⚠️ Scenario C (scalp only): SELL after a buyside sweep and rejection
If price runs the highs (buyside liquidity sweep) and then prints a strong rejection:
You can sell scalp back into 4460–4445
SL: above the sweep high
Not a long-term bearish call while the rising structure is still valid.
4) Key note (headline week)
Venezuela headlines can keep volatility elevated, so:
Avoid entering mid-candle
Use zones + confirmation
Reduce size if spreads widen
If I had to pick one clean trade today: wait for the 0.618 buy zone (4414–4417), then buy for a push into buyside liquidity.

XAUUSD H2 – Trading Around Key LiquidityVolume Profile Trading While DXY Stays Soft Ahead of US Data
Gold is moving in a classic liquidity-driven manner: price is reacting around VAL/POC, and the next expansion is likely to occur only after key liquidity zones are tested.
TECHNICAL CONTEXT FROM THE CHART
After a strong rebound, price is consolidating above the main Volume Profile value cluster.
Current structure favours a pullback into buy zones before the market decides whether to continue higher or distribute.
The chart clearly defines the battlefield: sell liquidity above and buy liquidity below.
PRIORITY SCENARIO – MAIN PLAN
Buy from value zones using Volume Profile
Buy VAL: 4420 – 4422
Value Low area where demand often absorbs sell pressure during a technical pullback.
Buy POC: 4442 – 4445
The Point of Control is the highest-volume zone and typically delivers strong reactions on retests.
Expected flow:
A controlled dip into VAL/POC → bullish defence and absorption → rotation back into balance and potential continuation higher.
ALTERNATIVE SCENARIO – SHORT-TERM SELL ONLY
Sell is preferred only as a scalp at premium liquidity
Sell Liquidity: 4525 – 4527
Upper liquidity zone where price may show rejection and trigger a short-term pullback.
Note:
This is a reaction-based scalp, not a long-term bearish reversal view.
STRONG LIQUIDITY LEVEL TO MONITOR
Strong liquidity: around 4396
If price breaks below VAL and extends lower, this is a key area where a sweep-and-reversal can occur. It also helps define whether the move is a deeper shakeout or a more structural breakdown.
FUNDAMENTAL BACKDROP SUPPORTING GOLD
The US Dollar Index (DXY) remains weak near 98.50 as traders stay risk-on and position ahead of major US releases.
Key releases to watch: US ADP Employment Change and ISM Services PMI, both capable of reshaping near-term Fed expectations.
The safe-haven USD has struggled as markets temporarily look past rising geopolitical tensions following US involvement in Venezuela, keeping gold supported.
SUMMARY VIEW
Focus on buys at 4442–4445 and 4420–4422 using Volume Profile
Consider sell scalps at 4525–4527 only on clear rejection
Expect volatility/spikes around ADP + ISM Services PMI, as liquidity sweeps are common before direction is confirmed

XAUUSD (H2) – Liam View: Geopolitical risks support gold.XAUUSD (H2) – Liam View: Geopolitical risk remains high, gold continues to be supported | Trade the pullback, target ATH liquidity
Quick summary
The latest White House messaging on Venezuela is very direct: officials are signaling Washington will push Caracas to “act in America’s interests,” with Rubio reportedly in contact, while Stephen Miller framed the situation bluntly as “the world runs on power.”
For markets, this kind of rhetoric keeps the geopolitical risk premium elevated — and gold typically benefits as a safe haven when uncertainty increases.
On the chart (H2), gold is holding a bullish recovery structure and is now pushing into a higher-value area. My plan is to stay patient, buy pullbacks into liquidity, and watch for a final push toward ATH liquidity.
1) Macro context (why gold remains bid)
When major powers use strong language around military campaigns and “power-first” policy, traders price in:
Higher headline risk (sudden escalations / sanctions / retaliation)
More demand for safe havens (gold)
Potential volatility in USD and yields, which can create fast spikes and liquidity sweeps
➡️ That’s why the best execution is still level-based: let the price come to liquidity zones and trade the reaction.
2) Technical view (H2 – based on your chart)
Price bounced strongly and is building a clear recovery leg.
The chart highlights a value area / volume node (pink profile) where price is currently accepting — this usually acts like a magnet and a base for continuation.
Upside roadmap on your chart points toward:
a pullback into the mid-zones
continuation into “strong Fibonacci” resistance
then a run into ATH liquidity above
3) Key levels to watch (from the chart)
✅ ATH zone (major liquidity / ceiling)
✅ Strong Fibonacci (upper resistance band)
✅ Mid support zones (stacked demand areas below current price — ideal for pullback buys)
(Your chart marks multiple horizontal demand bands — I’m using them as reaction zones rather than exact-to-the-dollar predictions.)
4) Trading scenarios (Liam style: trade the level)
Scenario A (priority): BUY the pullback (trend continuation)
✅ If price dips into the nearest demand band (below current consolidation):
Buy on reaction (M15–H1 confirmation)
SL: below the demand band
TP1: return to current highs
TP2: Strong Fibonacci zone
TP3: ATH liquidity sweep
Logic: In geopolitical-risk conditions, gold often continues higher but still does “healthy” pullbacks to collect liquidity before the next push.
Scenario B: Breakout continuation (only if price holds above value)
✅ If price holds above the value area and breaks higher cleanly:
Look for a small retrace to re-enter (no chasing)
Targets remain Strong Fibonacci → ATH
Scenario C: Rejection at Strong Fibonacci (short-term scalp)
✅ If price taps the Strong Fibonacci zone and shows clear rejection:
Sell scalp back toward value
SL: above the rejection swing
TP: nearest demand band / value zone
Logic: This is a reaction trade only — not a long-term bearish call while geopolitical premium is active.
5) Risk notes for headline-driven sessions
Expect wicks and fast sweeps — reduce size and avoid market orders at the open.
Wait for confirmation at the zone (rejection/engulf/MSS) before entering.
Don’t overtrade: one clean setup at a key level is enough.

XAUUSD (H2) – Liam View: Geopolitical risk stays hot, gold ...XAUUSD (H2) – Liam View: Geopolitical risk stays hot, gold remains supported | Trade the pullback, target ATH liquidity
Quick summary
The latest White House messaging on Venezuela is very direct: officials are signalling Washington will push Caracas to “act in America’s interests”, with Rubio reportedly in contact, while Stephen Miller framed the situation bluntly as “the world runs on power.”
For markets, this kind of rhetoric keeps geopolitical risk premium elevated — and gold typically benefits as a safe-haven when uncertainty increases.
On the chart (H2), gold is holding a bullish recovery structure and is now pushing into a higher-value area. My plan is to stay patient, buy pullbacks into liquidity, and watch for a final push toward ATH liquidity.
1) Macro context (why gold stays bid)
When major powers use strong language around military campaigns and “power-first” policy, traders price in:
Higher headline risk (sudden escalations / sanctions / retaliation)
More demand for safe-havens (gold)
Potential volatility in USD and yields, which can create fast spikes and liquidity sweeps
➡️ That’s why the best execution is still level-based: let price come to liquidity zones and trade the reaction.
2) Technical view (H2 – based on your chart)
Price bounced strongly and is building a clear recovery leg.
The chart highlights a value area / volume node (pink profile) where price is currently accepting — this usually acts like a magnet and a base for continuation.
Upside roadmap on your chart points toward:
a pullback into the mid-zones
continuation into “strong Fibonacci” resistance
then a run into ATH liquidity above
3) Key levels to watch (from the chart)
✅ ATH zone (major liquidity / ceiling)
✅ Strong Fibonacci (upper resistance band)
✅ Mid support zones (stacked demand areas below current price — ideal for pullback buys)
(Your chart marks multiple horizontal demand bands — I’m using them as reaction zones rather than exact-to-the-dollar predictions.)
4) Trading scenarios (Liam style: trade the level)
Scenario A (priority): BUY the pullback (trend continuation)
✅ If price dips into the nearest demand band (below current consolidation):
Buy on reaction (M15–H1 confirmation)
SL: below the demand band
TP1: return to current highs
TP2: Strong Fibonacci zone
TP3: ATH liquidity sweep
Logic: In geopolitical-risk conditions, gold often continues higher but still does “healthy” pullbacks to collect liquidity before the next push.
Scenario B: Breakout continuation (only if price holds above value)
✅ If price holds above the value area and breaks higher cleanly:
Look for a small retrace to re-enter (no chasing)
Targets remain Strong Fibonacci → ATH
Scenario C: Rejection at Strong Fibonacci (short-term scalp)
✅ If price taps the Strong Fibonacci zone and shows clear rejection:
Sell scalp back toward value
SL: above the rejection swing
TP: nearest demand band / value zone
Logic: This is a reaction trade only — not a long-term bearish call while geopolitical premium is active.
5) Risk notes for headline-driven sessions
Expect wicks and fast sweeps — reduce size and avoid market orders at the open.
Wait for confirmation at the zone (rejection/engulf/MSS) before entering.
Don’t overtrade: one clean setup at a key level is enough.

XAUUSD (H1) – Inverse Head & Shoulders confirmed, but caution neXAUUSD (H1) – Inverse Head & Shoulders confirmed, but caution near POC 💛
Market overview
Spot gold has pushed above $4,470/oz, extending its strong performance after setting multiple record highs throughout 2025. The broader bullish backdrop remains intact, supported by trade-war concerns, ongoing geopolitical instability, and accommodative monetary policy across major economies. Strong and persistent buying from central banks continues to underpin gold’s long-term outlook into 2026.
Technical view – Inverse Head & Shoulders
On the H1 chart, gold has clearly formed an Inverse Head & Shoulders structure:
Left shoulder: Formed after the initial sharp sell-off
Head: A deeper liquidity sweep with strong rejection
Right shoulder: Higher low, showing sellers losing momentum
Neckline / POC zone: Around the 4460–4470 area, where price is currently reacting
The breakout above the neckline confirms bullish intent. However, price is now trading around a POC (Point of Control), which is often prone to psychological reactions and choppy price action.
Key levels to watch
Bullish continuation zone
Holding above the neckline keeps the bullish structure valid.
A clean acceptance above the POC opens the door for continuation toward higher liquidity and Fibonacci extension targets.
Pullback & risk zone
Liquidity risk: 4333 – 4349
If the market fails to hold above the neckline, a deeper pullback into this liquidity zone is possible before buyers step back in.
Fundamental context
Gold’s recovery is driven by trade-war fears, geopolitical tensions, and expectations of looser monetary policy globally.
Central bank demand remains a key pillar supporting prices.
In 2026, gold performance will continue to be influenced by USD valuation, overall risk sentiment, and central bank policy decisions.
Lana’s trading approach
No chasing near the POC. Expect reactions and fake moves.
Prefer buying pullbacks rather than entering at highs.
If price holds above the neckline with strong structure, bullish continuation remains the main scenario.
If the neckline fails, wait patiently for liquidity to be taken lower before looking for new buy setups.
This analysis reflects Lana’s personal market view and is for study purposes only. Always manage risk carefully. 💛

XAUUSD (H1) – Bullish channel intact, short-term pullback in...XAUUSD (H1) – Bullish channel intact, short-term pullback in progress ✨
Market context
On January 7, spot gold and silver both saw short-term selling pressure.
Spot gold slipped toward 4450–4455 USD/oz after a recent rally.
Spot silver dropped below 79 USD, reflecting broader short-term profit-taking across precious metals.
This pullback looks technical and corrective, rather than a reversal of the broader bullish trend. The macro backdrop remains supportive: geopolitical risks, long-term central bank demand, and expectations of easier monetary policy continue to underpin precious metals.
Technical view – H1 (Lana’s perspective)
Price is still respecting a rising price channel, showing healthy trend structure despite the current retracement.
Key observations from the chart:
The ascending channel remains valid; higher highs and higher lows are intact.
Price has reacted from the upper half of the channel, triggering short-term selling into sell-side liquidity.
The dotted midline and channel support are acting as dynamic reaction zones.
The recent drop appears to be a liquidity sweep / correction, not a breakdown.
This kind of pullback is common after strong impulsive legs and often provides better positioning for trend continuation.
Key levels to watch
Sell-side reaction (short-term pressure)
Near the channel midline and upper resistance, price may remain choppy.
Expect volatility while sell-side liquidity is being absorbed.
Buy-side interest zones
4458 – 4463: First reaction zone inside the channel.
4428 – 4400: Stronger support aligned with channel base and prior structure.
Acceptance above these zones favors bullish continuation.
Fundamental angle
Short-term weakness in gold and silver is driven mainly by profit-taking after recent highs.
Broader fundamentals remain constructive:
Ongoing geopolitical uncertainty
Strong central bank demand
USD valuation and global risk sentiment
These factors suggest that dips are more likely to be corrective opportunities, not trend-ending signals.
Lana’s trading mindset 💛
Avoid chasing price during pullbacks.
Respect the channel structure and wait for price to come into value.
Look for clear confirmation at support zones before engaging.
As long as the channel holds, the bullish bias remains valid.
This analysis reflects a personal technical view for educational purposes only. Always manage risk carefully.

Gold Long, ICT ConceptThis is a long setup on gold following a strong accumulation phase that created four Fair Value Gaps (FVGs).
The setup offers a favorable 1:4 risk-to-reward ratio.
The only missing confirmation is a clear Market Structure Shift (MSS), which is expected to occur at the Sunday market open during the Asian session.

XAUUSD (H2) – Liam Plan (Jan 02) Price is compressing in a structure, wait for the trendline break to choose direction 🎯
Quick summary
After the strong bearish BOS, gold is rebounding and compressing inside a diagonal structure (triangle/flag-like). Today the clean approach is confirmation trading:
SELL only after a confirmed break of the trendline (4348–4350) as marked on your chart.
SELL reactions at the upper supply / VAL zones (4460–4463 and 4513–4518).
BUY is secondary — only if price holds the 4400–4405 key support and shows a clear reaction on lower timeframes.
Macro backdrop (CME FedWatch)
Probability Fed holds rates in January: 85.1%
Probability of a 25 bps cut in January: 14.9%
By March: probability of 25 bps cumulative cut: 51.2%, hold 42.8%, 50 bps cut 5.9%
👉 This keeps markets sensitive to USD / yields expectations. Gold can bounce technically, but volatility spikes are likely — so we stick to levels + confirmation.
Key Levels (from your chart)
✅ Sell zone 1: 4513 – 4518
✅ Sell VAL: 4460 – 4463
✅ Reaction / flip zone: 4400 – 4405
✅ Breakdown trigger: 4348 – 4350 (sell upon confirmed trendline breakout)
Trading scenarios (Liam style: trade the level)
1) SELL scenarios (priority)
A. SELL on trendline breakdown confirmation
Trigger: clean break + close below 4348–4350
Entry: sell the retest back into the broken trendline
TP1: 4320–4305
TP2: 4260–4240
TP3: deeper extension (towards the 41xx area) if momentum expands
Logic: This is the clearest “trend confirmation” on your chart. No chasing — let price confirm first.
B. SELL reaction at supply
Sell: 4460–4463 (VAL)
Stronger sell: 4513–4518 (premium supply)
Only sell with visible weakness / rejection on M15–H1.
2) BUY scenario (secondary – reaction only)
Buy zone: 4400–4405
Condition: hold the zone + print higher lows on lower TF
TP: 4460 → 4513 (scale out)
Logic: This is a key support/flip area. If it holds, price can rotate up to test supply above before the next decision.
Key notes
Compression often creates false breaks — don’t trade mid-range.
Two clean plays only: break 4348–4350 to sell with confirmation, or retrace to 4460/4513 to sell the reaction.
What’s your bias today: selling the 4348 breakdown, or waiting for 4460–4463 for a cleaner pullback sell?

XAUUSD WXAUUSD is in an uptrend and may retest the marked area. After that, the trend is likely to continue. Key levels are important to monitor to see how the market reacts from this point.

What I think about Future Indices: NQ, ES and YM
We are in the last day of 2025, but the market do not closed yet. All three assets is in bullish trend. By the way now is dropping for whole week for reprice. NQ already fill the New Week Opening Gap (NWOG) while ES and YM do not. So my Sell Side Liquidity for ES and YM is Low of Tuesday 24 December 2025.
On hourly Time Frame, I will confidence for long NQ when NQ Close Above bearish FVG on Hourly or ES or YM purge Daily Low (Tuesday 24 Dec 2025). For now my intraday is bearish move until Discount Fair Value Gap align with Standard Deviation -2to -2.5 level for NQ move.
I will look at chart again before 9:30 am EST before New York Open
Happy New Year.

ICT Trader - Top Down Analysis on ETH!Guys this is the first time I’ve fully broken down exactly how I trade crypto using the ICT strategy step by step, top down.
In this video, I take you through my entire charting process, starting from the monthly timeframe all the way down to the 1 hour, explaining how I build conviction, define bias, and execute trades using the ICT concepts.
I also explain why I’m bullish, even while most people are bearish and why I’m completely fine going against the crowd when the charts support it.
You’ll see:
-Top Down analysis from Monthly to 1HR
-How I read the charts and use liquidity to decide my bias
-HTF Bias vs LTF bias
-How we can make money regardless if we are bearish of bullish!
If you want to understand how ICT concepts are actually applied in real market conditions, this video will change how you look at charts.
I am launching my website soon which where I will essentially give you the full education of ICT from beginners to advanced in FOREX and CRYPTO. So hit the follow button and I will keep you all updated.
⚠️ Disclaimer:
I am not a financial advisor. The content shared on this channel is for educational and informational purposes only and should not be considered financial advice.
Trading and investing in cryptocurrency involve high risk — you could lose some, or all, of your money. Always do your own research and make sure you understand the risks before making any financial decisions.

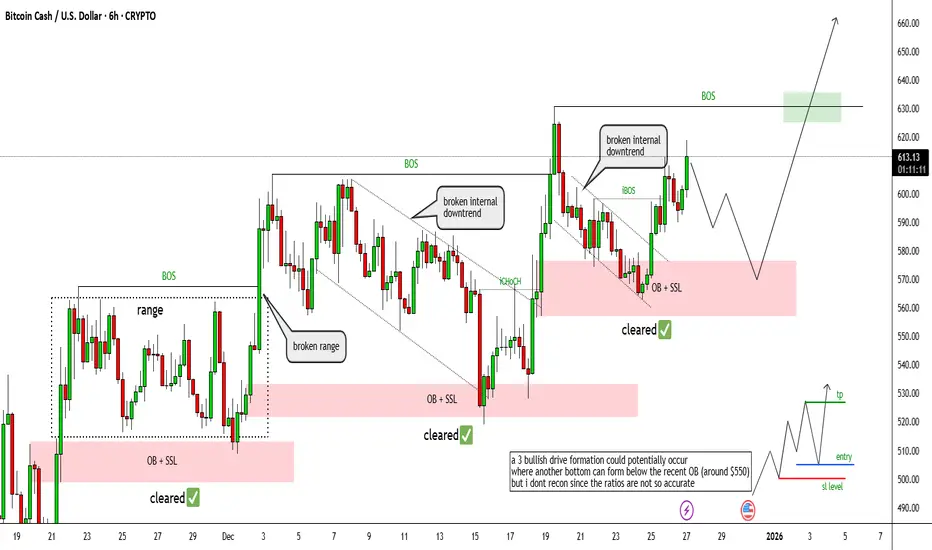
BCHUSD The Exact Blueprint For Late BuyersHello traders,
Bitcoincash broke a very strong downtrend earlier and we had a very good entry point at $527 (already 15% ahead so far)
So for late buyers, is it over? Not really imo. Here is my break down.
Price has made 2 major BOS in a 4HTF uptrend. That confirms the market intentions to push price higher. We trade where the overall structure flows.
I think the most recent OB and SSL has been swept. However, a not very common scenario can happen which is a 3 bullish drive formation. Where price can sweep deeper liquidity around $550 then push higher.
If you are a late buyer, set a buy limit order @$550, $570 and wish for the best.
But what if price didn't retract that much? Take your buy orders @$630 AFTER a clear BOS & retest of support zone. I repeat... AFTER a break & retest.
That is your blueprint for this BCH move.
Good Luck!
All our analysis is shared with honesty, care, and real effort. If you find value in it, a like or comment means a lot to show your support🙏📊
XAUUSD – Technical Analysis on 3H FrameXAUUSD – Technical Analysis on 3H Frame
✅ Lana waits for a correction to buy safely 💛
Trend: Very strong increase, continuously setting new highs
Monitoring frame: 3H
Current status: Price is rising sharply, no significant correction yet
Strategy: Do not chase buying, wait for a correction to the liquidity zone to Buy
Market context
In today's Asian session, gold has surged strongly and approached the 4500 zone, an unprecedented price level. The increase is very steep, with almost no pause or small correction, indicating that buying pressure is completely dominant.
From a fundamental perspective, the expectation that the Fed will continue to maintain a dovish stance is weakening the USD, combined with escalating geopolitical tensions, has reinforced gold's role as a safe haven. The decisive break of the 4375–4380 zone and then 4400 has triggered additional speculative inflows following the upward trend.
Technical view on 3H frame
On the 3H frame, the upward structure is still very clear and the price channel is well maintained. However, when the increase range is too large and continuous, entering orders at high zones becomes very risky.
For Lana, in such phases, patiently waiting for a correction is more important than trying to catch up with the market.
If the buying force continues after a pause, further targets around 4580 can be fully aimed for.
Price zones Lana is monitoring
Near Buy zone – Liquidity
Buy around: 4415
This is the nearest liquidity zone, where the price may return to "gain momentum" before continuing to rise. Lana will closely observe the price reaction here.
Long-term Buy zone – Deep correction
Long-term Buy: 438x
If the market shows a clearer correction, this is the price zone Lana prioritizes to find safer buying opportunities for the medium-term trend.
Notes when trading
Do not chase buying during phases with too large a range
Only enter orders when the small frame creates a clear structure according to Dow theory
Reduce volume, prioritize risk management during high market excitement phases
FOLLOW LANA TO ANALYZE TOGETHER EVERY DAY.

XAUUSD (H1) – Trading by LiquidityXAUUSD (H1) – Trading by Liquidity
Price breaks the channel but buying power is weakening, wait for a pullback to the trendline to enter a trade
Summary of today's strategy
Gold has broken the price channel, but the key point is that buying power is weakening after the breakout. As the market is about to enter the holiday season – with thin liquidity, I prioritize trading in the "right zone" (liquidity), not FOMO. Plan: watch for a Buy when the price pulls back to the trendline/old channel, and Sell reactively at the Fibonacci liquidity zone 4474–4478.
1) Key Levels today (according to the chart)
✅ BUY Zone (liquidity pullback)
Buy Zone 1: 4379 – 4382
SL: 4373
Buy Zone 2: 4361 – 4358
SL: 4353
These are the "beautiful" price zones to wait for a pullback – true to the spirit of trading by liquidity: wait for the price to return to the reactive zone, do not chase buying at the top.
✅ SELL Zone (Fibonacci liquidity)
Sell zone: 4474 – 4478
SL: 4482
This zone is "premium + liquidity" so if the price touches it and cannot hold, the likelihood of a profit-taking/reversal is very high.
2) Main Scenario: Wait for a pullback to the channel/trendline to Buy
After a breakout, the market often tends to retest the old trendline/channel to check real buying power.
Since buying power is weakening, the likelihood of fluctuations to sweep liquidity is high → must be patient to wait for the zone 4379–4382 or deeper 4361–4358.
Expected target (scalp/short swing): capture a pullback of 8–15 points depending on volatility, take partial profits when the price bounces according to the plan.
3) Secondary Scenario: Sell reactively at the zone 4474–4478
If the price continues to pull up to the fib zone, I prioritize reactive Sell instead of chasing buy.
Only sell when there are signs of "weakness" (long wick/shadow, not closing strongly above the zone).
4) News Context: Weak liquidity → easy "sweep"
The market is approaching the holiday season, liquidity is weakening, making it easy for spikes/stop-hunts to occur.
Political-economic stories related to policy/tax refunds are causing businesses to prepare strategies, but during this period, prices often react strongly to short-term cash flows rather than sustainable trends.
Conclusion: Today prioritize "right zone – right discipline", limit entering trades mid-way.
5) Risk Management
Maximum risk per trade 1–2%.
Do not enter trades when spreads widen/unusual candle spikes.
Which scenario are you leaning towards today: pullback to 4379/4361 to Buy, or pull up to 4474–4478 to Sell reactively?

EURUSD Long: Post-SSL Reversal (London Open)1. MACRO & CONTEXT
Environment: Monday, Holiday Week (Low Liquidity).
Bias: Bullish Reversal following a "Judas Swing" into the Asian Lows.
News: Clear docket (No high-impact drivers).
2. TECHNICAL ANALYSIS (ICT CONCEPTS)
Liquidity Run: The algorithm successfully purged Sell-side Liquidity (SSL) below 1.17130 (Asian & Bridge Lows).
Market Structure Shift (MSS): A clear displacement candle has closed above the Bridge High (1.17221), confirming a shift in order flow from Bearish to Bullish.
PD Array: A fresh Bullish Fair Value Gap (FVG) has aligned perfectly with the Optimal Trade Entry (OTE) fib levels.
3. EXECUTION PLAN
Type: Limit Order (Buy).
Entry Zone: 1.17175 - 1.17188 (Discount Array).
Stop Loss: 1.17125 (Hard stop below the Swing Low).
Take Profit:
TP1: 1.17243 (Secure partials).
TP2: 1.17378 (Run on Previous Day High).
4. RISK NOTE Due to the holiday season volatility/thin books, risk is capped at 0.25% - 0.5%.
Plan the trade, trade the plan.

XAUUSD – Lana prioritizes Buying on retracement XAUUSD – Lana prioritizes Buying on retracement 💛
The uptrend has been confirmed: Lana prioritizes Buying on retracement 💛
Quick Summary
Trend: Strong upward, no clear correction signs
Status: New ATH has been established
Monitoring Frame: H1
Strategy: Prioritize Buying, wait for price to retrace to liquidity zones
Market Perspective
Gold is maintaining a very strong upward momentum and continuously setting new highs. When drawing the price channel, it can be seen that the price is currently touching the upper area of the channel, indicating the possibility of a slight reaction or short retracement before continuation.
The next Fibonacci target is around 4414, which is an area where short-term technical reactions may occur, but the main trend remains upward.
Technical Perspective
After a strong breakout, the market often tends to return to test the liquidity/ value area before continuing. Lana does not chase buying at high levels but prioritizes waiting for technical retracements to enter orders in line with the trend.
Priority Buy Trading Plan
Buy Scenario 1 – Near Liquidity Zone
Buy: 4371 – 4374
SL: 4165
This is a price area with strong liquidity, suitable for waiting for a reaction to continue the upward trend if the price retraces slightly.
Buy Scenario 2 – Deeper Retracement Zone
Buy zone: 4342 – 4339
SL: 4330
If the market adjusts deeper in the year-end liquidity condition, this is the area Lana prioritizes for finding a safer entry point.
Fundamental Perspective
Spot gold prices have surpassed the $4,400/ounce mark for the first time, recording a nearly 68% increase for the year.
The upward momentum is not only seen in gold but also extends to silver and platinum, supported by:
Expectations of continued Fed rate cuts
Strong inflows into ETF funds
Net buying activities by central banks
Escalating geopolitical tensions
The year 2025 closes with a very impressive picture for the precious metals group.
Lana's Notes 🌿
Strong upward trend → prioritize Buying on retracement, avoid FOMO
Always set clear stop-losses, reduce volume during high volatility periods
If the price does not reach the waiting area, Lana is ready to stay out

Intraday Scalp: Midnight Open Breakout (Counter-Trend)Market Context Price is compressing below the Midnight Opening Price (1.17180) following a sweep of sell-side liquidity at 1.17080. The current M5 structure suggests accumulation, but the H1 order flow remains bearish. This creates a conflict between timeframes.
Trade Logic This is a short-term volatility scalp targeting buy-side liquidity resting above immediate bridge highs.
Execution Plan
Trigger : Requires a confirmed M5 candle body closure above 1.17180.
Entry : Limit order at the 1.17120 Bullish FVG (Discount Array).
Invalidation : A swing failure pattern (wick only) at 1.17180 or a close back below 1.17120.
Target : 1.17216 (Bridge Highs).
Risk Management This setup opposes the higher timeframe bias.
Risk: 0.25% (Quarter size).
Management: Take profit at target, do not hold for reversal.

267 handle move bullish - NQ
Lower 1D Shadow quadrant exactly respected, which is a strong bullish sign according to ICT
1D Breaker MT (midpoint or mean-threshold) exactly respected with the candle bodies, which is also a strong bullish sign according to ICT
The event horizon - which is the midpoint of 2 new-day- or new-week-opening-gaps align exactly with the 1D volume imbalance CE (consequent encroachment or midpoint)
Strong bullish market-structure and the movement aligns with seasonal tendencies as well

XAUUSD – Lana prioritizes Buying on the retracement to FibonacciXAUUSD – Lana prioritizes Buying on the retracement to Fibonacci 💛
Quick Summary
Short-term trend: Continued increase
Monitoring frame: H1
Context: Weak liquidity due to upcoming holiday, price has not decisively broken resistance
Strategy: Prioritize Buying, wait for price to retrace to the 50 Fibonacci zone
Market Context
Gold prices continue to maintain an upward momentum and are approaching the historical peak around 4350 USD/ounce. Although it has not completely broken the upper resistance, the upward trend remains strong.
The rise in gold is supported by U.S. employment data showing signs of weakening, expectations of the Fed lowering interest rates soon, and escalating geopolitical tensions, especially concerns related to Venezuela ahead of President Trump's speech.
In conditions of reduced liquidity due to the holiday, the market may fluctuate more slowly, but the main trend still leans towards buying.
Technical View H1
On H1, the upward structure is well maintained. The price is accumulating below a strong resistance zone, indicating the market needs more time to absorb selling pressure.
The 50 Fibonacci zone currently coincides with the support area that reacted strongly yesterday, suitable for waiting for a retracement and then continuing to trade with the trend.
Intraday Trading Scenario
Main Scenario – Buy according to the upward trend
Entry: 4309 – 4312
SL: 4300
TP: 4330 → 4352 → 4390
Lana prioritizes waiting for a slight price adjustment to this zone to enter orders, rather than chasing buys when the price is near resistance.
Trading Notes
Weak liquidity → avoid large orders, prioritize risk management
If the price does not retrace to the waiting zone, Lana is ready to stay out
Observe price reactions at resistance before expecting a breakout
Lana's Notes 🌿
Each setup is just one possibility among many market scenarios. Lana always sets clear stop losses and only trades when the price reaches the planned zone.

Bullish Daily Bias After Previous Day Low Being RaidPrice swept yesterday’s low and it's reclaiming it with a potential bullish close, indicating sell-side liquidity absorption. I am therefore targeting long opportunities, anticipating bullish close today and a continuation expansion move tomorrow.
Note: this is quite risky as I usually wait for candle close to confirm the sweep.

XAUUSD (H1) – Gold Trading Plan 12/18 XAUUSD (H1) – Gold Trading Plan 12/18
Wait for CPI to "choose direction" | Break 4355 to Buy, break trendline to Sell
Strategy Summary (understand the plan in 10 seconds)
Before the US CPI data, Gold is likely to hold its price within a range and will only truly "make a big move" when there is confirmation of a structural break. Currently, the price is still following the upward channel, but volume is clearly decreasing → prioritize trading in a break-confirm style, avoid FOMO.
Buy is only valid when surpassing the strong resistance 4355
Short-term sell if the upward trendline breaks
Medium-term sell if the bottom 4306 breaks
Key Levels (important levels according to the chart)
Strong resistance: 4355 (the "door" area for buyers to confirm)
Sell scalping zone: 4354–4355 (short-term reaction area)
Sell zone liquidity: 4392 (liquidity sell area above)
Structural level / important bottom: 4306 (breaking opens the medium-term sell scenario)
FVG / deep liquidity attraction zone: 4248 (target if the market sells off strongly)
Scenario 1: Price Increase (only activated when breaking 4355)
Confirmation condition: Price breaks and holds above 4355 (preferably with a clear H1 candle close).
✅ Buy entry: 4348
SL: 4340
TP1: 4355–4360
TP2: 4392 (sell zone liquidity)
Logic: When volume decreases, false breakouts are very likely. Therefore, only buy when the price surpasses the "directional" resistance area 4355.
Scenario 2: Short-term Price Decrease (prioritize if the upward trendline breaks)
Confirmation condition: Break the lower trendline of the upward channel → sell following the break rhythm.
After breaking, prioritize selling on a retest back to the trendline/near resistance (avoid chasing the bottom).
The first target is usually the liquidity area below around 4306.
Logic: The trendline is the "backbone" of the upward rhythm. Losing the trendline in the context of CPI + weakening volume → the market is likely to have a quick sell-off to sweep liquidity.
Scenario 3: Medium-term Price Decrease (when breaking the bottom 4306)
Confirmation condition: Price clearly breaks 4306.
✅ At that point, prioritize medium-term selling according to the structure.
Expected TP: expand down to deeper support areas, with the FVG 4248 zone being a notable attraction point.
News Context (why "wait for confirmation" today)
The market is waiting for US CPI – inflation data that could change expectations about the Fed's rate cut path, thereby directly impacting the USD and determining the next directional move of XAUUSD. Therefore, today prioritize: wait for a range break + tight risk management.
Risk Management
Maximum risk per order 1–2%.
If SL is hit: stop, wait for re-confirmation (don't revenge trade).
This article shares a perspective and trading plan

Sell-Side Taken at PD Low | Long BiasPrice swept yesterday’s low and reclaimed it with a bullish close, indicating sell-side liquidity absorption. I am therefore targeting long opportunities, anticipating bullish expansion today.
