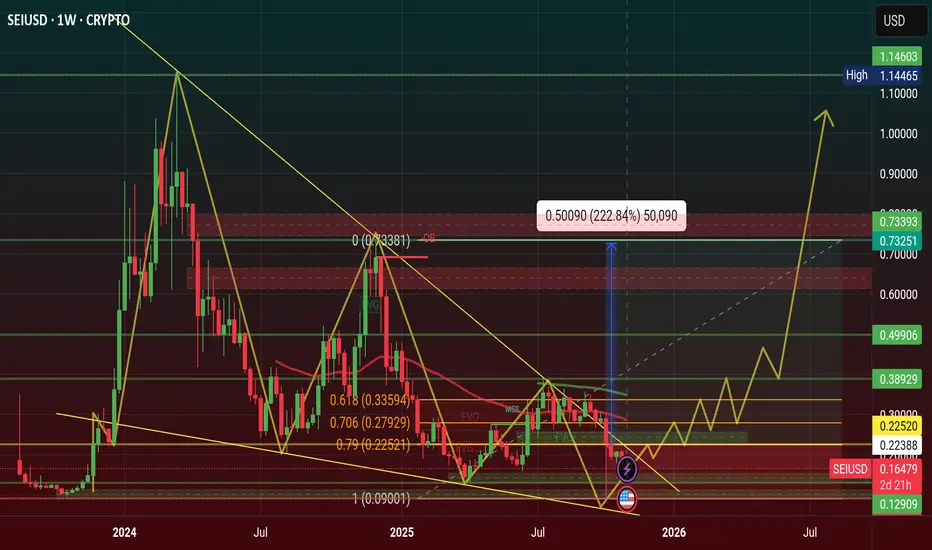
$SEI Price will hit $1.22 in 2026, Falling Wedge Pattern WeeklySEI price is showing a Bullish Pattern of Falling Wedge Pattern, when this pattern will create on chart after price will be upward direction.
Price Will hit $1.11 in 2026 and 2027 is $2.22, $3.33
Entry Point is $0.22, $0.27, $0.33 and Stoploss point $0.09
2026 Target point $0.49, $0.77, $1.11
2027 Target point $2.22, $3.33
#trending #Highlight #trendingideas #SEI #SUBROOFFICIAL
Disclaimer: This article is for informational purposes only and does not constitute financial advice. Always conduct your own research before making any investment decisions. Digital asset prices are subject to high market risk and price volatility. The value of your investment may go down or up, and you may not get back the amount invested. You are solely responsible for your investment decisions and Binance is not available for any losses you may incur. Past performance is not a reliable predictor of future performance. You should only invest in products you are familiar with and where you understand the risks. You should carefully consider your investment experience, financial situation, investment objectives and risk tolerance and consult an independent financial adviser prior to making any investment.
Ictconcepts
Gold Price Forecast (7 Nov 2025): Buyers Waiting Below $4,000📌 Current Price Snapshot
The spot price for Gold is around US $3,991 per troy ounce (as of 7 Nov 2025) according to
In Australian dollars the price is about A$6,144 per troy ounce.
🎯 Key Technical / Market Context
Resistance / Support zones
The metal has tested and broken through the psychological US $4,000/oz level recently but has found resistance there.
World Gold Council
A key breakdown level is around US $3,700/oz. If price drops below that, it opens a risk of deeper pull-back (to ~US $3,500/oz).
On the upside, if momentum returns and breaks convincingly above ~US $4,400/oz it could trigger a fresh leg upward.
Technical indicators
The recent analysis shows gold is trading below its 50-day EMA, meaning short-term momentum is weak and there’s dominant selling pressure.
Economies.com
While oversold indicators have given somewhat of a bounce, the up-trend is not yet strong.
Economies.com
Drivers (fundamentals & macro)
A weaker US dollar and expectations of rate cuts by Federal Reserve have been major tailwinds for gold.
goldpriceforecast.com
Geopolitical uncertainty and central-bank buying are adding structural support.
But caution: If the dollar strengthens, or rate cuts get delayed/inflation surprises happen, gold could be vulnerable.
BullionByPost Europe
🔍 My Trading View & Strategy
Given the current levels and market structure, here’s how I’m positioning, if I were trading gold today:
Short term (next few days to 1–2 weeks):
With the price ~US $3,991 and under pressure below key moving averages, I’m not chasing a long position aggressively. I’d wait for either:
A dip toward support (~US $3,700) with signs of bounce (good risk-to-reward for long).
Or a breakout above ~US $4,200-US $4,400 with strong volume and momentum for long.
Medium term (next 1-3 months):
My base view is still bullish (structural tailwinds remain) but price is in a consolidation/correction phase. So:
Consider buying on dips around US $3,700-3,800 with tight stops.
If price drops below US $3,500, reevaluate: risk of deeper correction.
If price breaks above US $4,400 convincingly, potential target toward US $4,800+ in that window.
Risk management:
Stop-loss placed just below the key support (e.g., beneath US $3,650) to protect downside.
Use smaller size if entering in this somewhat volatile environment.
Keep an eye on macro news (Fed announcements, USD moves, inflation prints).


Long towards Relative Equal HighsLong scenario for a Thursday reversal after major sellside levels have been triggered and a Breaker formed in Wednesday. Wednesday's high resides just below Tuesday's which makes the Buyside likely to get delivered.
Crude oil waiting for longsCrude oil weekly chart.
After taking lower high weekly candle, price run $+61 for that dealing range I was looking for price retrace to fibo 50% level, we are almost there, I will look for lower t market structure break for confirmation, after that will long oil

GOLD CONFIRMS SHORT-TERM DECLINE AFTER BREAKING TRENDLINEXAUUSD – GOLD CONFIRMS SHORT-TERM DECLINE AFTER BREAKING TRENDLINE
🪞 1. Overview
🌤️ In this morning's Asian session, gold broke the upward trendline even though the selling pressure wasn't particularly strong.
However, this is the first signal indicating the short-term trend is leaning towards the sellers.
💬 Currently, the 3996 zone is a crucial resistance, and the price is likely to retest this area before continuing to decline.
If the price surpasses the FVG at 4007, the trend may temporarily rebound in the short term.
💹 2. Technical Analysis (ICT Perspective)
🔸 Market structure: After breaking the trend, the structure temporarily shifts to short-term bearish.
🔸 Liquidity & FVG: Liquidity is drawn towards the 3960–3940 zone, while FVG 4007 is the first barrier.
🔸 Order Flow: Smart Money might slightly sweep up to the resistance zone before pushing the price further down.
🎯 3. Reference Trading Scenarios
💔 MAIN SELL
Entry: 3996 | SL: 4004
TP: 3985 – 3972 – 3948
💢 SCALPING SELL
Entry: 4007 | SL: 4014
TP: 3998 – 3978
💖 REACTIVE BUY
Entry: 3965 | SL: 3957
TP: 3976 – 3988 – 3999
🌸 DEEP BUY
Entry: 3941 | SL: 3931
TP: 3955 – 3968 – 3988 – 4012 – 4066
🔍 4. Key Price Zones to Watch
✨ 4007 → FVG resistance, short-term trend confirmation zone
✨ 3996 → Zone to retest the broken trendline
✨ 3965 – 3941 → Strong support zone, likely to trigger a reversal reaction
💬 5. Notes & Call to Action
⚠️ This is not an investment recommendation, but merely a personal technical perspective using the ICT method.
Observe the price reaction around the trendline carefully before making a decision 💭
If you find this article helpful, please 💛 like – 💬 leave a comment – 🔔 follow LanaM2
to stay updated with daily gold insights and learn more about the Smart Money Concept 🌷✨

$XAU will hit $5,555 Incredible Price In 2026Gold Price Showing Bullish Accending Triangle Pattern in chart, this pattern move Upward Direction and price up ATH area. than price Consolidate this area than price Move Up $4,545, $4,747, $4,949 area and $5,252 area in 2026, Surprised Price Will Be $5,555 best of the year of Gold.
TVC:XAU Buy Position Setup
Three Buy Zone of Golden Fibonacci levels, areas is $3,933, $3,980, $4,029, it's a Key Support area. Stoploss area $3,815 and it's Strong Support areas.
Dynamic Resistance area Is new ATH area $4,398, and Three Target area, $4,103, $4,233, $4,375, of 11.11% Roi. if price up Retested than Breakout Key Support area.
#gold #smartmoneyconcept #highlight #XAU #SUBROOFFICIAL
Disclaimer: This article is for informational purposes only and does not constitute financial advice. Always conduct your own research before making any investment decisions. Digital asset prices are subject to high market risk and price volatility. The value of your investment may go down or up, and you may not get back the amount invested. You are solely responsible for your investment decisions and Binance is not available for any losses you may incur. Past performance is not a reliable predictor of future performance. You should only invest in products you are familiar with and where you understand the risks. You should carefully consider your investment experience, financial situation, investment objectives and risk tolerance and consult an independent financial adviser prior to making any investment.

eur cad sell opportunity expecting eur cad further sell as we can see bunch of liquidity resting below.
recent fed rate cut supporting usd to move higher
eur cad just broken channel and soon expecting a retest

EUR/USD trade ideaAfter a heavy day yesterday I believe euro still hasn’t reached its DOL, seeking for daily equals lows.

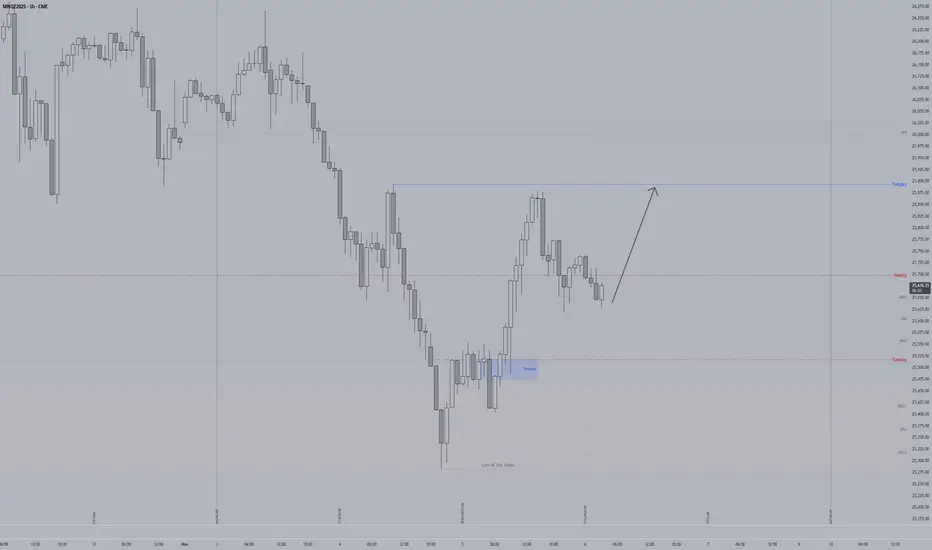
Nasdaq 100 Trade ideaLet’s see how it reacts to this BISI, could be seeking for the highs it just created.

Will AFRM Find a Bottom This Week Heading Into Earnings on 11/6?"Abide in me, and I in you. As the branch cannot bear fruit by itself, unless it abides in the vine, neither can you, unless you abide in me. I am the vine; you are the branches. Whoever abides in me and I in him, he it is that bears much fruit, for apart from me you can do nothing."
- John 15:4-5
Hello Traders!
As part of my weekly equity trade analysis, I will be uploading my recordings of what I am seeing and intending to trade for the week. A quick summary of what's in the video is as follows:
- W has seen 5 consecutive months of higher closes. Can it deliver on earnings and see another month of higher closing prices?
- AFRM and other fintech stocks will be impacted by earnings and fed rate decision this week. We are waiting to see if price goes to support first to allow for a deep discount on weekly call options
- We are expecting a retracement on AFRM to resolve some imbalances at $66.41, but to structurally hold key levels above $65, and to close the week near $80. On W we are waiting for price to get near $65 for a close at or above $80 per share.
- Our vehicle of choice this week are the $75 weekly calls on AFRM and $70 weekly calls on W
Cheers,
DTD
Financial Risk Disclaimer |
DISCLAIMER: I am not a financial adviser. The videos on my channel are for educational and entertainment purposes only. I'm just showing you guys how I invest and day trade, but remember, investing of any kind involves risk. Your investments are solely your responsibility and not mine. While day trading can bring substantial gains, it can also bring serious losses! So make sure you do your research to fully understand the market before diving in. The possibility exists that you could sustain a loss of some or all of your initial investment, and therefore should not invest money that you can't afford to lose. The fluctuation of the market can work for you or against you. You should carefully consider your investment objectives and experience before deciding to trade in the market. Again, what you invest in is solely your responsibility.

#CADJPY +2300 Pips Swing Buy With Three Major Targets| Possible?The CADJPY has nicely formed a swing bullish pattern that is confirmed. One strong entry zone lies between these prices, 109 and 106, which remain a critical level. As described in the chart, there are three targets to focus on. We strongly recommend thoroughly examining the charts and reading them carefully, as this description is brief due to the detailed chart.
Here’s what to look for:
- Look for a continued or repeated pattern to better understand the next possible move.
- Look for volume when it emerges; enter with the trend momentum.
- Don’t forget to like and comment on the chart!
Team Setupsfx_

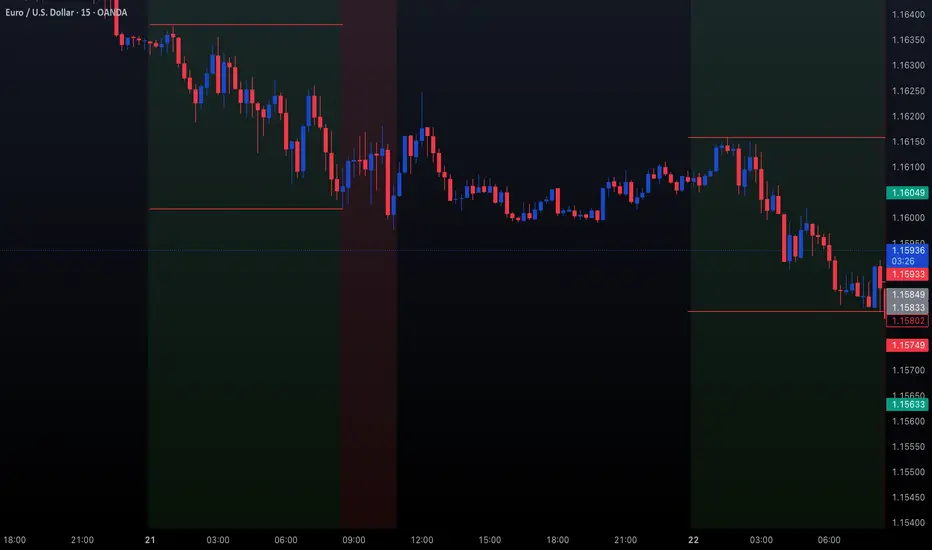
Trading EURUSD | Judas Swing Strategy 22/10/2025The Judas Swing strategy continues to show how patience and structure can consistently produce high-probability setups. Yesterday FX:EURUSD offered a clear example of how the market manipulates early liquidity before revealing its true move.
Heading into 08:30EST, price had been trading in a tight range throughout 00:00 - 08:30EST. Our attention was on the highs and lows, key zones that often set the stage for the Judas Swing’s liquidity sweep.
Price ran below the low at 08:35EST, taking out liquidity resting beneath those lows. This was our first signal, a potential false move designed to trap early sellers. Once that downside sweep occurred, we shifted our focus to the upside looking for buys. The key confirmation came shortly after with a clean break of structure to the upside, showing that momentum was reversing. At this point, all we needed was patience. We waited for price to retrace into the fair value gap (FVG) formed during the impulsive move up.
Once price tapped into the imbalance, we executed our long position with 1% risk, targeting a 2% reward. Initially, the market dipped slightly below our entry, testing our patience but our stop was well-placed beneath the liquidity sweep, giving the trade enough room to breathe
Within minutes, the bullish momentum kicked in. The move from discount pricing quickly turned into a strong rally as price reclaimed the earlier range and pushed firmly into premium levels.
Our target was hit decisively, delivering a +2R return in just an hour and 45 minutes. A clean execution, following the exact sequence of events the Judas Swing strategy thrives on:
1. Liquidity sweep
2. Break of structure
3. Retrace into FVG
This trade was a perfect reminder that discipline and structure always win. It’s easy to get tempted by early entries or impulsive setups, but the Judas Swing strategy continues to show that following your rules pays off
AVNT Bullish Reversal / Accumulation Entry on the 2H macro phase.
2H Manipulation phase (0.7258 - 0.4316) is confirmed as {COMPLETE}. Price is now in the high-probability {Accumulation} phase—the institutional setup for a massive directional shift.
ENTRY CONFLUENCE (UNICORN MODEL)
MAIN ENTRY 0.5007
exact boundary of the 30m FVG (0.5007 - 0.4990), strategically placed for optimal mitigation and nested within the 30m Breaker Block for supreme structural support.
SL 0.4866 (Placed below the 30m Breaker Block for absolute invalidation control

Possible Idea If we see a retrace into tht breaker tonight to tmr and get a confirmation for shorts i'd aim for those EQL from last week

EUR/USE Trade ideaAs expected GBP melted with CPI, I believe euro will follow so entered on this OB-, Draw on liquidity are those equal lows on the H4.


Dip Buying Levels on TSLA Post Earnings"Abide in me, and I in you. As the branch cannot bear fruit by itself, unless it abides in the vine, neither can you, unless you abide in me. I am the vine; you are the branches. Whoever abides in me and I in him, he it is that bears much fruit, for apart from me you can do nothing."
- John 15:4-5
Hello Traders!
As part of my weekly equity trade analysis, I will be uploading my recordings of what I am seeing and intending to trade for the week. A quick summary of what's in the video is as follows:
- TSLA earnings are highly anticipated with most retail traders expecting bullish continuation from its breakout from previous consolidation
- We are expecting a retracement to resolve some imbalances, but to structurally hold key levels either above $408 or $385, and to close the week above last week's high over $440
- Our vehicle of choice this week are the $430 weekly calls or $415 calls (if price retraces further to $390)
Cheers,
DTD
Financial Risk Disclaimer |
DISCLAIMER: I am not a financial adviser. The videos on my channel are for educational and entertainment purposes only. I'm just showing you guys how I invest and day trade, but remember, investing of any kind involves risk. Your investments are solely your responsibility and not mine. While day trading can bring substantial gains, it can also bring serious losses! So make sure you do your research to fully understand the market before diving in. The possibility exists that you could sustain a loss of some or all of your initial investment, and therefore should not invest money that you can't afford to lose. The fluctuation of the market can work for you or against you. You should carefully consider your investment objectives and experience before deciding to trade in the market. Again, what you invest in is solely your responsibility.

SPX500 Short IdeaWe can see on daily timeframe SPX500 has smt with NAS100. And Price both hit Previous Day High. So my idea is price today bearish to 4H FVG previous day range. Still waiting for 4H show the signal if the idea align with market. FX:SPX500

Bullish Bias Toward $4,400+🌍 Fundamental Overview
Gold is trading around $4,135–$4,155/oz, staying firm despite mild USD recovery.
Friday’s U.S. data (Michigan Consumer Sentiment, inflation expectations) came slightly higher, but Fed cut expectations remain unchanged — markets still price 99% chance of a rate cut in October.
Geopolitical backdrop remains tense — Middle East concerns, ongoing U.S.–China trade friction, and soft global growth outlook keep gold demand resilient.
ETF inflows show renewed interest; central banks (China, Turkey, India) continue accumulating.
Short-term: Profit-taking possible early this week; medium-term trend remains bullish toward $4,300+.
📊 Technical Overview
Current Price Range: $4,135 – $4,155
Support Zones:
$4,120 (minor intraday support)
$4,080 (major short-term floor)
$4,050 (psychological & structural support)
Resistance Levels:
$4,180
$4,200 (key breakout zone)
$4,300 (next major upside target)
Trend: Bullish consolidation — healthy sideways price action above $4,100 zone.
RSI (H4): Resetting from overbought, suggesting space for renewed upside momentum.
🎯 Trading Strategy
1️⃣ Buy Dip Setup
Entry: $4,090–$4,120
SL: below $4,050
TP: $4,180 → $4,220
2️⃣ Breakout Buy
Entry: above $4,180 (confirmed 1H close)
SL: below $4,150
TP: $4,250 → $4,300
3️⃣ Short Scalp (Counter-trend)
Entry: $4,180–$4,200 (if rejection appears)
SL: above $4,220
TP: $4,120 → $4,080
📌 Bias: Bullish above $4,080 — watch for early-week volatility and liquidity traps.

Gold Steady Above $4,000 — Dips Remain Buying Opportunities1) Macro & Fundamental Drivers
Narrative: Gold remains in a structural bull phase, supported by policy-easing expectations, soft USD/real yields, and persistent safe-haven demand. After the vertical run to—and through—the $4k handle, price is consolidating at elevated levels.
Rates/Yields: Markets still price near-term Fed cuts; real yields have eased from recent highs—historically bullish for gold.
USD: The dollar is mixed but broadly softer on easing expectations and global growth worries—tailwind for XAU.
Growth/Inflation mix: Growth data is uneven, inflation trend is moderating on a 3–6m basis; that reduces the opportunity cost of holding gold.
Risk Premium: Ongoing geopolitical/fiscal headlines (US fiscal noise, US–China tension) keep safe-haven bids alive.
Official & Institutional Demand: Central-bank net buying remains a structural pillar; ETF/retail participation is improving on breakouts.
Supply: Mine output growth is slow; AISC (all-in sustaining costs) are elevated—supportive to longer-term floor.
Bottom line: Macro backdrop remains gold-positive, with the caveat that the pace of the recent rally leaves price vulnerable to tactical pullbacks.
2) Flows & Positioning (what matters for timing)
CTA/Trend followers: Likely max long or near it after the $4k breakout. This magnifies both momentum upswings and the risk of air-pocket pullbacks if key levels break.
Options: Skew is biased to calls (crash-up hedging) but rich—implieds elevated. Fade extreme IV spikes; use options for defined-risk breakout exposure.
ETFs/CBs: Dip buying remains a theme; structural demand reduces the depth/duration of corrections.
3) Technicals (multi-timeframe)
Weekly
Trend: Strong uptrend, higher highs/higher lows; price well above rising 20/50-WMA equivalents.
Momentum: Weekly RSI high but not reversing—trend intact.
Daily
Structure: Post-breakout sideways-to-up range developing above the $4k handle (healthy digestion).
Key Levels:
Support: $4,100 (nearby pivot) → $4,050 (strong base) → $4,000 (psych + breakout retest).
Resistance: $4,180–4,200 (cap) → $4,300 (extension) → $4,400+ (measured move if momentum resumes).
Indicators: RSI cooling from overbought; ADX still firm; 10/20-DMA above 50-DMA—bullish stack.
Volatility: Daily ATR expanded—position size down, wider stops.
Intraday (H1–H4)
Bull channel intact while price makes higher lows above $4,100–4,120.
Intra supports: 4,120 / 4,090–4,100; Intra resistances: 4,175–4,200, then 4,240–4,260.
4) Scenario Map (next 1–2 weeks)
Scenario Catalyst / Sign Market Reaction Gold Plan
Bull Base Case Easing-friendly data; calm USD; steady risk-off tone Grind higher into 4,200 → 4,300 Buy dips 4,090–4,120; trail below 4,050
Bull Acceleration Dovish Fed signaling / softer inflation, risk flare-ups Break & close > 4,200, momentum to 4,300–4,400 Breakout long on daily/15-min close >4,200; add through 4,240
Sideways/Mean Revert Mixed data; USD stabilizes; profit-taking Chop 4,050–4,200 range Range trade: buy 4,070–4,100, fade 4,190–4,210 with tight stops
Bear Risk (tactical) Hawkish surprise / strong USD / hot inflation Flush to 4,000–4,020; if breaks, 3,950 Stand aside into the flush; reload longs on reclaim of 4,050/4,100 or buy 3,950 with reversal signal
5) Trade Plans (levels are live-action guides)
A) Swing – Buy the Dip (core idea)
Entry: 4,090–4,120 (staggered)
Invalidation: Daily close < 4,050
Targets: 4,180 / 4,220; runners 4,300
Notes: Use half size first; add only on strength back above the 4,150 pivot.
B) Breakout – Continuation
Trigger: 15–60min close > 4,200 with expanding volume / breadth
Stop: 4,160–4,170 (below breakout)
Targets: 4,260 / 4,300 / 4,360
Tactics: Trail stop under rising 20-EMA (H1).
C) Tactical Short – Reversion
Setup: Rejection wicks at 4,190–4,210 or parabolic spike >4,240 without breadth
Stop: Above the rejection high (tight)
Targets: 4,150 / 4,120; stretch 4,080
Note: Counter-trend. Keep size small and take profits fast.
Risk & Sizing
Keep risk 1–2% per idea.
ATR-adjust stops; don’t widen stops—cut size instead.
Avoid stacking correlated risk; use time-stops if catalysts disappoint.
6) What Would Change My View?
Bearish shift: A sustained daily close below $4,000, or a sharp rebound in real yields + USD with hawkish Fed tone.
Bullish extension: A clean weekly close > $4,200 with improving breadth; that unlocks 4,300–4,400 roadmap.

Trading GBPUSD | Judas Swing Strategy 15/10/2025This week’s FX:GBPUSD setup was another textbook example of how patience and discipline can turn a high-probability setup into gains. We marked out our range highs and lows, the key zones we monitor for potential manipulation going into New York open.
As Judas Swing session kicked off, price swept below the low of the zone, taking out resting liquidity. This was our first major clue. The Judas Swing strategy looks for these liquidity sweeps before positioning in the opposite direction of the trap.
Once that downside sweep occurred at 9:25EST, our focus shifted to potential long opportunities. We patiently waited for confirmation, specifically a break of structure to the upside before considering any entry. When that break came, all that was left was a retracement into the fair value gap (FVG) formed during the impulsive move up. Price retraced and filled the imbalance, and that’s where we executed our long after the candle closed. Risk was set at 1%, targeting a 2% return.
This entry could be considered a sniper entry because price barely moved against us. Within minutes, price began to rally, confirming the Judas reversal and validating our entry. Price continued climbing and reached our take-profit in less than an hour. The result was a +2R winner while maintaining disciplined risk management.
The Judas Swing strategy thrives on patience and structure. Wait for liquidity sweeps, confirm the break, and execute only when price revisits your FVG. You won’t catch every move, but you’ll catch the right ones and that’s what leads to consistency.

Gold Holding Strong Above $4,100 — Bulls Eye $4,300 Next🌍 Market Update & Key Drivers
Gold is holding above $4,100/oz, after a strong run.
Safe-haven demand is still a major driver given global uncertainties (trade tensions, risk in U.S. fiscal policy).
The U.S. dollar remains soft, which is favorable for gold.
Fed rate-cut expectations are still elevated; major central banks and ETFs continue to accumulate gold positions.
Some caution emerges: central banks and institutional funds may take partial profits, leading to short-term volatility.
📈 Technical Structure & Levels
Support Zones
First: ~$4,100
Then: ~$4,050
Deeper: ~$4,000
Resistance / Target Zones
$4,200 → $4,300
If momentum is strong: $4,400+
The trend is strongly bullish, but momentum indicators suggest overextension. A cooling-off or sideways phase is possible before new highs.
🎯 Bias & Trade Strategy
Directional Bias: Bullish overall, but expect short-term consolidation.
Trade ideas:
Buy on dips into recent support zones (e.g. $4,050–$4,100).
Breakout trade: If gold convincingly breaks above $4,200 with strong volume, engage for a move to $4,300+.
Scalp / Short pullback: If you see reversal signals near recent highs, play short-term moves back to support.
Key risk factors include: hawkish surprises from the Fed, USD strength, or large profit-taking at extremes.
