XAUUSD (M30) – Trading just under the top...XAUUSD (M30) – Trading just under the top ⚡️ Weekly plan using Volume Profile + Liquidity (Liam)
Quick summary:
Gold has just delivered a strong impulsive push and is now consolidating right beneath the highs, which is classic “compression” behaviour before the next expansion. With macro conditions still sensitive (USD, yields, Fed expectations + geopolitical headlines), the best approach this week is don’t chase — trade liquidity zones and value areas (POC/VAL) instead.
1) Macro context (why price behaves like this)
When headlines are heavy, gold often moves in two phases:
run to buyside liquidity → pull back to value → then decide whether to trend or range.
That’s why this week I’m focused on:
selling reactions in premium, and
buying dips into value (POC/VAL)
rather than buying mid-range candles.
2) What Volume Profile is showing on your chart
Your M30 chart highlights the key “money zones” very clearly:
🔴 SELL Liquidity (premium reaction)
4577 – 4579: a sell-liquidity / reaction area (good for scalp or short swing if rejection prints).
🟢 BUY Liquidity (shallow pullback)
4552 – 4555: the clean pullback zone to stay aligned with the bullish structure.
🟦 POC zones (value – where the market does the most business)
Buy POC 4505 – 4508: a major value magnet; price often revisits this area.
Buy POC 4474 – 4477: deeper value / reset zone if we get a sharper liquidity sweep.
➡️ Simple VP logic: POC = price magnet. When price is in premium, the probability of a rotation back into value is always on the table.
3) Trading scenarios for the week (Liam style: trade the level)
✅ Scenario A (priority): BUY the pullback into 4552–4555
Buy: 4552 – 4555
SL: below 4546
TP1: 4577 – 4579
TP2: continuation towards the highs if we break and hold above 4580 cleanly
Best “trend-following” entry if the pullback stays shallow.
✅ Scenario B (best VP entry): BUY at POC 4505–4508
Buy: 4505 – 4508
SL: below 4495
TP: 4552 → 4577 → higher if momentum returns
If the market runs liquidity and drops back into value, this is the area I want most.
✅ Scenario C (deep sweep): BUY POC 4474–4477
Buy: 4474 – 4477
SL: below 4462
TP: 4505 → 4552 → 4577
This is the “panic wick” setup — not frequent, but high quality when it appears.
⚠️ Scenario D (scalp): SELL reaction at 4577–4579
Sell (scalp): 4577 – 4579 (only with a clear rejection/weak close)
SL: above 4586
TP: 4560 → 4552
This is a short-term reaction sell, not a long-term bearish call while structure remains supported.
4) Execution checklist (to avoid getting swept)
No entries in the middle of the range — only at the zones.
Wait for M15–M30 confirmation: rejection / engulf / MSS.
Scale out in layers — highs often deliver fast up-sweeps and sharp pullbacks.
If I had to pick one “clean” setup this week: BUY the 4552–4555 pullback, and if we get a deeper reset, I’ll be waiting at POC 4505–4508.
xauusd gold tradingplan volumeprofile poc liquidity priceaction marketstructure intraday swingtrading
Ictstudent

XAUUSD – H1 Technical Analysis | Lana XAUUSD – H1 Technical Analysis | Lana ✨
Gold remains in a strong bullish structure, and the current price action is best understood as a healthy pullback within an uptrend, not a reversal.
📈 Market Structure & Trendline
Price continues to respect the ascending trendline, confirming higher highs and higher lows.
The impulsive leg at the start of the week created a clear liquidity imbalance, which is now acting as a key demand zone.
As long as price holds above this structure, the bullish bias stays intact.
🔢 Fibonacci Confluence
Using Fibonacci on the latest impulsive move:
0.618 – 0.5 retracement zone aligns perfectly with the current consolidation.
This confluence strengthens the idea that the market is rebalancing before continuation, rather than distributing.
🟢 Key Buy Zones (Preferred)
4510 – 4520
Liquidity imbalance + trendline support
→ Ideal zone to wait for bullish confirmation
This zone represents value, where smart money typically looks to re-enter the trend.
🔴 Resistance & Reaction Zone
4635 – 4637 (Fibonacci extension 2.618)
→ Strong resistance and profit-taking area
→ Possible short-term sell reaction, not a confirmed reversal
Avoid chasing buys near this zone without a clear breakout and acceptance.
🧠 Trading Scenario
Base case: Price pulls back into the buy zone (4510–4520), reacts, and continues higher following the trendline.
Alternative: Deeper pullback but structure remains bullish as long as trendline holds.
Invalidation: A clean break and acceptance below the trendline would signal a deeper correction.
✨ Lana’s Notes
Trend is your friend — but entries matter more than bias.
Buy value, sell reactions.
Let Fibonacci, structure, and trendline do the heavy lifting.
No FOMO, no chasing.
Trade the structure. Respect the trend. React, don’t predict. 💛

Minor plus major IDMIn this diagram I have briefly explained the difference between minor inducement and major inducement how to use them with proper structure mapping and alignment of all other necessary elements which comes into ICT that how we gonna use the inducement model on the basis of minor swing hunt and major swing hunt

EUR/USD trade ideaYesterday’s trade is still open so this is an added smaller positions but the DOL is the same. Last trade of the week.

EUR/USD trade ideaHigh Time Frame draw is the same. Trading with caution today but the setup seems good. Looking for last week daily lows.

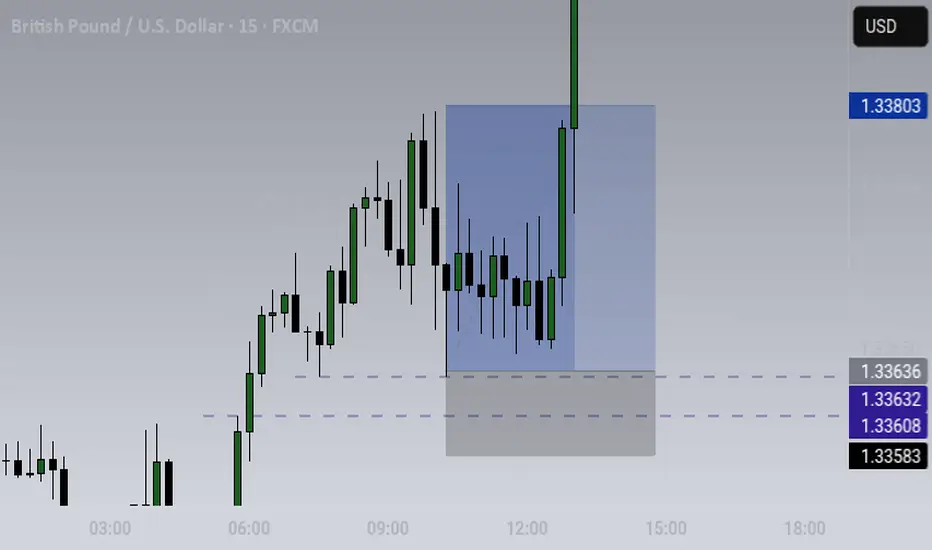
GBP/USD trade idea 21/10/25HTF bias is bearish, after reaching a premium on the H1 + SIBI created during asia, i would like to see this BISI act like an inversion FVG, draw on liquidity are the previous days swing lows.
This trade must be closely monitered as tomorrow is CPI for pound.

CABLE M15Beautiful delivery. Intraday Order Flow. The IR worked in the favour of the trade. Still bullish, will see how it reacts at the next Daily FVG
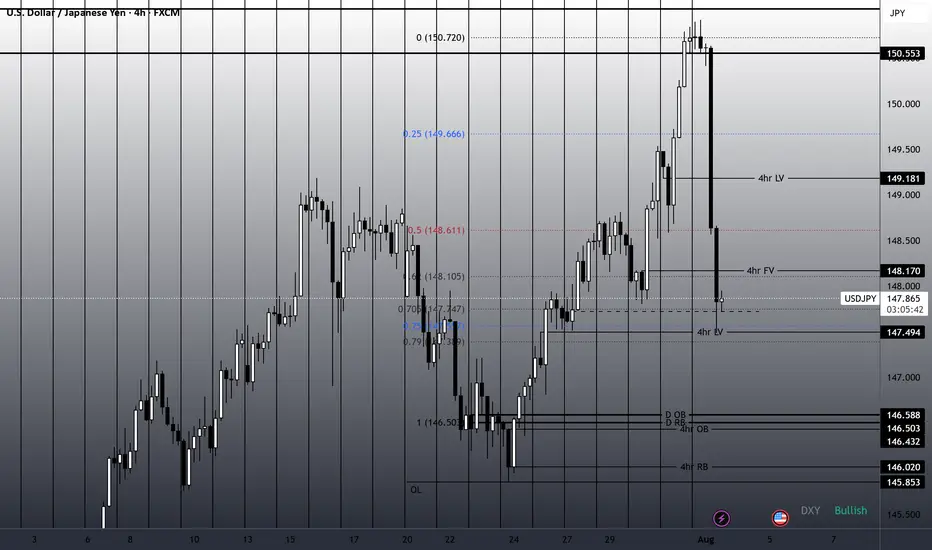
304-PIP Move on USDJPY in One Day - Trading NFP ProfitablyOn August 1st, USDJPY experienced a massive 304-pip drop after a strong impulse into the daily order block. From there, the daily order block was respected, and the retracement was induced by the USD Non-Farm Payrolls news release, leading to a sharp move down to a four-hour liquidity void, hitting the 75% Fibonacci retracement level.
This move highlights the precision of combining institutional levels with news catalysts, capturing a significant move in a short timeframe.
This is Outlier Trading Folks.
Today is the dayI found a "reaper" block today.
Were Bullish.
The Rejection block is measured from High to Low.
Tp to 1 Standard deviation.
Price knocks out buyers back into reaper FVG.
Price enters zone on top of a 1hr Orderblock at 10am.
A reaper is a Fair value gap in a discount of the impulsive price leg of a bullish breaker along with a Bias.
Bearish or bullish? Analysis:
Daily outlook:
- if market moves to to the daily key level, and make a short term bounce or sweep
will take longs setups
- if market moves sharply through the Daily key level, will look for short setups

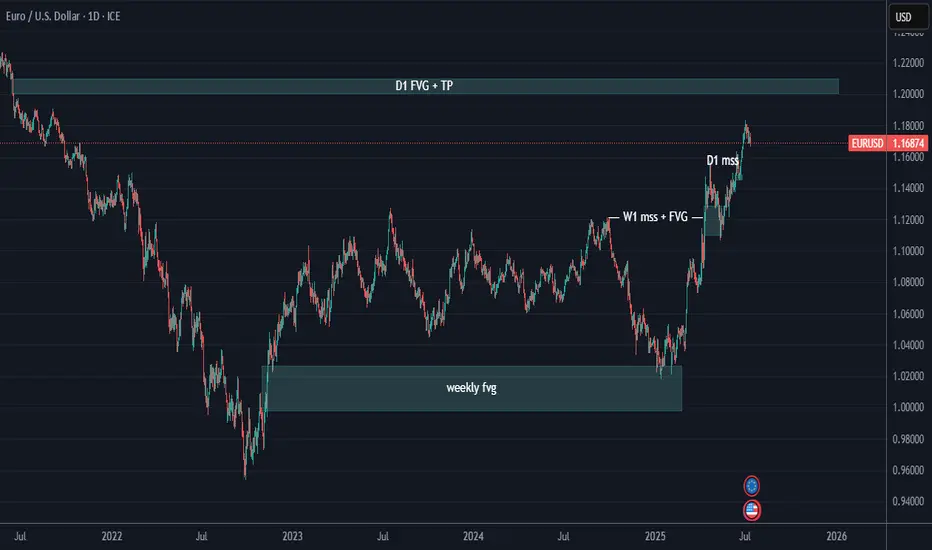
HTF analysis for EurUsdFollowing simple Ict concepts, we can see that EU has respected the higher time frames PD array.
Following the trend as price seems to be "drawn" to premium towards the D1 FVG area.
we can expect to see price fill that PD array around the 1.20800 area
WHAT A LOVELY BULLISSH GAP ON AMAZON: A 4RR PROFIT TRADE CLOSEDI just closed this beautiful 4RR trade on Amazon.
The trade was entered last week, this new week market open Gap pushed the price high to my 4RR target.
Trade Idea;
The monthly is extremely bullish.
The weekly is also bullish.
Daily is bullish as well, so i entered on the daily time frame pull back swing low.
Result?
A beautiful 4RR profits trade.
Next Action?
I will wait till the daily frame correct and form a swing low before entering for a bullish trend continuation buy.

Bullish till March 26 High but open for retrace.We are at a daily -BPR at the moment. All daily candles have been bullish so far since April 22. The whole sentiment behind this has been the 90 day tariff pause.
There definitely is a mix of fundamental and technical reasons for both bullish and bearish bias once we achieve this target.
For this week, I would look for a long entry only if NQ retraces lower first. Otherwise would have to just watch it do its thing. Once we hit the March 26 High, I am very open for NQ to go to All time high again because that is what it historically does but I am also completely open for it to start dumping to monthly lows because it seems that the sell-side was not hit and the higher lows made on the 4H chart seem to be very low resistance targets.
Not a good time to marry a bias.

Looking to short CL to continue lowerCL is making a corrective move higher before moving down to the ultimate target of last Daily structure leg down. It retraced to Daily bearish Fair Value Gaps (internal range liquidity zones) which should act as resistance. 15M bearish structure is in Extreme premium.
I'm looking for CL to break down bullish corrective structure on 5M chart and start a final move down.

Entry Psychology Hey guys, Ray here, and I just entered a trade here.
Doesn't matter buy or sell,
or what currency your trading.
We all enter the market and none of us can ever know the "perfect price".
Therefore, our Stop Loss is inadvertently a key factor in our entries, lot sizes, and psychology.
In this video I explain what I mean...
Please comment if you found this insightful!

USDJPY Long SetupUSDJPY Looks Bullish, Previous Day Candle Has closed above Friday Candle and we still have a LTH not taken i think today we will be bullish we might have a correction drop down to 0.25 or 0.5 of the previous day and continue higher

Quick 70 point scalp on NQShowing you guys a trade idea with my current thoughts on the market and price.
I will be busy today so that is all for me, taking my $370 dollars for the day and I am calling it.
Good luck and Good trading to anyone trading today!
Forex, Crypto and Futures Trading Risk Disclosure:
The National Futures Association (NFA) and Commodity Futures Trading Commission (CFTC), the regulatory agencies for the forex and futures markets in the United States, require that customers be informed about potential risks in trading these markets. If you do not fully understand the risks, please seek advice from an independent financial advisor before engaging in trading.
Trading forex and futures on margin carries a high level of risk and may not be suitable for all investors. The high degree of leverage can work against you as well as for you. Before deciding to trade, you should carefully consider your investment objectives, level of experience, and risk appetite.
There is a possibility of losing some or all of your initial investment, and therefore, you should not invest money that you cannot afford to lose. Be aware of the risks associated with leveraged trading and seek professional advice if necessary.
BDRipTrades Market Opinions (also applies to BDelCiel and Aligned & Wealthy LLC):
Any opinions, news, research, analysis, prices, or other information contained in my content (including live streams, videos, and posts) are provided as general market commentary only and do not constitute investment advice. BDRipTrades, BDelCiel, and Aligned & Wealthy LLC will not accept liability for any loss or damage, including but not limited to, any loss of profit, which may arise directly or indirectly from the use of or reliance on such information.
Accuracy of Information: The content I provide is subject to change at any time without notice and is intended solely for educational and informational purposes. While I strive for accuracy, I do not guarantee the completeness or reliability of any information. I am not responsible for any losses incurred due to reliance on any information shared through my platforms.
Government-Required Risk Disclaimer and Disclosure Statement:
CFTC RULE 4.41 - HYPOTHETICAL OR SIMULATED PERFORMANCE RESULTS HAVE CERTAIN LIMITATIONS. UNLIKE AN ACTUAL PERFORMANCE RECORD, SIMULATED RESULTS DO NOT REPRESENT ACTUAL TRADING. ALSO, SINCE THE TRADES HAVE NOT BEEN EXECUTED, THE RESULTS MAY HAVE UNDER-OR-OVER COMPENSATED FOR THE IMPACT, IF ANY, OF CERTAIN MARKET FACTORS, SUCH AS LACK OF LIQUIDITY. SIMULATED TRADING PROGRAMS IN GENERAL ARE ALSO SUBJECT TO THE FACT THAT THEY ARE DESIGNED WITH THE BENEFIT OF HINDSIGHT. NO REPRESENTATION IS BEING MADE THAT ANY ACCOUNT WILL OR IS LIKELY TO ACHIEVE PROFIT OR LOSSES SIMILAR TO THOSE SHOWN.
Performance results discussed in my content are hypothetical and subject to limitations. There are frequently sharp differences between hypothetical performance results and the actual results subsequently achieved by any particular trading strategy. One of the limitations of hypothetical trading results is that they do not account for real-world financial risk.
Furthermore, past performance of any trading system or strategy does not guarantee future results.
General Trading Disclaimer:
Trading in futures, forex, and other leveraged products involves substantial risk and is not appropriate for all investors.
Do not trade with money you cannot afford to lose.
I do not provide buy/sell signals, financial advice, or investment recommendations.
Any decisions you make based on my content are solely your responsibility.
By engaging with my content, including live streams, videos, educational materials, and any communication through my platforms, you acknowledge and accept that all trading decisions you make are at your own risk. BDRipTrades, BDelCiel, and Aligned & Wealthy LLC cannot and will not be held responsible for any trading losses you may incur.

Possible NQ Bounce Starting Monday 3/10/25Monday and the rest of the coming week could be the start of the NQ making a bounce. If not, it's look out below with a break of 20,000 going to 19,000 rather quickly. Price will dictate how we go but a good bounce is not out of the question. Watch the video for more details.
Feel free to leave your comments.
Thanks for watching.

$BTC - Bottom In, Time To BuyHello Friends,
For those of you looking to capitalize on Bitcoin BITSTAMP:BTCUSD you may want to add to your position, or start accumulating for the first time.
I posted 2 days ago saying to wait for $85,000 USD on CRYPTOCAP:BTC
As well back in December 4, 2024 I posted my ideal entry would be $85,000.
We now have our confirmation to Buy/Long

Bullish on NQ on 4H chart going into Fed meetingBias : Bullish Bias.
Looking at retracement before entry to take a long position . Would expect the fair value gap to be run through and eventually to 22,000 level as there are stack liquidity. rather very bullish for the next coming few weeks

S&P500 Weakness in 15 Min TimeframeHi Fellow traders
I'll be starting my regular post of my bias of the market. Using Futures market as a indication of potential strength and weakness of the market.
Bias will be shorter bearish on S&P as you can see from the comparison of Nasdaq VS S&P that S&P is failing to break higher higher forming a bearish SMT. As overall longer term trend 1H and 4H is still bullish. We will be playing a retracement leg.
Specifically shorting S&P > Nasdaq.
My prediction would be that market will open lower.

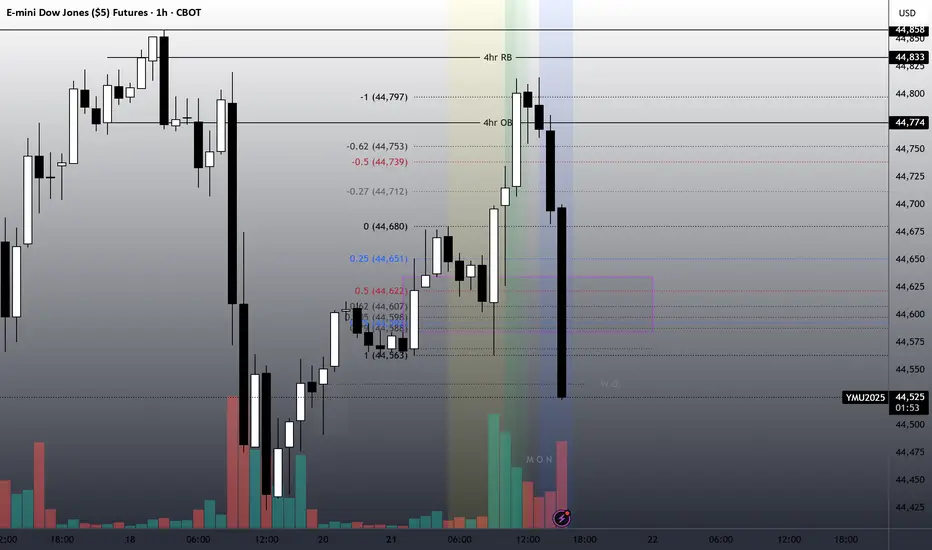
I guess weekly opening gaps are tradeable! Yesterday on our weekly call, I had no idea how to approach trading down to fill this Liquidity Void.
This morning, its fascinating but no surprise we see price action;
trade lower to create that break in market structure,
Come back the the 4hr Order block (OB),
to reject and see the trade come to fruition.
