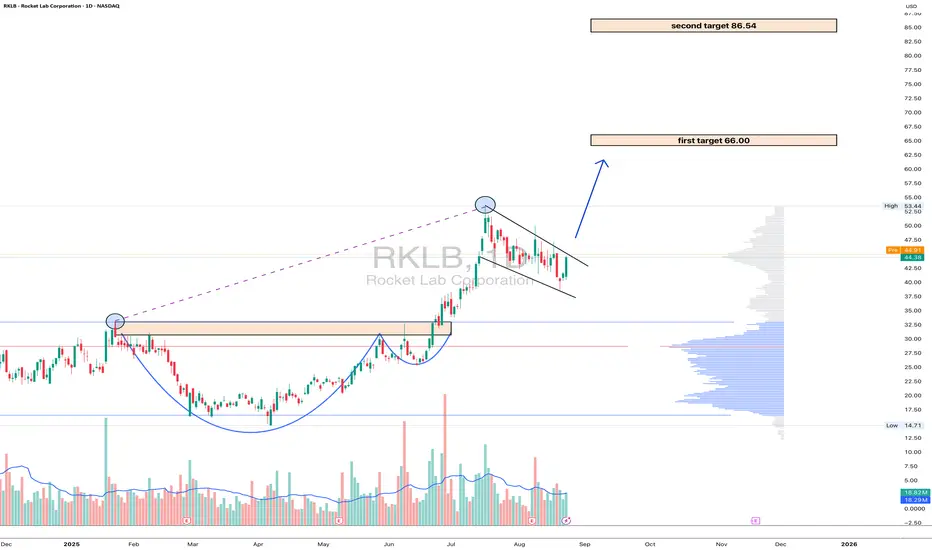
RKLB: the rocket is fueled and ready for orbitOn the daily chart of Rocket Lab (RKLB) , the price is trading at $44.38 after a confident breakout above key consolidation zones. Technically , the break of the $40 level confirmed the strength of the bulls and solidified the upward structure. The next target is $66 - a strong resistance aligned with the Fibo extension and if momentum holds, the market could extend toward $86.54, where long-term levels converge. EMA indicators remain below the price, reinforcing the bullish outlook.
Fundamentally , Rocket Lab stands as a leader in the small-launch vehicle sector, strengthened by contracts with NASA and consistent commercial demand. Amid growing interest in the aerospace industry and rising competition with SpaceX, the company benefits from diversified revenue streams and steady launch schedules. On the geopolitical side, increased defense programs in the U.S. and allied nations provide additional long-term support.
Tactically , the zone above $40 now acts as a support: as long as price holds above it, the bullish scenario remains intact. Targets are set at $66 and $86.54. Short-term corrections are possible if the market overheats, but the broader structure points upward, with institutional flows suggesting accumulation.
If this scenario plays out, Rocket Lab won’t just launch satellites - it’ll launch portfolios into orbit.
IDEA
EURCHF Bullish Wait for a bullish confirmation around the FVG zone (0.9335–0.9340) or the OB This could include:
A bullish candle formation like a bullish engulfing candle or a pin bar.
A break of structure: Look for a shift from lower lows and lower highs to higher highs and higher lows, which signals the market is starting to form an uptrend.
Order block confirmation: If the price moves into the yellow order block (OB) and reacts with bullish price action, that can be another signal to go long.

LZ 1D: Legal move to the upside?On the daily chart, LegalZoom broke out of a falling wedge and perfectly retested the breakout area - almost textbook stuff. The buy zone around 9.25–9.89 aligns with the 0.5–0.618 Fibonacci retracement and previous volume cluster, giving the setup extra strength.
With both MA50 and MA200 below the price, momentum stays bullish. The first technical target lies near $15.33, with potential extension toward $20+ if broader sentiment remains supportive.
From a fundamental view, LegalZoom benefits from renewed demand for digital legal services and cost optimization. Not a bad combo - solid technicals plus improving business dynamics.
So yes, bulls have the gavel now - let’s just hope the verdict is in their favor

GME 1W: when the memes fade, the structure speaksGameStop is once again testing the lower boundary of its long-term consolidation, bouncing off the 21.53 zone - a level that aligns with the 0.79 Fib retracement and historical support. This zone also intersects with a key trendline on the weekly chart, and just recently, a golden cross (MA50 crossing MA200 weekly) printed - a rare but technically significant signal. The stock continues to trade inside a broad descending channel, and if this support holds, the natural next step is a move back toward the mid-range at 37.42 (0.5 Fib), followed by a possible push toward 64.92. The tactical setup favors a confirmation entry near current levels, with a stop under 21.00. Risk/reward here is among the cleanest GME has offered in months.
On the fundamental side, GameStop remains in a transitional phase. The company is shutting down unprofitable segments, reducing costs, and doubling down on e-commerce and digital distribution. Financial results are still slow to recover, but the latest Q2 2025 report showed positive operating cash flow and narrowing losses. This isn't a value play in the traditional sense - it's more about the potential for renewed retail-driven momentum if technical conditions align.
If there’s still power behind the crowd - this might be one of the most technically compelling entry zones of 2025.

JD 1D: Bulls taking the lead?On the daily chart, JD.com broke out of a falling wedge, moving above both MA50 and MA200. That’s a strong technical signal hinting at a potential mid-term trend reversal.
Upside targets are mapped at $39.8 and $46, with Fibonacci levels suggesting a possible extension toward $52 if momentum holds. Support remains around $33–35, and as long as the price stays above it, buyers are in control.
From a fundamental perspective, JD continues to reshape its business, expand online services, and benefit from China’s economic recovery. Competition with Pinduoduo and Alibaba is tough, but technically bulls seem to have the upper hand.
Tactical outlook: watch the MA200 - staying above it keeps the growth scenario intact.

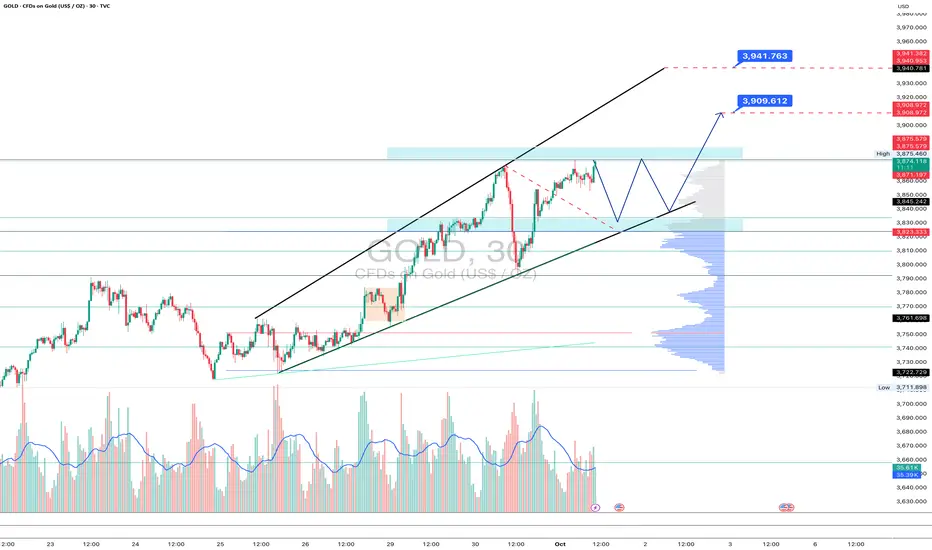
Gold is preparing a pause before a new breakthroughOn the 30-minute chart, gold remains inside the ascending channel but is showing local signs of overheating: price hit resistance around 3875 and pulled back.
The technical setup suggests a correction towards the channel support and the 0.5–0.618 Fibo zone (3833–3823), where buyers are expected to step in. If support holds, the bullish trend may resume with targets at 3909 and 3941.
Volume indicates selling pressure at highs, but the overall trend remains intact - moving averages are pointing upward, and the higher-high structure is still valid.
Tactical plan: watch how the 3833–3823 zone reacts; if buyers confirm control, gold has room for another strong push.
And if bulls rush without giving a pullback - that’s the classic “market never waits for your comfy chair” scenario.
GBPJPY 2H, TRADE IDEA FOR 30, SEPT 2025.Price successfully broke through the previous day's low and also swept the asian low range and structure, which forms my BIAS for the day bearish as price currently broke a structure, will it hold? as price moves further down to find a next balance.
As usual, my calls or analysis are based on what we see, the current Bias, and from a probability standpoint, meaning that this projection may be or may not be validated, so tread carefully, and as usual, this is not financial advice, trade responsibly

BABA: triangle with tensionOn the weekly chart, BABA has already formed a golden cross - price is above both MA50 and MA200, confirming a bullish trend shift. The stock is now approaching the upper edge of the symmetrical triangle and the key resistance at $122, which also aligns with the 0.5 Fibonacci level.
The numbers inside the triangle represent the contraction phases, not Elliott waves. This is a classical consolidation before a potential breakout. If the $122 level is broken and retested, upside targets are $128 (0.618), $137 (0.786), and eventually $148–181 (1.0–1.618 extension).
Volume is rising, MACD is flipping bullish, and RSI is climbing out of oversold territory — all signs point to growing bullish momentum.
Fundamentally, Alibaba benefits from China's economic rebound, possible regulatory relief, and ongoing share buybacks. With Chinese tech rotating back into favor, BABA could lead the rally.
So if you're still waiting for a signal - it's already here. The golden cross is done, price is flying above moving averages, and all that’s left is a clean breakout. Watch $122 — that’s the launchpad.

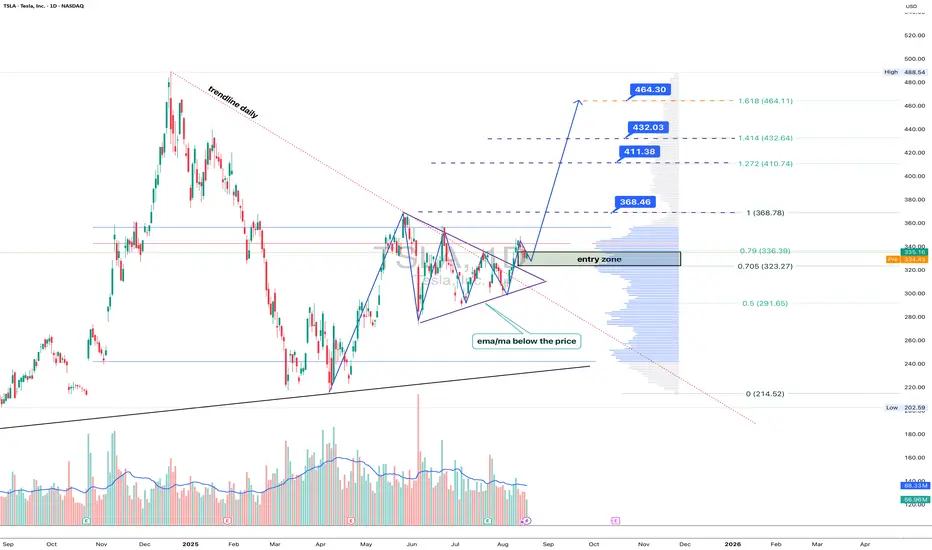
Tesla: breakout mode, Elon’s rocket fuel for the chartTechnically , Tesla broke out of a symmetrical triangle while holding above EMA/MA supports, which confirms bullish control. The breakout unlocks targets at 368.46 (Fibo 1), followed by 411.38, 432.03, and the 1.618 extension at 464.30. Volume profile confirms strong accumulation below, leaving the upside path less crowded.
Fundamentally , Tesla keeps investor attention alive. EV sales stabilized, but the focus has shifted to AI and robotaxi — Musk’s latest promises of disruption. With Fed rates peaking and yields easing, growth stocks regain momentum. Risks remain from Chinese competitors, yet Tesla’s margins are still leading the industry.
Tactical plan : entry zone stands at 323–336. As long as price holds above it, buyers target 368.46 → 411.38 → 464.30. A break below 323 would flip the bias back toward 291.
Bottom line: Tesla’s chart looks ready for lift-off. Musk might be dreaming of Mars, but for now, bulls are happy if he just launches the stock a few hundred dollars higher.
GOLD 1H - flag breakout confirms bullish momentumOn the 1H chart, gold has completed a bullish flag formation and already broken out to the upside. Key retest levels sit at 3748 and 3730, where buyers may confirm control. With EMA50 and EMA200 holding below, structure remains bullish. RSI has cooled off, supporting a potential continuation move.
Fundamentally , dollar weakness and Fed uncertainty sustain safe-haven demand.
Tactical plan: watch for price reaction on a possible retest of 3748–3730, as buyer interest here could launch a push toward 3820–3830.
The breakout has already happened - now gold needs confirmation to extend the rally.

Gold – patience versus greedThe current rise in gold to the 3640–3650 range resembles a protracted consolidation rather than a confident trend. The price remains within the upward channel, but there is a risk of correction accumulating near the current values. Key levels to watch are 3629 and 3618: a break and consolidation below will open the way to 3575, where important support lies. Within the range, the market is behaving nervously – false breaks are becoming commonplace, which increases uncertainty for those who are rushing into positions.
Fundamentally, pressure on gold is being driven by expectations ahead of the Fed meeting and weak dollar statistics: investors remain in “wait-and-see mode.” While the dollar is correcting in a downtrend, gold is receiving support, but without new catalysts, an upward breakout is unlikely. Rather, the market is looking for a balance of forces to determine who will lead - buyers or sellers.
The tactical plan boils down to not playing guessing games. In the event of a decline below 3618, confirmation of the bearish scenario with a target of 3575 will appear. If buyers keep the price above 3640, another attempt to storm the highs is likely. At such moments, it is important not to try to outsmart the market, but to wait until it shows the direction itself.
Sometimes the best trade is simply not to rush.

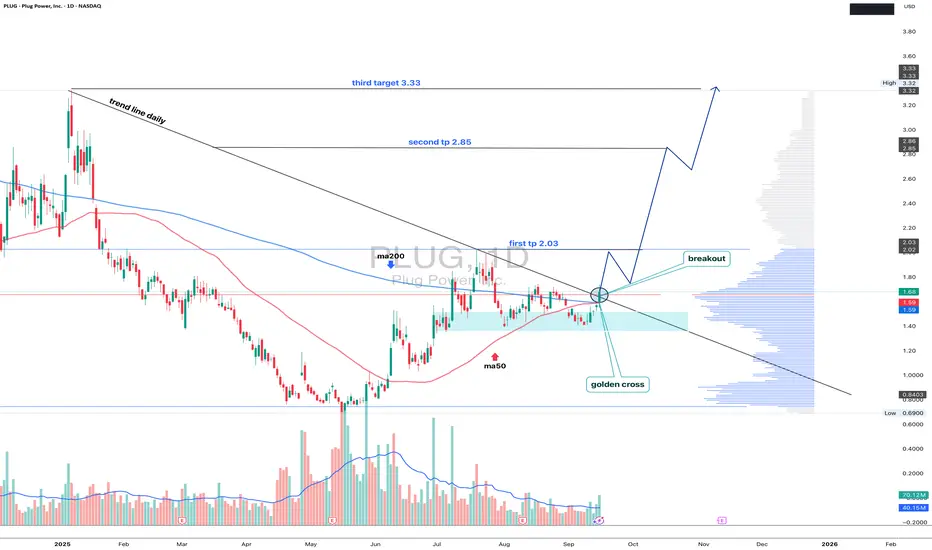
PLUG 1D - powered by a golden crossThe current PLUG chart highlights a key technical shift: the golden cross (MA50 crossing above MA200), usually seen as a potential mid-term reversal signal. Price has broken out of its downtrend structure and is retesting the breakout zone around 1.60–1.68, forming a possible accumulation base. Targets are defined step by step: first at 2.03 (major resistance and Fibo 1), second at 2.85 (Fibo 1.618), and third at 3.33 where strong volume and supply zone meet.
Fundamentally , Plug Power remains a high-risk play: heavy debt, negative cash flows, yet renewed investor attention thanks to green energy incentives.
The tactical view is clear: if the stock holds above 1.68, the road opens toward 2.03, and further breakout may accelerate momentum. A drop back below MA50, however, would invalidate the bullish case.
In short, the market is now deciding whether PLUG becomes a green-energy comeback star or just another unplugged socket.
M-USDT SHORTHello friends 💖
💁♂️ I have chosen a cryptocurrency to put on my watchlist
👉 M-USDT
It may be a good opportunity for a short position
I suggest you have this currency on your watchlist and enter with the structure and trigger at the right place
I think the price of this currency has grown too much and we should wait for a price correction gradually
In any case, I will not enter without seeing the structure and I will not take a short position on this currency
💁♂️ Signs of trend weakness:
The slope of the tops is decreasing
The tops are getting closer
The chart's movement angle is also decreasing and becoming negative
Lower tops are forming
Lower bottoms are forming
⚠️ None of the analysis is a recommendation to buy or sell, but simply my personal opinions on the charts. You can use the charts and choose any that interest you and take a position if you wish.

ETHFI/USDT Analysis – Long Setup
On ETHFI we have a trend break. Below the current price we have several support zones, and we expect buying activity to resume upon testing these levels, targeting a move back to $1.70.
Buy Zones:
• ~$1.555 (initiative volume)
• $1.50–$1.46 (volume zone)
• $1.42–$1.37 (volume zone)
We are waiting for a test of these zones and will consider long positions if a strong reaction occurs.
⚠️ This publication is not financial advice.

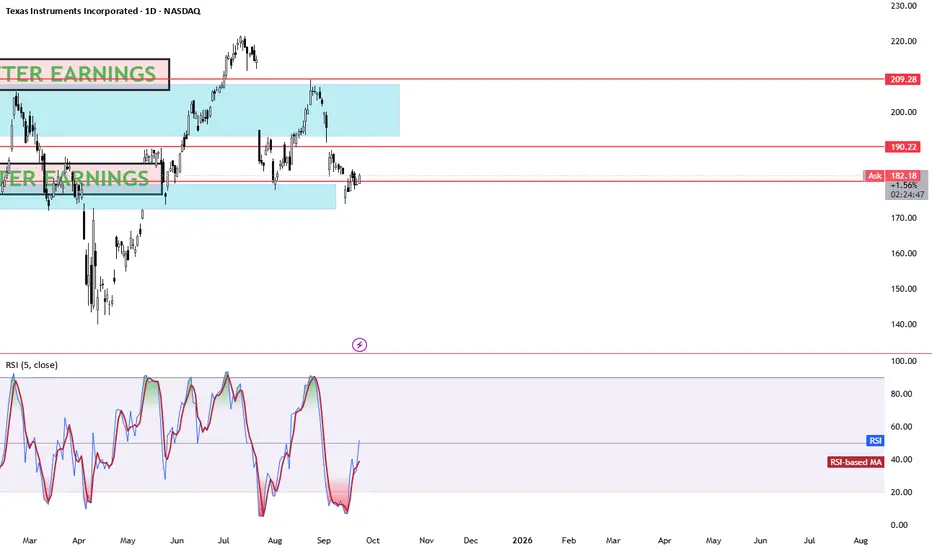
TEXAS INSTRUMENTS BACK TO 200 Why Texas Instruments (TXN) Could Rebound to $200 by 2026: Semiconductor Revival TXN's trading at ~$182 today (Sep 23, 2025), down ~20% from its $230 peak amid industrial softness and China tariffs, but with EPS surging 20%+ and analog demand roaring back, $200 (10% upside) is a slam-dunk floor by EOY 2026. Here's the bull reload:Revenue Ramp & Analog Dominance: Q2 '25 revenue +16% YoY to $4.4B, with industrial up 9% sequentially. Analysts eye $17.5B in '26 (9% YoY growth from $16B '25), fueled by 300mm wafer ramps and auto/enterprise recovery—hitting 50%+ gross margins for $200 valuation at 25x sales.
3 sources
EPS Explosion: Consensus EPS jumps to $6.44 in '26 (20% from $5.35 '25), undervalued at 28x forward P/E vs. 35x historical avg. At norm multiple, that's $226—clearing $200 easy, per WallStreetZen's $208.67 base case.
2 sources
CapEx Efficiency & Cash Flow Surge: $5B '25 spend drops to $2-5B '26 on optimized 1.2x capex/revenue, unlocking $8-12B free cash flow. Dividend hiked 4% to $1.42/share, with buybacks hedging volatility—StockScan's $248 avg '26 seals the rebound.
3 sources
Analyst Consensus Over $200: 25-51 firms avg $212-218 PT (Buy rating, high $298), with TipRanks at $212.83 on AI/data center tailwinds (13% earnings CAGR). Lows $125, but bulls dominate post-Q3 guidance.
EURGBP | POSSIBLE BEARISH INTENT Price never tagged me in on the buy but is reacting very well from the 3HR OB
so now we wait to confirm that change then we can look to join in sells
Watch your charts !!

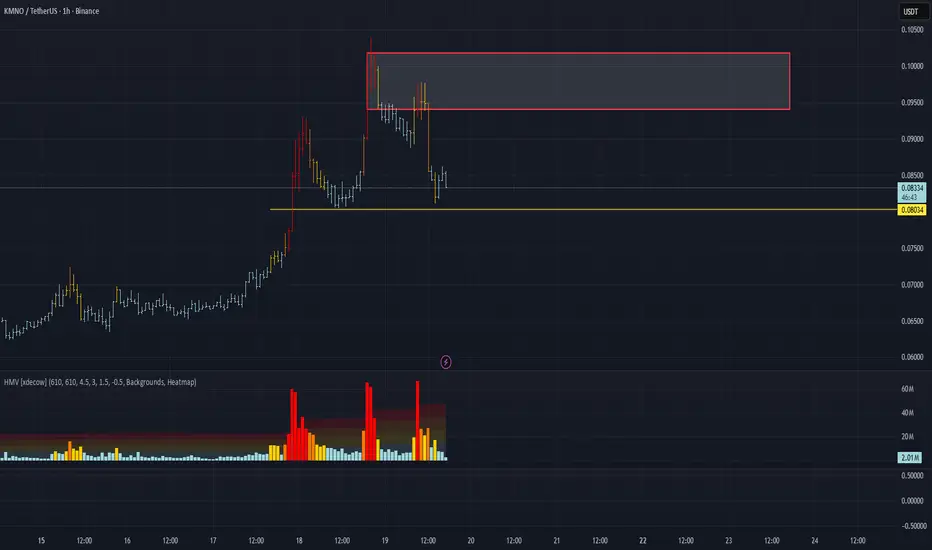
KMNO/USDT Analysis. Short Setup
After a prolonged rally on this asset, we are observing strong buy absorption. A significant volume zone has formed above the current price at $0,094–$0,102 — if price retests this zone and shows a bearish reaction, we consider opening a short position with a first target at $0,077.
This publication is not financial advice.
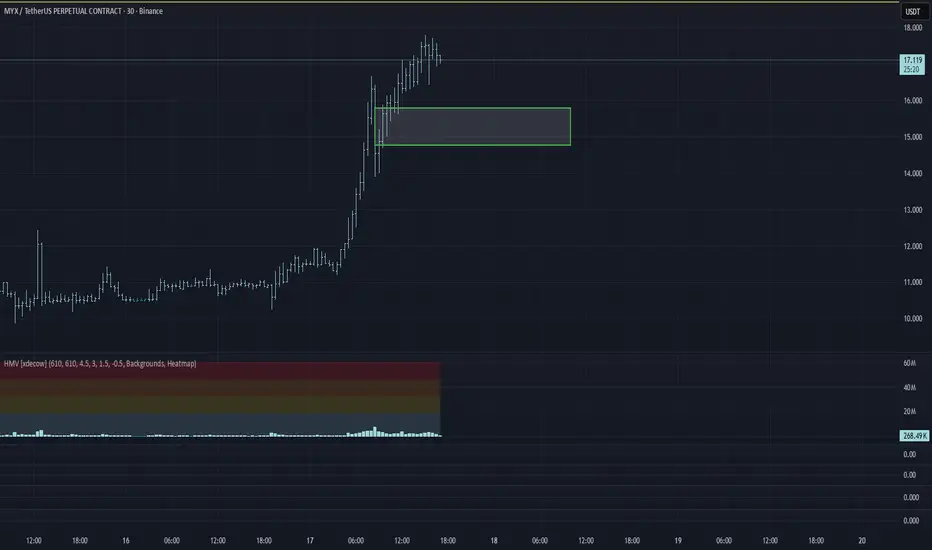
MYX/USDT Analysis. Long Setup
MYX continues to show strong daily momentum. The current high is near, and a strong support zone has formed at $15.8–$14.8.
If this zone is tested and shows a bullish reaction, we can look for a long setup targeting the current high at $18.7.
This publication is not financial advice.
Nike 1W - Just buy it?Nike is showing signs of a reversal after a prolonged downtrend, holding the key buy zone at 69.52, which aligns with the 0.618 Fibo retracement. The breakout of the descending channel adds weight to a structural shift, with the first target seen around 97.63, where the 1.618 Fibo extension and a major resistance zone converge. A successful breakout above this level would open the path toward 125.73, coinciding with the MA200 and a significant volume cluster. While the MA50 still hovers under price, suggesting caution in the short term, the overall structure points toward a bullish scenario.
Fundamentally , Nike remains solid, supported by recovering consumer demand and cost optimization, while its strong brand and institutional interest create a backdrop for sustained growth.
The tactical outlook favors a bullish continuation as long as price holds above the 69.5 zone, with upside targets at 97.6 and 125.7.
If buyers manage to maintain momentum, the market might just rewrite Nike’s slogan: “Just buy it.”

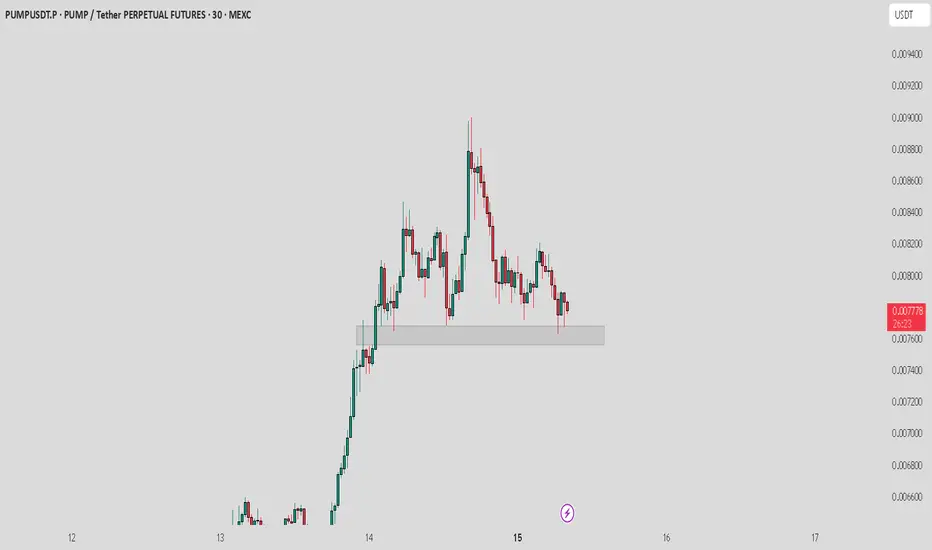
PUMP / USDT : Trading at major support zonePrice is consolidating at a key support zone. Holding this level could trigger a relief bounce, while a breakdown may open room for deeper downside. This zone will decide the next move.
VTI 1D: breakout on the daily within a long-term weekly uptrend On the daily chart, VTI (Vanguard Total Stock Market ETF) has broken through the key $303.5 resistance level with strong volume. This breakout occurs within a larger weekly uptrend channel, highlighting a continuation of the long-term bullish structure.
Volume profile shows a clear path ahead: $321.7 (1.272 Fibo) and $345 (1.618 Fibo). The golden cross (MA50 crossing MA200 from below) further supports the bullish case.
Fundamentally, VTI represents the entire U.S. equity market - large to small caps - and benefits from economic resilience, declining inflation, and passive inflows. It’s a logical macro play for trend continuation.
Tactical plan:
— Entry by market or after retest $303.5
— TP1: $321.7
— TP2: $345
— Invalidation below $300
The whole market breaking out? That’s not noise — it’s the signal.

GRAB 1W: Two Years of Silence — One Loud BreakoutGRAB 1W: When stocks go quiet for two years just to slap bears across both cheeks
The weekly chart of GRAB shows a textbook long-term accumulation. After spending nearly two years in a range between $2.88 and $4.64, the price is finally compressing into a symmetrical triangle. We’ve already seen a breakout of the descending trendline, a bullish retest, and the golden cross between MA50 and MA200. Volume is rising, and the visible profile shows clear demand with little resistance overhead.
The $4.31–$4.64 zone is key. Holding this level opens the path to $5.73 (1.0 Fibo), $6.51 (1.272), and $7.50 (1.618). The structure is clean, momentum is building, and this accumulation doesn’t smell like retail — it smells institutional.
Fundamentally, GRAB is a leading Southeast Asian tech platform combining ride-hailing, delivery, fintech, and financial services. Yes, it’s still unprofitable (–$485M net loss in 2024), but revenue is growing fast, recently crossing $2.3B. Adjusted EBITDA has been improving steadily, and the company holds $5.5B in cash equivalents with minimal debt — giving it excellent liquidity and expansion flexibility.
Valued at ~$18B, GRAB operates in the world’s fastest-growing digital market, with increasing institutional exposure from players like SoftBank and BlackRock. The 2-year base hints at smart money preparing for the next big move.
Tactical plan:
— Entry: by market
— Targets: $5.73 → $6.51 → $7.50
— Stop: below $4.00 or trendline
If a stock sleeps for 2 years and forms a golden cross — it’s not snoring, it’s preparing for liftoff. The only thing left? Don’t blink when it moves.

EURCHF buy setup loooooooooooooooooongHELLO SORRY, for interruption
We have minor downtrend which is broken and caused forming strong demand
this demand zone ,the price respected it and formed sweep then choch and engulfing candle
which indicate uptrend wave
