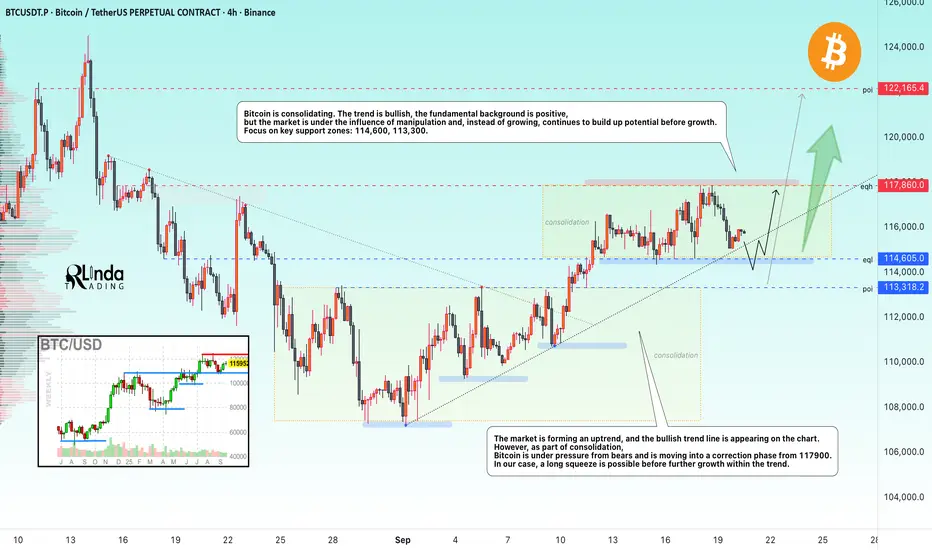
BITCOIN → Manipulation, long squeeze before growth BINANCE:BTCUSDT is in a global bullish trend. The fundamental background, following the start of interest rate cuts, is taking a positive turn, but instead of growth, the market is consolidating...
Bitcoin is showing resilience, trading within the specified trading range (above 114K) amid the Fed's policy easing. For three weeks in a row, growth has been supported by dovish signals from the central bank and growing institutional demand.
Key drivers: The Fed's 25 bps rate cut and forecasts of further easing (to 3.6% by the end of 2025) have strengthened the fundamental backdrop in the cryptocurrency market. Corporate and ETF purchases continue to fuel the bullish trend. Low rates reduce the attractiveness of bonds and increase interest in Bitcoin.
Technically, the market, influenced by manipulation rather than growth, continues to accumulate potential before growth.
Resistance levels: 117860,
Support levels: 114600, 113300
The market is forming an uptrend, with a bullish trend line appearing on the chart. However, as part of consolidation, Bitcoin is under pressure from bears and is moving into a correction phase from 117900. I expect that MM may form a long squeeze in the liquidity zone. That is, a false breakdown of the consolidation support and trend at the same time, and only then return to an upward movement.
Best regards, R. Linda!
Community ideas
ETHUSDTHello Traders! 👋
What are your thoughts on Ethereum?
Ethereum has recently broken above the key resistance area near 4100, printing a new high slightly above the previous peak. After this breakout, price action has entered a corrective phase, suggesting a healthy pullback.
This correction is currently forming a bullish flag pattern, which may act as a continuation setup.
As long as ETH remains above the highlighted support zone, the bullish scenario remains valid. A confirmed breakout from the flag formation could trigger the next impulsive wave, potentially leading to fresh all-time highs.
Keep a close eye on the flag breakout and watch for bullish momentum to resume once the consolidation completes.
Don’t forget to like and share your thoughts in the comments! ❤️

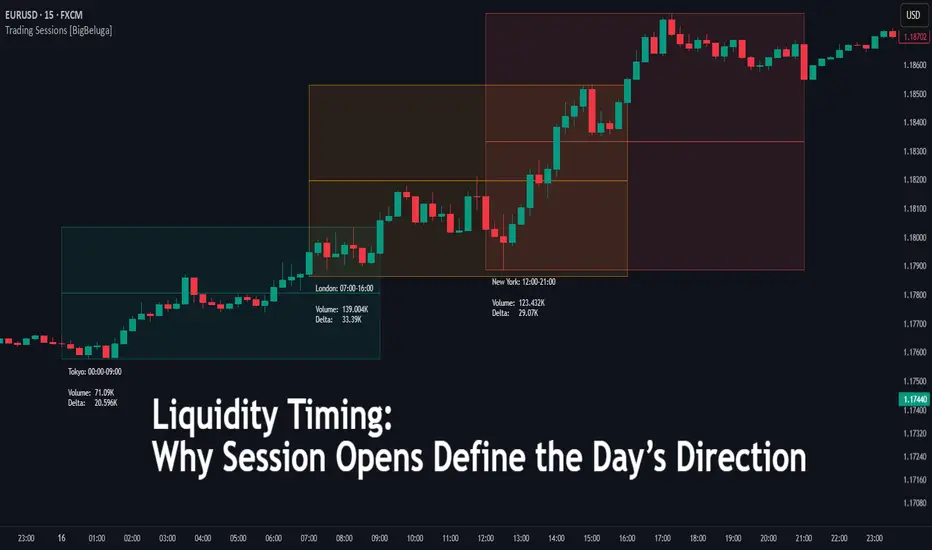
Liquidity Timing: Why Session Opens Define the Day’s Direction🔵 Liquidity Timing: Why Session Opens Define the Day’s Direction
Difficulty: 🐳🐳🐳 - - - (Intermediate)
This article is for traders who want to understand how global trading sessions (Asia, London, and New York) shape intraday price movement. By mastering liquidity timing, you’ll recognize why markets often fake out early, expand mid-session, and reverse into the close.
🔵 INTRODUCTION
Markets aren’t random — they move in rhythm with global liquidity. Every major financial center adds a wave of participation, creating unique price behaviors. The session opens often act as turning points or launchpads for the day’s main move.
Understanding session timing gives traders an edge in anticipating liquidity grabs, expansions, and reversals.
🔵 THE THREE MAJOR SESSIONS
1️⃣ Asia (Tokyo/Sydney) — The Range Builder
Time: ~00:00–06:00 UTC
Behavior: Usually low volatility, narrow ranges, liquidity buildup.
Purpose: Market sets the “box” for later sessions.
2️⃣ London — The Expansion Session
Time: ~07:00–11:00 UTC
Behavior: Breakouts from Asia range, liquidity sweeps, trend acceleration.
Purpose: Injects strong volume and defines directional bias.
3️⃣ New York — The Reversal or Continuation
Time: ~12:00–20:00 UTC
Behavior: Overlaps with London, fuels volatility. Often causes midday reversals or extensions.
Purpose: Final liquidity grab before daily close.
🔵 WHY SESSION OPENS MATTER
Liquidity Injection: New orders flood in as banks and institutions open.
Fakeouts & Sweeps: Early moves often target stops before real direction sets.
Timing = Structure: Knowing when a session opens helps anticipate when ranges will break or reverse.
Key Point: Most intraday trends don’t start randomly — they’re triggered by session transitions.
🔵 HOW TO TRADE SESSION TIMING
1️⃣ Define the Asian Range
Mark the high and low of the Asia session. This acts as a “box” for London to break.
2️⃣ Watch London Open
Often creates a fakeout → sweeps Asia highs/lows → then drives in real direction.
3️⃣ Prepare for New York Shift
NY may extend London’s move or reverse it, depending on liquidity needs.
4️⃣ End-of-Day Fade
Late in the session, volatility fades and price consolidates.
🔵 EXAMPLE SCENARIO
Asia builds a tight 80-pip range overnight.
London open sweeps the range low, trapping sellers.
Price reverses and rallies strongly, breaking above the range high.
New York continues the bullish move but reverses in the afternoon.
🔵 USING THE NEW YORK OPENING RANGE
Of all global sessions, the New York open often brings the sharpest volatility. A simple but powerful way to trade it is by defining the opening range — the high and low formed between 12:00–12:30 UTC on 15min timeframe.
Once this 30-minute range is set, it becomes a reference box for the rest of the session:
A breakout above the range → signals bullish continuation potential
A breakout below the range → signals bearish continuation potential
Failed breakouts often lead to strong reversals back inside the range
This method works because the first 30 minutes of New York capture a flood of institutional orders, setting the tone for the session. Traders can then watch how price interacts with this “opening box” to identify liquidity grabs and true directional moves.
🔵 ADVANCED TIPS
Align session plays with higher timeframe bias (daily trend).
Avoid chasing the first breakout — wait for confirmation after the sweep.
Use liquidity pools (Asia highs/lows) as magnets.
Track economic calendar: London/NY opens often coincide with news.
🔵 CONCLUSION
Liquidity isn’t constant — it comes in waves with each global session. By mapping Asia, London, and New York opens, traders can anticipate where traps, expansions, and reversals are most likely to form.
Session timing turns randomness into structure. If you learn to respect the clock, you’ll stop chasing moves — and start trading with the rhythm of the market.
ETH: Short-Term Trading StrategyETH: Short-Term Trading Strategy
Once again, Ethereum found a strong support zone near 4400.
The price reacted once again for the third time and if ETH respects the previous movements it should rise again to 4600
This is a 60 min setup so it can perform during the weekend.
Targets that I am looking at are near 4445 and 4615
You may find more details in the chart!
Thank you and Good Luck!
❤️PS: Please support with a like or comment if you find this analysis useful for your trading day❤️

Bitcoin Analysis –> The Critical Resistance ZoneHello guys!
Bitcoin (BTCUSDT) has been moving within a well-defined ascending channel since early September, showing consistent higher lows and higher highs. Currently, price action is approaching a major resistance zone (highlighted in blue), around the $118,000 – $119,500 level.
----------Why the Blue Zone is Critical----------
This area has acted as a historical supply zone, where sellers have previously stepped in to push prices lower. It represents a significant hurdle for the bulls, and the next move from here could determine Bitcoin’s medium-term trajectory.
Bullish Scenario (Red Path):
If BTC breaks above the blue resistance area with strong momentum, it could confirm a breakout continuation. In this case, Bitcoin has the potential to test $120,000+ and eventually aim for new all-time highs (ATHs) within the ascending channel structure.
Bearish Scenario (Blue Path):
If the price fails to clear this resistance, a rejection could send BTC back to retest the channel’s lower boundary near $115,000–$114,500. Holding this support would be crucial to maintain the bullish structure. A breakdown from the channel would signal a potential trend reversal.
Key Levels to Watch
Resistance (Blue Zone): $118,000 – $119,500
Immediate Support: $115,000 – $114,500 (channel bottom)
Upside Target (if breakout succeeds): $124,000 – $125,000
Conclusion
The blue resistance zone is the make-or-break level for Bitcoin right now. A successful breakout could be the start of a new bullish leg toward ATH, while rejection here might trigger a healthy correction within the channel. Traders should closely monitor price action in this area before making directional decisions.

Bitcoin - Will the parallel channel hold?Introduction
The Bitcoin market is currently showing an interesting structure that offers both bullish and bearish possibilities. By analyzing the liquidity dynamics, the channel formation, and key areas of interest highlighted on the chart, we can gain a better understanding of the potential scenarios that may play out in the short to medium term. This analysis focuses on the recent liquidity sweep, the behavior within the rising channel, and the critical zones that could act as decision points for price movement.
Liquidity sweep above the highs
Recently, the market performed a liquidity sweep above the previous highs. This type of price action typically occurs when liquidity pools are triggered, trapping breakout traders and providing institutional players with favorable entries in the opposite direction. The sweep has set the stage for the next move, and it becomes crucial to see whether price sustains above this level or rejects it decisively.
Rising channel
Price is currently trading within a rising channel, which often acts as a short-term bullish structure but can also precede reversals if broken to the downside. The channel is providing clear levels of support and resistance, with the midline serving as a short-term equilibrium point. As long as price remains inside this channel, traders should expect oscillations between its boundaries, but any break below it could trigger a stronger move toward lower support zones.
Bearish scenario
In the event that price fails to hold within the channel, the bearish scenario points toward a retest of the lower fair value gap (FVG) around the 113,000 level. This would align with a deeper correction, offering the market a chance to rebalance inefficiencies left behind during the recent bullish rally. A sustained breakdown from the channel could accelerate selling pressure, with liquidity below key lows acting as a magnet for price.
Bullish scenario
On the other hand, if price manages to respect the rising channel and reclaim the liquidity sweep level, the bullish scenario would see a continuation toward the higher 4-hour fair value gap around 119,000–120,000. This area is a major point of interest, as it represents an unfilled imbalance that could attract buyers if momentum continues. Holding above the midline of the channel would strengthen the bullish outlook and could even lead to a retest of previous highs.
Final thoughts
Overall, the market is at a decisive stage where both bullish and bearish outcomes remain valid. The liquidity sweep has created a reaction point, and the rising channel offers a clear framework for monitoring price behavior. Traders should remain flexible and prepared for either outcome, watching closely for confirmations such as a clean break of the channel or a strong reclaim of resistance levels. Ultimately, the reaction around the current structure will determine whether Bitcoin continues higher toward the upper fair value gap or corrects lower into the demand zone below.
-------------------------
Thanks for your support. If you enjoyed this analysis, make sure to follow me so you don't miss the next one. And if you found it helpful, feel free to drop a like 👍 and leave a comment 💬, I’d love to hear your thoughts!

Bitcoin: Easy Monetary Policy Means Buy Pullbacks. Bitcoin has rejected the 118K resistance for now, but with the FOMC behind us and an EASY monetary policy agenda ahead of us, I would be looking for buying opportunities. The current rejection of resistance is confirming the consolidation which may persist for some weeks or months but based on the current environment, there is a greater probability of a bullish break out.
The economic environment plays a key role here. Based on the history of FED rate cuts, the S&P is very likely to be higher over the coming year as a result. This implies short term pullbacks should be viewed as buying opportunities and I believe the same will be for Bitcoin. UNLESS something fundamentally changes. Like the FED changes its policy for some unexpected reason, etc.
This easy monetary policy makes a strong argument against my Wave 1, Wave 4 overlap confirmation event that occurred in Bitcoin when it briefly broke the 108K area. Since the environment favors inflation, the current consolidation developing in Bitcoin can still be the broader wave 4. This implies there is a bullish wave 5 ahead which is in line with Fed policy. The consolidation break can be very similar to how Gold behaves which recently broke out to new all time highs. Keep in mind, I am not one of these "Bitcoin is going to a trillion" Michael Saylor people, I am just interpreting the price structure through a fundamental lens.
So for swing traders and investors: I am looking for any price move back to major support levels like 113K (See chart), 108K or even the 105K area (extreme). Over the short term, pullbacks that seem dramatic can unfold which is why waiting for major levels is key. Upon such a retrace, I will be looking for reversal confirmations like pin bars etc. Also I will use my Trade Scanner Pro to define risk and profit objectives on smaller time frames like the 4H AFTER the predetermined support is reached like 113K.
Thank you for considering my analysis and perspective.

Euro can Bounce From Wedge Support and Rally to 1.1930Hello traders, I want share with you my opinion about Euro. The market for the Euro has transitioned from a clear trending phase into a more complex corrective structure after the prior upward channel failed to sustain its momentum. Following a significant rejection, the price broke down and underwent a deep correction, which was ultimately absorbed by the major 1.1430 - 1.4000 buyer zone. This level served as a critical pivot, halting the decline and initiating the current market phase, which has taken the form of a large upward wedge. The price action for EURUSD has since been contained within this new pattern, rotating between its ascending support and resistance lines. Currently, the asset is at a key inflection point, having completed a corrective swing down to test the ascending support line of this wedge. In my mind, this sets up a long, rotational scenario. I expect that buyers will defend this dynamic support. A confirmed bounce from this support line would validate the integrity of the wedge and signal the start of a new rally towards the upper boundary. Therefore, I have placed my TP at 1.1930, a target that aligns perfectly with the resistance line of the wedge. Please share this idea with your friends and click Boost 🚀
Disclaimer: As part of ThinkMarkets’ Influencer Program, I am sponsored to share and publish their charts in my analysis.

BTC/USDT | BTC Correction Done? Next Pump Loading…By analyzing the Bitcoin chart on the 4-hour timeframe, we can see that the price moved higher as expected, reaching around $118,000. After that, Bitcoin corrected down to the $115,000 demand zone. Once it touched this level, demand stepped in again and the price bounced back.
Currently, Bitcoin is trading around $116,000. If the price holds above the $114,400–$115,000 support zone, we can expect the start of another bullish wave.
Please support me with your likes and comments to motivate me to share more analysis with you and share your opinion about the possible trend of this chart with me !
Best Regards , Arman Shaban

BTC DOMINANCE ALERT! 🚨 BTC DOMINANCE ALERT! 🚨
My chart analysis shows BTC dominance dropping from 58% to a projected 42% / 40%
I’m calling it the "END OF BULL RUN"! 📉
RobottoMACD signals bearish momentum, and our premium indicator, Robotto OG, also gave a clear, precise signal of this dominance drop—proof our tools are on point! 💡
But hold up, declining dominance could spark an ALTPSEASON!
💥 With BTC at $115K and crypto cap at $4T, the bull might rage into Q4 2025!
Watch 50% support, break it, and alts explode! 🚀
What’s your take? Drop it below!

Bitcoin is struggling with 117K Resistance and may dumpAs we can see the chart is clear for the targets like 130K$ but only if the 117K$ resistance zone break to the upside else the market will see some boring range here or even short-term fall first and then near 100K$ support zone again pump will lead to new ATH.
DISCLAIMER: ((trade based on your own decision))
<<press like👍 if you enjoy💚
GOLD 1H CHART ROUTE MAP UPDATE & TRADING PLAN FOR THE WEEKHey Everyone,
Please see our updated 1h chart levels and targets for the coming week.
We are seeing price play between two weighted levels with a gap above at 3692 and a gap below at 3673. We will need to see ema5 cross and lock on either weighted level to determine the next range.
We will see levels tested side by side until one of the weighted levels break and lock to confirm direction for the next range.
We will keep the above in mind when taking buys from dips. Our updated levels and weighted levels will allow us to track the movement down and then catch bounces up.
We will continue to buy dips using our support levels taking 20 to 40 pips. As stated before each of our level structures give 20 to 40 pip bounces, which is enough for a nice entry and exit. If you back test the levels we shared every week for the past 24 months, you can see how effectively they were used to trade with or against short/mid term swings and trends.
The swing range give bigger bounces then our weighted levels that's the difference between weighted levels and swing ranges.
BULLISH TARGET
3692
EMA5 CROSS AND LOCK ABOVE 3692 WILL OPEN THE FOLLOWING BULLISH TARGETS
3717
EMA5 CROSS AND LOCK ABOVE 3717 WILL OPEN THE FOLLOWING BULLISH TARGET
3742
EMA5 CROSS AND LOCK ABOVE 3742 WILL OPEN THE FOLLOWING BULLISH TARGET
3768
BEARISH TARGETS
3673
EMA5 CROSS AND LOCK BELOW 3673 WILL OPEN THE FOLLOWING BEARISH TARGET
3650
EMA5 CROSS AND LOCK BELOW 3650 WILL OPEN THE SWING RANGE
3622
3592
EMA5 CROSS AND LOCK BELOW 3592 WILL OPEN THESECONDARY SWING RANGE
3556
3528
As always, we will keep you all updated with regular updates throughout the week and how we manage the active ideas and setups. Thank you all for your likes, comments and follows, we really appreciate it!
Mr Gold
GoldViewFX

XAUUSDHello Traders! 👋
What are your thoughts on GOLD?
Gold, after its strong recent rally, is now facing the key resistance area around 3700.
Possible Scenarios:
1️⃣ Scenario One (More Likely):
Given that the market is in an overbought zone, a corrective/ranging move toward the lower boundary of the drawn channel and the marked support area is likely. From there, a new bullish wave could begin, eventually leading to a breakout above resistance and a move toward higher targets.
2️⃣ Scenario Two:
Gold makes only a shallow correction, quickly breaks above the resistance zone, and continues its bullish momentum toward higher levels.
Due to the current overbought conditions, Scenario One (correction before continuation) is more probable. However, the overall trend remains bullish as long as key support levels hold.
Don’t forget to like and share your thoughts in the comments! ❤️

Gold Price Reverses - Continues to Surge👋Hello everyone, what do you think about OANDA:XAUUSD ?
Although XAUUSD was impacted by the news of a drop in unemployment claims, the upward momentum continued to perform well on Friday. The price held strong above the $3,630 support zone and pushed the precious metal to new highs, rising by over 400 pips, or approximately 1.12%.
With the current price level, breaking through the immediate resistance could signal the start of the next rally, targeting the $3,700 level and potentially even higher. Previous pullbacks were necessary steps for reaching this target.
What do you think about the trend of XAUUSD? Feel free to share your thoughts in the comments!
Good luck!

GOLD WEEKLY CHART MID/LONG TERM ROUTE MAPWeekly Chart Update
3659 Retested & Closed Above, 3732 Gap Opens
Last week we saw 3659 tested again, and this time we finished with a weekly candle body close above the level, officially opening the gap toward 3732. This marks a significant step in confirming continuation of the bullish sequence.
At the same time, we must note a detachment left below at 3576. Both 3659 and 3576 now act as correctional support zone levels to keep in mind should price pull back before continuation higher.
Current Outlook
🔹 3659 Retest & Close Above
The weekly body close above 3659 clears resistance and validates upside progression.
🔹 Long-Range Gap Toward 3732
With 3659 cleared, momentum now shifts focus to 3732 as the next upside objective. EMA5 lock confirmation here will further solidify strength.
🔹 Correctional Supports at 3659 & 3576
While the path to 3732 is open, 3659 and 3576 both serve as important levels of support. A healthy correction into these zones would help establish a strong base for continuation.
Updated Levels to Watch
📉 Supports – 3659 & 3576 (correction zones), deeper floor at 3482
📈 Resistance / Next Upside Objective – 3732
Plan
The long-range gap above 3732 is now active. A continuation higher depends on holding recent breakout levels:
Thanks as always for your support,
Mr Gold
GoldViewFX

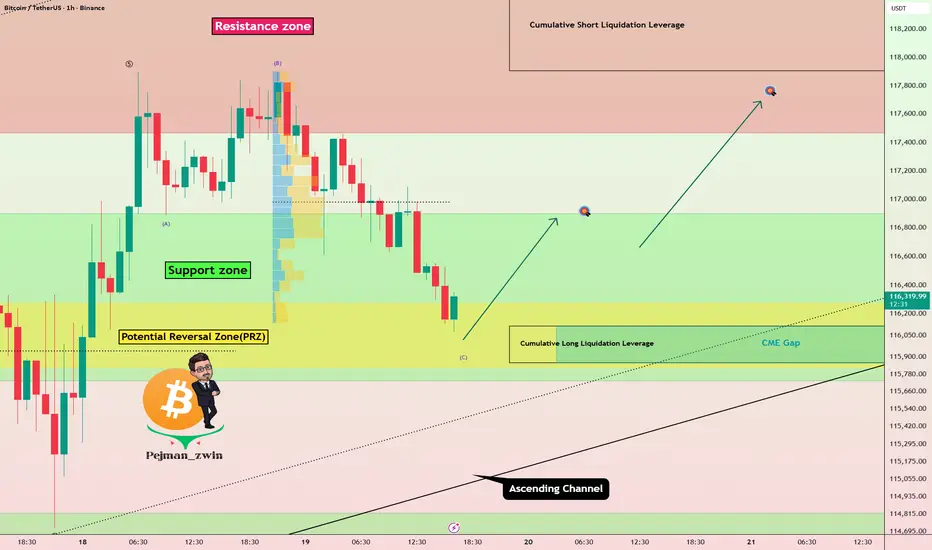
Key PRZ Ahead for Bitcoin – Bounce or Breakdown?Bitcoin ( BINANCE:BTCUSDT ) moved as I expected in my previous idea and rose to the Resistance zone($118,580-$117,460) .
First of all, let me say that this is a short-term Bitcoin analysis .
Bitcoin is filling the CME Gap($116,115-$115,860) and is moving near the Support zone($116,900-$115,730) [, Cumulative Long Liquidation Leverage($115,555-$114,424) , Potential Reversal Zone(PRZ) , and the lower line of the ascending channel .
In terms of Elliott Wave theory , Bitcoin appears to be completing a wave C of the Expanding Flat(ABC/3-3-5) .
I expect Bitcoin to rise to at least $116,910 if it even manages to break the ascending channel.
Second Target: $117,760
Stop Loss(SL): $$115,300
Cumulative Short Liquidation Leverage: $118,965-$117,906
Please respect each other's ideas and express them politely if you agree or disagree.
Bitcoin Analysis (BTCUSDT), 1-hour time frame.
Be sure to follow the updated ideas.
Do not forget to put a Stop loss for your positions (For every position you want to open).
Please follow your strategy and updates; this is just my Idea, and I will gladly see your ideas in this post.
Please do not forget the ✅' like '✅ button 🙏😊 & Share it with your friends; thanks, and Trade safe.
Bitcoin: Buying Opportunity at Support Before the Next RallyHello everyone, today I’d like to share a brief analysis of Bitcoin BINANCE:BTCUSD and some key developments in the market.
Currently, Bitcoin is experiencing a mild correction after a strong rally in recent weeks. During this phase, Fair Value Gaps (FVGs) are appearing, which could provide opportunities for the market to fill price inefficiencies and continue its prior trend.
From a technical perspective, Ichimoku Cloud shows that the price is hovering around the Cloud area, a crucial region in determining Bitcoin’s next move. If Bitcoin fails to hold above its current support, we could see another slight correction before continuation.
Macro Factors Impacting Bitcoin:
US Bitcoin Reserves: The US government’s recognition of Bitcoin as a national reserve asset has strengthened investor confidence.
Corporate Adoption: Companies such as MicroStrategy are ramping up Bitcoin purchases, injecting significant capital into the market.
Monetary Policy: The Federal Reserve’s rate cuts may enhance Bitcoin’s appeal as a safe-haven investment.
Bitcoin Outlook:
Although Bitcoin is currently in a slight pullback, I anticipate that after retesting the key support zone between 113,000 and 115,000 USD, Bitcoin will attract strong buying pressure and begin to recover. If it holds these levels, the market is likely to resume its bullish momentum toward the next resistance levels, with the first target at 116,000 USD.
Therefore, if you are monitoring Bitcoin, the 113,000 – 115,000 USD range is a strategic area to consider buying, with expectations of continued upside momentum in the near term.
Wishing you successful trades and always exercise caution in your decisions!

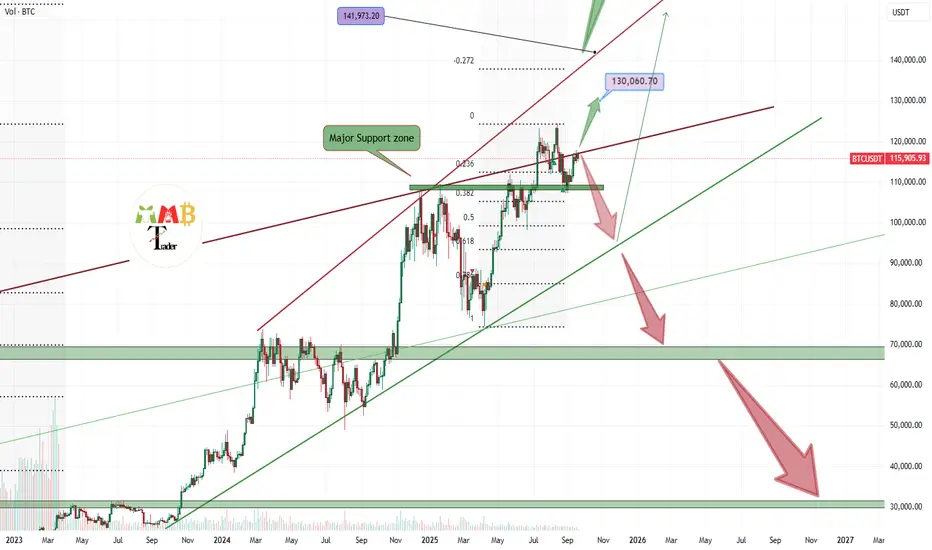
Bitcoin - New rising wedge, you must see! 127k, then drop to 85kI am the first human on the internet to share with you this rising wedge pattern that is currently forming on Bitcoin. As you know, rising wedges are in general bearish patterns, so you can expect a pretty strong downtrend after this pattern is formed. But right now Bitcoin is strong, and I expect a new all-time high in the following weeks.
I know that there are many moon boys in the comment section calling for 300k, 500k, or even 1 million USD per bitcoin until the end of the year or 2026, but this is completely impossible. A much higher chance than that would be that the artificial moon explodes or ugly satanic Saturn explodes. So you can imagine that.
From a technical point of view, the falling wedge is somewhere in the middle of its formation; we don't know when it will end, but I expect this pattern to end sometime in the second half of Q4 2025. My Elliott Wave count suggests that we are in the final Wave (5)(5)(5), which is a pretty rare situation; it happens really only once every few years.
I think the ultimate top on Bitcoin could be around 127,000 USD for this bullish cycle, and I am pretty realistic here. If this falling wedge pattern breaks to the downside, there really isn't any strong support until 85k that can prevent Bitcoin from further falling.
Write a comment with your altcoin + hit the like button, and I will make an analysis for you in response. Trading is not hard if you have a good coach! This is not a trade setup, as there is no stop-loss or profit target. I share my trades privately. Thank you, and I wish you successful trades!

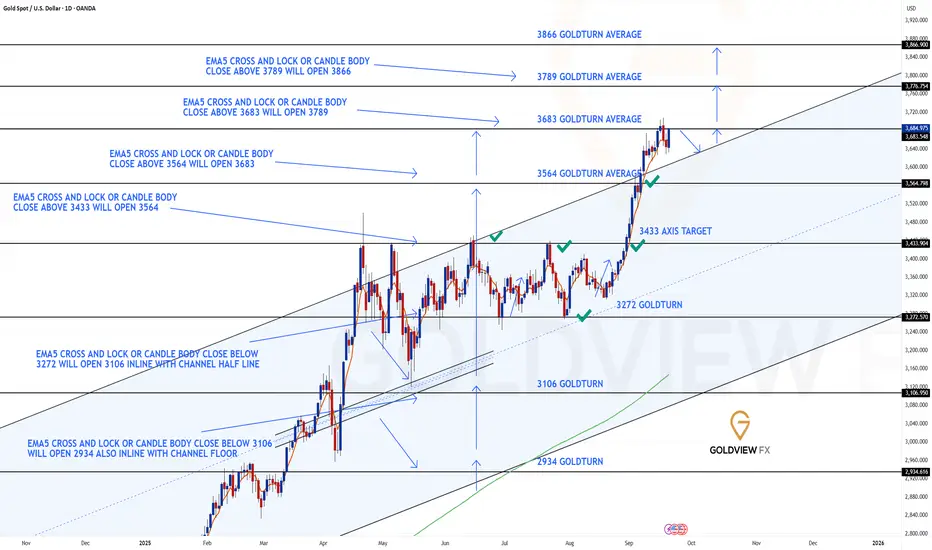
GOLD DAILY CHART ROUTE MAPDaily Chart Update
3683 Target Achieved, Long-Range 3789 Opens
Great finish last week as we got the 3683 target hit following candle body and EMA5 lock above 3564. This clean breakout move confirms the strength of the bullish momentum and completes the next phase of our projected sequence.
We are now seeing candle body close above 3683, which has opened the long-range upside target at 3789. A sustained EMA5 lock above this zone will further confirm continuation strength.
For this momentum to remain healthy, we want to see the channel top act as support on any correction, establishing a solid base for the range expansion. A hold here would validate the breakout structure, while failure to maintain support risks fading back into the channel.
Current Outlook
🔹 3683 Target Reached
Projection played out with precision as the EMA5 lock above 3564 confirmed continuation, giving us the upside completion into 3683.
🔹 Next Objective – 3789
Price action now extends higher, with body closes above 3683 opening the door toward the 3789 target. EMA5 lock here will be the key confirmation for strength.
🔹 Channel Top Support Crucial
The channel top now flips into potential support. Holding above it will sustain the bullish breakout narrative, while any breakdown back below risks a fake-out.
Updated Key Levels
📉 Support – 3433 & 3564
📉 Deeper Support – 3272 (pivotal floor)
📈 Resistance / Next Upside Objective – 3789
Thanks as always for your continued support,
Mr Gold
GoldViewFX
Lingrid | HYPEUSDT Pullback Pattern Long OpportunityThe price perfectly fulfilled my previous idea . KUCOIN:HYPEUSDT is holding above 55 after rebounding from the 53.5 support zone and respecting the upward trendline. The chart shows strong bullish momentum, with buyers eyeing the 60 resistance level, which also aligns with the upper boundary of the resistance zone. A breakout above 60 would open the path toward the 64–66 target area inside the broader channel. As long as 53.5 holds as support, the bias remains to the upside.
⚠️ Risks:
A breakdown below 53.5 could trigger a correction toward 47.8.
Crypto market volatility driven by Bitcoin dominance shifts may impact momentum.
Failure to sustain volume near 60 could cause rejection and consolidation back inside the channel.
If this idea resonates with you or you have your own opinion, traders, hit the comments. I’m excited to read your thoughts!

EUR/GBP at a Critical Level: Breakout or Fakeout?1. Seasonal Tendencies
September over a 20y–15y horizon is historically neutral to slightly positive.
In the last 5y and 2y, however, seasonality has shown stronger bullish tendencies with significant average gains.
October, on the other hand, historically turns negative, suggesting that the current bullish momentum may face resistance and a potential reversal next month.
📌 Seasonal Conclusion: Short-term bullish support until the end of September, but a correction risk in October.
2. Sentiment
90% of retail traders are short from around 0.8623.
Only 10% are long, with worse average entries at 0.8682.
Such an extreme imbalance signals a high risk of a bullish squeeze: retail traders are fighting the trend and often end up trapped.
📌 Sentiment Conclusion: Contrarian bullish → likely continuation higher into liquidity zones.
3. Commitment of Traders (COT)
Euro: Non-Commercials reduced longs (-4,788) and added shorts (+3,130). Commercials increased longs. Net pressure is bearish from speculators, but institutional support remains.
Pound: Non-Commercials increased longs (+5,947) and cut shorts heavily (-21,078). Commercials drastically reduced longs (-71,750).
Speculators are becoming more bullish on GBP, while institutions are scaling back. Short-term this may favor GBP, but with retail heavily short on EUR/GBP, there’s still room for upward pressure.
📌 COT Conclusion: Mixed outlook, but with a slightly bullish bias on EUR/GBP as long as the market unwinds retail shorts.
4. Technical Analysis (Daily Chart)
EUR/GBP is trading at 0.8720, testing a daily supply area (0.8730–0.8770).
Structure: ascending channel, with the latest bullish impulse from 0.8620.
RSI is in overbought territory, signaling stretched conditions.
📌 Technical Conclusion: The market is at a critical juncture → a break above 0.8730 opens the door for longs, while a strong rejection would confirm a correction.
Overall Bias: Slightly bullish in the short term (September + retail shorts), but reversal risk rises into October.

NEAR/USDT - Bearish Outlook for short Term BINANCE:NEARUSDT NEAR/USDt - Channel Breakout with strong volume, looking for strong bearish in upcoming days.
As altcoin momentum intensifies, Near Protocol
NEARUSDT is rapidly emerging as a standout contender in the crypto space. Fueled by strong fundamentals and recent bullish market trends, NEAR’s rise has caught the attention of both retail and institutional investors.
With NEAR now bridging to Solana and TON via Chain Signatures, the future looks promising. Wondering where it’s headed next? Dive into our in-depth NEAR Price Prediction
However, if bearish pressure takes over and breaks the $2.0 to $1.8 support zone, a further decline is likely, with the $1.0 level becoming the next probable target.
Support by Likes and Comments.
Thank you.

STBL PERPETUAL TRADE SELL SETUP Short from $0.33400STBL PERPETUAL TRADE
SELL SETUP
Short from $0.33400
Currently $0.33400
Targeting $0.30600 or Down
(Trading plan IF STBL
go up to $0.36
will add more shorts)
Follow the notes for updates
In the event of an early exit,
this analysis will be updated.
Its not a Financial advice
