SPX500 and NAS100: Market Context Analysis📊 SPX500 Analysis
━━━━━━━━━━━━━━━━━━━━━━
Price is interacting with liquidity within the inefficiency zone, which suggests that large players are accumulating long positions in these areas (blue rectangles). However, price struggles to hold above.
Note how price engages with buy-side liquidity at the highs (marked with purple lines) without any strong acceptance. In essence, the objective of these local bullish moves is liquidity itself: price sweeps liquidity and then immediately retraces to test the inefficiencies or to take sell-side liquidity resting near the lows.
This is how large players generate profit — accumulating at the lows and distributing at the highs.
━━━━━━━━━━━━━━━━━━━━━━
After the most recent liquidity sweep into the TFVG, price formed an IFVG, confirming a shift in the local order flow. However, it is important to understand that such a shift in order flow must have an objective, and the ultimate objective is revealed through price reaction.
Yesterday, price tapped the 7000 level but once again failed to achieve acceptance in that area. This signals uncertainty.
For confidence in a continuation of the bullish move, we need further confirmation in the form of acceptance with imbalance formation around 7016 or higher.
If that does not occur, price is likely to revisit the Fair Value Gap (marked in purple).
In that scenario, the reaction from that zone will be key.
━━━━━━━━━━━━━━━━━━━━━━━━━━━━━━━━━━━━━━━━━━━━━━━━━━━━━━━━━━━━━━━━━━━━━━━━━━━━━━━━━━━━
📉 NAS100 Analysis
━━━━━━━━━━━━━━━━━━━━━━
The situation on Nasdaq is similar, except for the relative weakness compared to SPX. This is evident in the fact that SPX has already printed a new ATH, while Nasdaq has only approached that area.
In other words, if U.S. indices start to move lower, Nasdaq will most likely decline more aggressively — in terms of pure range, it tends to deliver a larger move.
━━━━━━━━━━━━━━━━━━━━━━
Price has achieved acceptance above the last high, meaning external liquidity has been taken.
I will be waiting for price to return into the internal area of interest for position rebalancing.
The key confirmation for confidence in the continuation of the bullish move, in this case, will be SPX.
Feel free to ask your questions in the comments.
Enjoy!
Imbalance

EUROUSD — Daily High/Low Imbalance CapPrice left a single-print imbalance cap at 1.18334 across two sessions.
Monday’s low printed with incomplete structure, leaving isolated prints below the daily low.
Structure shows unfinished acceptance around 1.18334.
— CORE5DAN
Institutional Logic. Modern Technology. Real Freedom.

GBPUSD H1 Sell-Side Liquidity Sweep and Bullish FVG Reclaim📝 Description
GBPUSD has been trending lower and recently swept sell-side liquidity below the H4 lows. After this liquidity grab, price is now stabilizing inside a discount zone, reacting positively around the H1/H30 FVG area.
________________________________________
📈 Signal / Analysis
Primary Bias: Bullish (Pullback)
Preferred Setup:
• Entry: 1.3429
• Stop Loss: Below 1.3410
• TP1: 1.3450
• TP2: 1.3465
• TP3: 1.3503
________________________________________
🎯 ICT & SMC Notes
• Clear SSL sweep of H4 lows
• Price trading in HTF discount
• Multiple H1 / M30 FVGs above acting as magnets
________________________________________
🧩 Summary
This setup favors a sell-side liquidity grab followed by bullish mean reversion. As long as price holds above the recent low and respects the FVG base, upside continuation toward higher liquidity pools remains the higher-probability scenario.
________________________________________
🌍 Fundamental Notes / Sentiment
Despite generally USD-supportive data, the market has largely priced in the higher-for-longer narrative. With no fresh GBP-negative catalyst today, USD strength may stall, opening room for a short-term corrective pullback higher in GBPUSD. As long as upside is treated as counter-trend and tactical, intraday longs can play out before USD demand potentially reasserts itself.
________________________________________
⚠️ Risk Disclosure
Trading involves substantial risk and may result in capital loss. This analysis is for educational purposes only and does not constitute financial advice. Always apply proper risk management, predefined stop-loss levels, and disciplined position sizing aligned with your trading plan.

USDJPY M15 FVG Rejection and Short-Term Bearish Rotation Setup📝 Description
USDJPY on M15 is trading inside a corrective pullback after a recent bullish push. Price has moved into the 15M FVG and is showing rejection from the upper imbalance, suggesting weak acceptance at higher prices. This behavior points to a liquidity-driven pullback rather than continuation.
________________________________________
📈 Signal / Analysis
Primary Bias: Short-term bearish while below 156.80
Short Setup (Preferred):
• Entry (Sell): 156.73
• Stop Loss: Above 156.82
• TP1: 156.63
• TP2: 156.46
• TP3: 156.30 (sell-side liquidity)
________________________________________
🎯 ICT & SMC Notes
• Price rejected from 15M FVG
• Failure to hold premium pricing
• Sell-side liquidity resting below recent lows
________________________________________
🧩 Summary
As long as USDJPY remains capped below the 15M FVG, the higher-probability path is a downside rotation toward 156.46 and 156.30 liquidity. Acceptance above the imbalance invalidates the short idea.
________________________________________
🌍 Fundamental Notes / Sentiment
Short-term moves remain sensitive to US yield fluctuations and BoJ expectations. In the absence of strong USD momentum, technical rejection zones are likely to guide price action.
________________________________________
⚠️ Risk Disclosure
Trading involves substantial risk and may result in capital loss. This analysis is for educational purposes only and does not constitute financial advice. Always apply proper risk management, predefined stop-loss levels, and disciplined position sizing aligned with your trading plan.

ETH M30 Bullish Continuation and Liquidity Expansion Setup📝 Description
ETH on M30 is holding a bullish structure after a controlled pullback into discount. Price respected the 0.618 OTE area and reacted cleanly, suggesting this move is corrective. With downside pressure absorbed, odds favor a bullish continuation toward higher liquidity.
________________________________________
📈 Signal / Analysis
Primary Bias: Bullish continuation while above 3,200
Long Setup (Preferred):
• Entry (Buy): 3,220 (OTE / reaction zone)
• Stop Loss: Below 3,195
• TP1: 3,242
• TP2: 3,282 (H4/H1 FVG)
• TP3: 3,309 (BSL / range high)
________________________________________
🎯 ICT & SMC Notes
• Clean reaction from OTE 0.618
• Structure still bullish on LTF
• FVG H4/H1 overhead acting as liquidity magnet
________________________________________
🧩 Summary
This looks like a pullback-for-continuation setup. As long as ETH holds above the OTE support, the higher-probability path is upside expansion toward stacked liquidity near 3.28k–3.31k.
________________________________________
🌍 Fundamental Notes / Sentiment
With crypto sentiment stabilizing and no immediate risk-off catalyst, technical structure and liquidity support a bullish continuation. Manage risk and scale out into upside targets.
________________________________________
⚠️ Risk Disclosure
Trading involves substantial risk and may result in capital loss. This analysis is for educational purposes only and does not constitute financial advice. Always apply proper risk management, predefined stop-loss levels, and disciplined position sizing aligned with your trading plan.

ETH M30 HTF FVG Tap and Mean Reversion Pullback Setup📝 Description
ETH on M30 just delivered a strong impulse into HTF premium, tapping the H1/30M FVG and stalling. The move looks exhaustive, with price now trading at a reaction zone where a mean-reversion pullback is favored before any continuation attempt.
________________________________________
📈 Signal / Analysis
Primary Bias: Short-term pullback while below 3,030–3,040
Short Setup (Reactive):
• Entry (Sell): 3,022
• Stop Loss: Above 3,040
• TP1: 3,008.80
• TP2: 2,994.88
• TP3: 2,979.74
________________________________________
🎯 ICT & SMC Notes
• Price tapped HTF FVG (H1/30M)
• Trading deep in premium
• Downside H1 FVG acting as draw
• Momentum cooling after impulse
________________________________________
🧩 Summary
This is a classic impulse to premium reaction and pullback setup. As long as ETH remains capped below the FVG, odds favor a rotation toward 3,009 to 2,980. Acceptance above premium invalidates the short.
________________________________________
🌍 Fundamental Notes / Sentiment
With markets still liquidity-driven and no fresh risk-on catalyst, short-term reactions at HTF imbalances tend to resolve with mean reversion. Trade levels, manage risk, and scale out at targets.
________________________________________
⚠️ Risk Disclosure
Trading involves substantial risk and may result in capital loss. This analysis is for educational purposes only and does not constitute financial advice. Always apply proper risk management, predefined stop-loss levels, and disciplined position sizing aligned with your trading plan.

An Exhaustive Analysis of Financial Market GapsAn Exhaustive Analysis of Financial Market Gaps: Mechanics, Psychology, and Advanced Trading Applications
● Part I: The Foundational Architecture of Price Gaps
The study of financial markets is, in essence, the study of price action. While much of this action is continuous, with transactions creating a seamless flow of data, there are moments of abrupt discontinuity that appear on price charts as voids or empty spaces. These phenomena, known as price gaps, are not mere charting curiosities; they are powerful signals that reveal profound shifts in the equilibrium between supply and demand, offering a unique window into market psychology and future price direction. Understanding the architecture of these gaps—their definition, their classification, and the complex web of factors that cause their formation—is a prerequisite for any sophisticated market participant seeking to interpret and navigate market dynamics effectively.
• Section 1: Defining the Phenomenon
At its most fundamental level, a price gap represents a range of prices at which no trades have occurred. This visual discontinuity on a price chart signifies a sudden and significant jump in an asset's price, where the opening price of one trading period is markedly different from the closing price of the preceding period.
• 1.1. The Anatomy of a Price Gap: Visual and Technical Definitions
A price gap, also referred to as a "window" in Japanese Candlestick charting, is a term used to describe a discontinuation in a price chart. Visually, it appears as an empty space between two consecutive trading periods, most commonly observed on daily bar or candlestick charts. The formation of a gap indicates that the market's perception of an asset's value has changed so dramatically that it bypasses a range of prices entirely.
• 1.2. A Taxonomy of Gap Formations: Full vs. Partial Gaps
Not all gaps are created equal in their structure or implications. This distinction gives rise to two main categories:
Partial Gap: Occurs when the opening price of the current session is higher or lower than the previous session's close, but still falls within the trading range (high and low) of that previous session.
Full Gap: Occurs when the opening price is completely outside the prior day's entire trading range.
• Section 2: The Genesis of Gaps: Causal Factors and Market Dynamics
Price gaps are the tangible result of a confluence of fundamental, technical, and market microstructure factors.
• 2.1. Fundamental Catalysts
Corporate Earnings Reports: Quarterly earnings reports are the most regular and potent catalysts for individual stocks.
Major News Events: Mergers, acquisitions, product launches, or regulatory changes.
Macroeconomic Data: GDP figures, CPI inflation reports, and interest rate decisions.
• 2.2. Technical Precursors
Support and Resistance Breakouts: A gap through a well-established level is a particularly powerful technical event.
Chart Pattern Completion: Gaps frequently serve as the confirmation signal for patterns like the cup and handle or head and shoulders.
Algorithmic Trading: Automated systems can exacerbate gaps when specific technical conditions are met.
● Part II: A Comprehensive Typology of Market Gaps
The ability to correctly classify a price gap is the most critical step in its analysis. Different types of gaps have vastly different implications for future price action.
• Section 3: The Four Archetypal Gaps: A Deep Dive
• 3.1. The Common Gap (or Trading/Area Gap)
Common Gaps are typically small in magnitude and characterized by normal or below-average trading volume. They usually appear within a sideways trading range and tend to be "filled" relatively quickly, often within a few days.
• 3.2. The Breakaway Gap (or Power Gap)
Signifies a decisive and forceful end to a period of consolidation.
Volume: Must be accompanied by a massive surge in trading volume (ideally 50% or more above the 50-day average).
Significance: Low probability of being filled in the near term; the gap area often transforms into a new support or resistance level.
• 3.3. The Runaway Gap (or Continuation/Measuring Gap)
Occurs in the middle of a well-established trend and signals that the prevailing momentum is strong. It is often driven by "FOMO" (Fear of Missing Out).
• 3.4. The Exhaustion Gap
Occurs near the end of a mature trend. The single most important feature is climactic trading volume . This represents the peak of emotional intensity, often followed by a rapid reversal and a high likelihood of the gap being filled.
• Section 4: Advanced and Specialized Gap Patterns
• 4.1. The Island Reversal
A distinctive and highly reliable chart pattern where a cluster of price bars is isolated by gaps on both sides. It represents a dramatic shift in market sentiment and is one of the strongest reversal signals in technical analysis.
• 4.2. Fair Value Gaps (FVG) and Liquidity Voids
An institutional perspective identifying market inefficiencies. An FVG is a three-candle pattern where the wick of the first and third candle do not overlap. Unlike breakaway gaps, FVGs are viewed as "magnets" that price will likely return to in order to rebalance liquidity.
● Part III: The Human Element and Empirical Realities
• Section 5: The Behavioral Science of Gaps
Irrational Exuberance: Drives bullish exhaustion gaps where optimism overrides fundamentals.
Panic and Capitulation: Drives downside exhaustion gaps at the end of a downtrend.
Herd Behavior: Amplifies price shocks as traders follow the collective crowd, often leading to initial overreactions.
"Breakaway, Runaway, and Exhaustion gaps are foundational technical formations rooted in crowd psychology and trend lifecycle stages. Conversely, the Fair Value Gap (FVG) is an institutional metric designed to identify price inefficiencies. While analytically distinct, these frameworks often converge within the same price action event, providing a dual perspective on market dynamics."
• Section 6: Statistical Analysis of the "Gap Fill"
The popular adage that "all gaps get filled" is an oversimplification.
Common/Exhaustion Gaps: Fill probability of 75-90%.
Breakaway Gaps: Fill probability of 35-65%.
Volume Impact: Gaps on low volume are 85% likely to fill within two sessions.
● Part IV: Application and Strategy
• Section 7: Strategic Frameworks for Gap Trading
Momentum-Based ("Gap and Go"): Trading with the gap. Best for Breakaway and Runaway gaps.
Mean-Reversion ("Fading the Gap"): Trading against the gap. Best for Common and Exhaustion gaps.
• Section 8: The Indispensable Role of Confirmation
Volume Spread Analysis: High volume validates breakaway gaps; climactic volume confirms exhaustion.
Momentum Oscillators (RSI, MACD): Identify divergences that suggest a gap might be exhausting rather than continuing.
Volatility Indicators (ATR): Used to set intelligent stop-losses based on the asset's specific character.
• Section 9: Advanced Risk Management
The single greatest danger in holding positions overnight is Gap Risk—the risk that price opens far beyond a pre-set stop-loss, causing significant slippage.
To manage this risk:
Avoid known catalysts (earnings).
Reduce position size during high-volatility weeks.
Use protective options (hedging).
● Part V: A Cross-Market Perspective
• Section 10: Comparative Gap Analysis Across Asset Classes
Equities: Daily gaps due to session closures; earnings are the primary driver.
Forex: Weekday gaps are rare; weekend gaps are the primary focus.
Commodities: Sensitive to supply shocks and interplay between global exchanges (CME vs LME).
Cryptocurrencies: Spot markets are 24/7 (no gaps), but CME Bitcoin Futures Gaps act as powerful price magnets with high fill rates.
● Part VI: Synthesis and Concluding Insights
• Section 11: Integrating Gap Analysis into a Holistic Market Framework
Effective gap analysis requires that:
Diagnosis Precedes Treatment: Classify the gap before selecting a strategy.
Volume is the Arbiter of Truth: It is the physical manifestation of market conviction.
Analysis is Probabilistic: There are no certainties, only shifts in likelihood based on context.
The study of price gaps remains one of the most compelling disciplines in financial markets, offering a record of collective emotion and a lens into market discovery.

BTC M15 Partial FVG Tap to Lower FVG Fill Play📝 Description
BTC on M15 is trading inside a short-term corrective range after a sharp impulse. Price already made a partial tap into the upper FVG (30M/15M), but the reaction was weak. With imbalance still unfilled, odds favor a deeper move toward the lower FVG before any continuation attempt.
________________________________________
📈 Signal / Analysis
Primary Bias: Short-term pullback while below 89,000–89,100
Short Setup (Reactive):
• Entry (Sell): 88,950
• Stop Loss: Above 89,080
• TP1: 88,750
• TP2: 88,530
• TP3: 88,400
________________________________________
🎯 ICT & SMC Notes
• Partial FVG fill and imbalance still open
• Price reacting from premium
• Liquidity resting below recent range lows
• Structure favors mean reversion, not expansion
________________________________________
🧩 Summary
This is a classic partial FVG tap full fill scenario. As long as BTC stays capped below 89k, a rotation into the lower FVG is the higher-probability path. Acceptance above premium invalidates the short.
________________________________________
🌍 Fundamental Notes / Sentiment
With markets still headline-driven and liquidity tight, short-term reactions around imbalances are favored. Keep size light and manage risk around key levels.
________________________________________
⚠️ Risk Disclosure
Trading involves substantial risk and may result in capital loss. This analysis is for educational purposes only and does not constitute financial advice. Always apply proper risk management, predefined stop-loss levels, and disciplined position sizing aligned with your trading plan.

GOOGL low resistance liquidity run to ATHI think this GOOGL 24 hour chart has a great set up to take us back to All-time high.
We got the formation of a bullish fair value gap today.
We have relative highs sitting at 321.31.
Most definitely a low resistance run on liquidity at 332.98.
There was a gap on the weekly timeframe that got filled, and we got a bounce out of it two weeks in a row, and this would be the third week of a bounce .
The only thing that could disrupt this move up, is that there is a bearish weekly Fair value gap that needs to get broken through.
We clear that and it could be smooth sailing.

BTC — Trendline Rejection or Breakout? BTC is approaching a key structural decision point, and the next move will determine whether we see continuation upward or a corrective sweep to lower liquidity levels. This idea outlines both scenarios with clear targets and educational structure analysis.
Key Structural Areas
1️⃣ Rising Trendline Support
BTC continues to respect a clean ascending trendline. This line has been a major pivot for the past several days.
Price is currently hovering just above it, and the yellow circle marks the confluence of:
Rising trendline support
A local demand block
Prior liquidity sweep zone
This is the most important area to watch for reaction.
2️⃣ Short-Term Rejection Scenario (White Path)
Before breaking upward, BTC may show short-term downside rejection, targeting:
➡️ Short-Term Target:
$88,180
This level aligns with:
Demand block retest
Trendline kiss
Local inefficiencies needing fill
A rejection into 88,180 would be normal and healthy before a potential bullish continuation.
3️⃣ Bullish Reclaim Scenario
If price taps the rejection zone and reclaims the trendline, upside targets remain:
$95,800 – $96,500 → Half-filled FVG + structural supply
$99,500 – $100,200 → Major FVG + macro resistance zone
These zones are where we expect strong reaction and profit-taking.
4️⃣ Breakdown Scenario
If BTC fails the trendline with a full candle close below, expect:
Breakdown of structure
Full sweep of demand
Deeper correction into mid-range levels
Not my primary bias, but it's critical to acknowledge the possibility.
Summary
BTC is sitting on an important trendline.
A quick rejection into 88,180 could be the liquidity grab needed before upside continuation.
Reclaiming the trendline = bullish continuation toward FVGs.
Breaking below = deeper corrective move.
📘 Disclaimer
This analysis is for educational purposes only. It represents personal opinion and not financial advice. Always do your own research and manage your own risk.

EURUSD: Liquidity Grab @ 1.15000EURUSD has experienced a liquidity grab as price closed below the previous low and is heading towards 1.15. CRT suggest price could go lower and wick below the previous candle or even drop further.
Alongside 1.15, there is an imbalance, which price could tap into and possibly fill, both EURUSD and GBPUSD has some divergence so it will be interesting to see how it plays out

Rare Global Long Liquidity Imbalance (Order Book Signal)Over the last few days, the Long Zigg indicator has printed a rare extreme reading of 100 at the 10% order book depth — and this level appeared twice in just three days . Other monitored depths are also trading near their recent highs.
The last time we saw similar readings was around March 7, 2025 . After a brief correction, the market moved into a strong growth phase:
• BTC ≈ +70%
• ETH ≈ +225%
• SOL ≈ +166%
Many altcoins extended even further over the following months.
Long Zigg tracks the liquidity imbalance toward longs across the entire market using aggregated order books rather than price alone. It highlights moments when buy-side interest clearly dominates available sell liquidity.
Right now, this signal again shows a notable skew in liquidity to the buy side. I’m watching to see whether the market will react in a similar way to the previous extreme, or if this time will be different.
This is not financial advice and not a trade recommendation — just an observation based on my order book analytics.

BTC — Original Distribution Still UnfinishedBTC continues to move inside unfinished structure. Risk tone is neutral and overnight flows were thin, leaving the market waiting for direction from today’s U.S. releases. The only event with enough weight to shift risk appetite is the FOMC Minutes later today.
On the chart, BTC has rejected the original bullish distribution gap at 88,804.64 for several sessions. That gap remains unclosed, which signals unfinished architecture rather than trend continuation. Price is still confined within Monday’s range between 91,158 and 95,950, forming a clean mid-range compression. Nothing in this structure confirms resolution yet.
Market Structure Mapping views this compression as a neutral regime: the market is balancing, not trending. The failure to close the distribution zone shows the prior move left imbalance behind, and markets generally rebalance before committing to a new leg. Retail sees “sideways.” Professionals see preparation.
The non-obvious point: this isn’t hesitation; it’s the market restoring balance before revealing intent.
For operators, the approach is straightforward. Let New York volatility clear the noise. Structural clarity only appears once price resolves above 95,950 or below 91,158. Anything before that is positioning, not direction.
— CORE5DAN
Institutional Logic. Modern Technology. Real Freedom.

DXY, US DOLAAR UPDATEDXY — Structure & Flow Brief
DXY | Bullish Bias | Daily Frame | CORE5 View:
Dollar remains in short-term pullback mode inside a broader bullish structure, holding between 97.67 and 99.98 while traders watch this week’s macro lineup.
The key data hits Thursday and Friday — Jobless Claims, followed by PPI and Retail Sales.
Those reports will show if the economy is cooling or still running hot, shaping the next leg for the dollar.
Yields stay firm, keeping the tone quietly bullish, but most desks are flat until the data drops.
MSM — Market Structure Mapping (The Framework)
We’re trading inside a daily bearish candle, sliding into the imbalance near 98.964.
A close back above that cap would keep the broader trend context bullish.
If price doesn’t reclaim that level, the structure favors a move toward lower zones before the next leg.
VFA — Volume Flow Analytics (The Participation Map)
A main POC sits at 98.562, right inside the discount area of the range.
That’s a heavy-volume zone — price action can drive into it if downside momentum develops.
On news days, markets often run through these areas to clear liquidity before direction returns.
OFD — Order Flow Dynamics (The Behavior)
Price is currently parked inside an order-flow imbalance, filling single-print orders around 98.964.
It’s an absorption phase — volume is active, but larger players are keeping it balanced until catalysts arrive.
We’re seeing divergences across EURUSD, gold, and yields heading into Friday’s PPI and Retail Sales.
When the data hits, volatility often increases, and these imbalance zones tend to resolve.
PEM — Precision Execution Modeling (The Engagement Rules)
Trading the middle of the range is a low-edge play unless you’re scalping.
We’ve already had strong moves today, so there’s no reason to force new triggers here.
Within the CORE5 framework, we avoid engaging at the 50/50 range midpoint and wait for direction, confirmation, and flow alignment.
For now, it’s about risk control and patience until tomorrow’s data gives a clean framework signal.
CORE5 Rule of the Day:
Mid-range moves feed ego, not equity.
— CORE5DAN
Institutional Logic. Modern Technology. Real Freedom.

GAL Head & Shoulders Breakdown Ahead? | Smart Money Targeting FAThe Ghandhara Automobiles Limited (PSX: GAL) chart is showing a clear Head and Shoulders reversal pattern at the top of a long-term ascending channel — hinting at potential bearish movement before any new bullish cycle begins.
📊 Technical Insights:
🧩 Head & Shoulders Pattern signaling trend exhaustion.
🟪 IMB Zone (Imbalance) yet to be fully mitigated — price likely to rebalance before continuation.
🔻 Fundamental Area around 400–420 PKR could act as a major demand zone for Smart Money accumulation.
🟢 Long-term channel still intact, suggesting possible rebound after discount pricing.
💡 Outlook:
Expect short-term bearish pressure targeting the IMB and Fundamental Zone before the next potential bullish leg. Patience and confirmation at the lower levels will be key for investors and SMC traders.

BTCUSD Pre NY SessionThe key target sits at 98.225, marking the next visible liquidiBTCUSD | 7 Nov 2025
Bitcoin traded through the buy-side imbalance on the daily chart and flipped that zone into resistance.
This confirms a Buy-Side Imbalance Flip.
Clear liquidity targets remain below current price.
The key target sits at 98.225, marking the next visible liquidity objective.
Dollar tone stays firm, and risk sentiment remains cautious.
Crypto markets continue to mirror liquidity behavior, not headlines.
Flows remain defensive as participants manage exposure into key levels.
Professionals wait for confirmation when structure shifts.
They don’t react to the first move — they study how price behaves around it.
Patience at structural turns defines consistency.
— CORE5DAN
Institutional Logic. Modern Technology. Real Freedom.ty objective.

BTCUSD — Pre-New York Session🧭 Context
Bitcoin is pulling back on the hourly without delta following — a clear Delta Divergence.
Key bearish structure: 104 584.
Imbalance: 104 268.
If price closes below these within the next 15 minutes, retracement higher into the NY session becomes likely.
📊 Technical Frame
Volume delta remains ultra-low while price presses higher — signaling a potential fake move.
The U.S. Dollar hovers sideways in its 4-hour structure, holding range highs.
Confluence is light; precision is required.
🌍 Macro Overview
Crypto sentiment is cautious. Short-term flows favor defensive positioning.
Dollar holds firm but lacks expansion — macro tone remains indecisive ahead of U.S. session liquidity.
🎯 Takeaway
Delta Divergence marks exhaustion, not opportunity.
Let confirmation form at 104 584 / 104 268 before engagement.
— CORE5DAN
Institutional Logic. Modern Technology. Real Freedom.

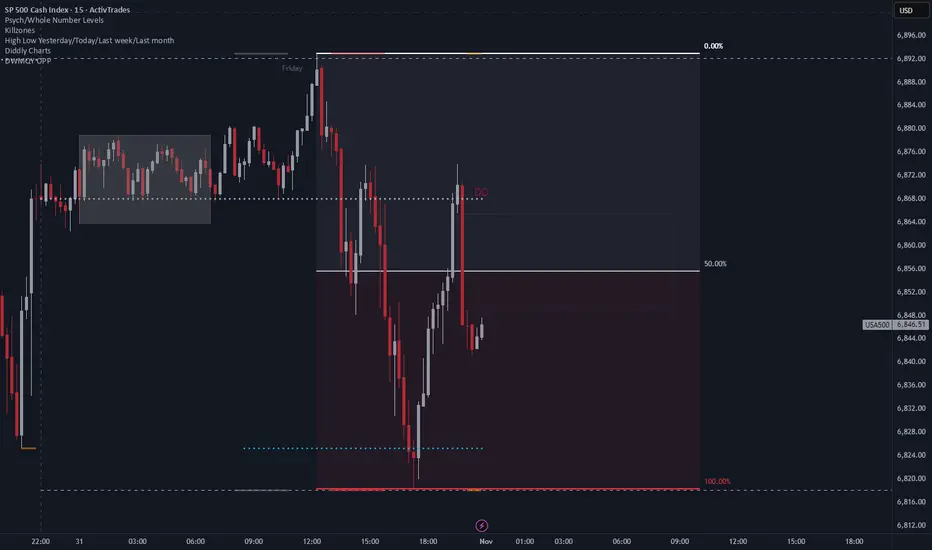
Intraday Range Expansion and Potential Repricing on the SPXFollowing a clean sweep of Friday’s high, price delivered a strong displacement to the downside, breaking short-term structure and rebalancing inefficiencies left behind. The subsequent rebound towards the daily open suggests a retracement into a premium area, potentially setting up for continuation lower if rejection holds around that zone.
If buyers fail to sustain price above the daily open, the market could aim for a full range fill back toward the previous low or discount zones below, maintaining the current bearish intraday order flow.
BTCUSD — Bearish range meets imbalance capBTCUSD - patience before momentum
Date: Sunday, October 19
Timeframe: Daily
Context
Bitcoin remains inside a bearish range — with high of116.080 and low of 103.492.
Price currently sits near the range low, trading into a discount zone the Fibonacci 50% retracement.
The big question: Does price reject from the imbalance cap, or reclaim it and squeeze higher?
Technical Map
• Structure: Daily range remains intact. A daily imbalance cap sits above price in the premium area. If rejected, we confirm bearish continuation; if pierced, it signals structural weakness in sellers and possible momentum shift.
• Momentum: Recent candles show mild bullish recovery. Wait for daily lows to start breaking before short continuation — patience here pays.
• Volume: Heavy bearish volume node clusters near the 111.000 psychological level — expect reaction.
Fundamental Pulse (Week Ahead)
• Macro Drivers: Traders watch US GDP advance data, PCE inflation, and Fed speakers for cues on policy tone.
• Yields: Rising yields could strengthen the Dollar — pressuring risk assets like Bitcoin.
• Liquidity Context: Stablecoin flows and ETF net inflows have slowed; liquidity rotation favors defensive positioning.
Plan
Bias stays bearish unless structure proves otherwise.
The ideal path: rejection from the imbalance cap and midrange confirmation lower.
However, if Dollar strength eases or yields drop, that may unwind shorts — watch structure, not emotion.
Remember: you trade your system, not your feelings.
Mindset Pulse
“You’re never lost when you know your map.”
Structure is the map. Emotions are the fog.
Wait for clarity — not excitement.

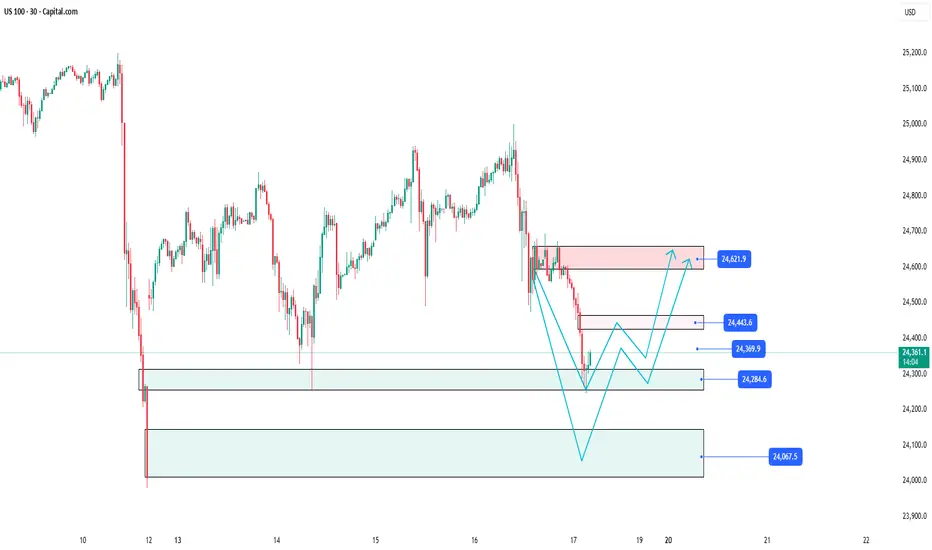
US100: Price action around important imbalance📊 SKILLING:US100 Analysis: Detailed trading scenario at key price level 24,443.6 🚀
The US 100 30-minute chart is currently illustrating a clear picture of price movements with significant support and resistance zones. At the moment, the price is undergoing a strong correction after a deep decline and is approaching crucial price areas, creating multiple potential trading opportunities for investors.
________________________________________
Support Zone 24,284.6 – The starting point for a potential bounce 💥
Currently, the price is nearing the technical support level around 24,284.6 – a key support area that is expected to hold considerable buying interest, potentially triggering a short-term bounce. Buyers may step in here to prevent further declines and initiate a recovery trend.
Careful observation of price action around this zone is essential as it will determine the market’s next momentum: whether the price will rebound or break lower.
________________________________________
Immediate Resistance Levels and the Imbalance Zone at 24,443.6 🔍
Following a bounce from the 24,284.6 support, the expected scenario is a gradual move upwards to test important resistance levels:
• First at 24,369.9, where initial selling pressure may emerge, challenging the upward momentum.
• Next at 24,443.6, identified as a significant imbalance zone on the chart — a price level where price previously moved rapidly, creating a notable supply-demand gap.
• This zone acts as a technical “wall,” a crucial checkpoint before the price can continue its upward trend or get pushed back down.
________________________________________
Detailed Price Movement Scenario 🔄
1. Price bounces from the support at 24,284.6, setting the stage for a recovery leg.
2. Price moves up to test the first resistance at 24,369.9; the reaction here indicates the buyers’ strength.
3. Price then challenges the imbalance zone at 24,443.6 — where significant selling pressure may occur.
4. At this level, two scenarios may unfold:
• Price breaks above 24,443.6, confirming the uptrend and targeting the next resistance at 24,621.9.
• Price rejects this zone, leading to selling pressure that pushes price back to retest the 24,284.6 support or even lower.
________________________________________
Downside scenario if support at 24,284.6 fails 🛡️
In the worst case, if price breaks below the crucial support at 24,284.6, further declines toward a broader support zone at 24,067.5 are likely. This level may act as the next key area for price stabilization and buyer interest before any potential rebound.
Please like and comment below to support our traders. Your reactions will motivate us to do more analysis in the future 🙏✨
Harry Andrew @ ZuperView
Trading GBPUSD | Judas Swing Strategy 15/10/2025This week’s FX:GBPUSD setup was another textbook example of how patience and discipline can turn a high-probability setup into gains. We marked out our range highs and lows, the key zones we monitor for potential manipulation going into New York open.
As Judas Swing session kicked off, price swept below the low of the zone, taking out resting liquidity. This was our first major clue. The Judas Swing strategy looks for these liquidity sweeps before positioning in the opposite direction of the trap.
Once that downside sweep occurred at 9:25EST, our focus shifted to potential long opportunities. We patiently waited for confirmation, specifically a break of structure to the upside before considering any entry. When that break came, all that was left was a retracement into the fair value gap (FVG) formed during the impulsive move up. Price retraced and filled the imbalance, and that’s where we executed our long after the candle closed. Risk was set at 1%, targeting a 2% return.
This entry could be considered a sniper entry because price barely moved against us. Within minutes, price began to rally, confirming the Judas reversal and validating our entry. Price continued climbing and reached our take-profit in less than an hour. The result was a +2R winner while maintaining disciplined risk management.
The Judas Swing strategy thrives on patience and structure. Wait for liquidity sweeps, confirm the break, and execute only when price revisits your FVG. You won’t catch every move, but you’ll catch the right ones and that’s what leads to consistency.

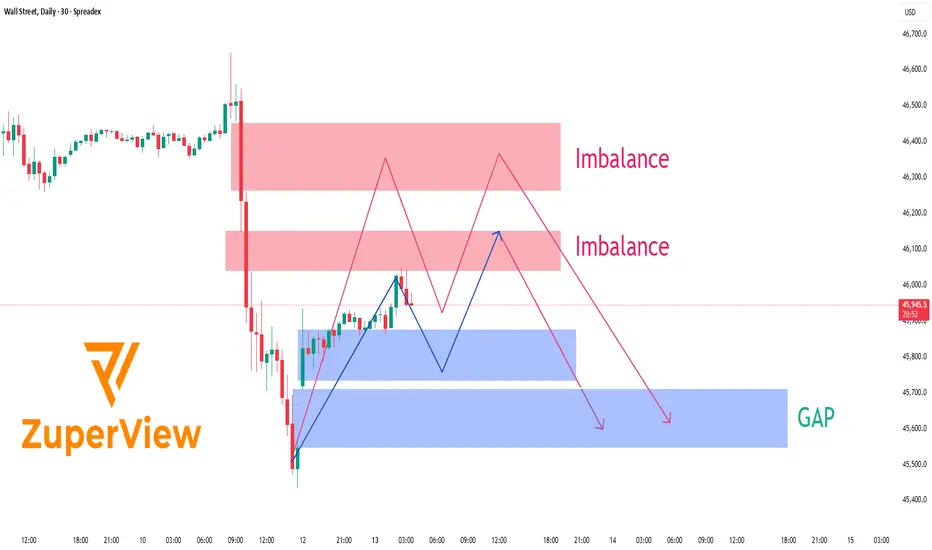
US30: Rebound before the stormTechnical Outlook – Wall Street Index (30-Minute Chart)
After the announcement that the U.S. will impose a 100 % tariff on Chinese imports, Wall Street ⚡ plunged sharply, leaving behind distinct Imbalance zones and an unfilled GAP lurking below current price levels.
At present, price is hovering around 45,950 💵, showing a modest rebound after tapping into a short-term demand zone. Above, two notable Imbalance areas stand out — around 46,000-46,150 and 46,250-46,450 - both formed as aggressive sell orders flooded the market following the latest wave of trade-war headlines 🌍.
The likely scenario 🎯:
Price could continue to retrace upward ↗️ to test one of these supply/imbalance zones before sellers re-enter the market. If selling pressure remains dominant, the index may resume its decline toward the GAP area around 45,500 - 45,650 📉, where liquidity is still unfilled and buyers may look to step back in.
Current price action indicates a corrective pullback rather than a full reversal. Trading volume is thinning 📉, candlestick patterns show signs of exhaustion 🕯️, and the upper imbalance zones remain untouched — all signaling that sellers still hold the upper hand.
________________________________________
🌍 Fundamental Context – U.S. vs. China Tensions Heating Up
On October 10, President Trump officially declared a 100 % additional tariff on Chinese goods, effective November 1, 2025 — the most aggressive move since the 2018-2019 trade war.
Beijing immediately condemned the plan, warning of “corresponding countermeasures”, including restrictions on rare-earth exports and higher port fees on U.S. vessels. While strong in tone, China has so far stopped short of announcing a direct tariff retaliation, signaling a cautious approach while keeping the door open for talks.
Washington, meanwhile, insists the measure aims to “protect American interests and reduce over-reliance on China’s supply chains,” but officials also noted that negotiations remain possible if China shows “substantive goodwill.”
Financial markets reacted swiftly 💥:
• U.S. and Asian equities dropped 2–3 % on average.
• USD strengthened, while gold and JPY rallied as safe-haven flows increased.
• Tech and industrial stocks with strong China exposure saw the largest losses.
Overall, risk sentiment remains fragile as investors brace for a prolonged phase of trade uncertainty.
________________________________________
💡 Trading Summary
Short-term structure favors a sell-the-rally approach. The market may retest upper imbalance zones before resuming its downtrend toward the 45,500 USD GAP area.
If U.S.–China tensions intensify further, downside momentum could accelerate. Conversely, any sign of renewed dialogue or tariff delay could trigger a short-term rebound — but bias remains bearish until the market reclaims 46,300 USD convincingly.
In short: patience, risk control, and reaction to headlines are key this week. ⚖️
Please like and comment below to support our traders. Your reactions motivate us to do more analysis in the future 🙏✨
Harry Andrew @ ZuperView
US30: Consecutive breakouts signal an emerging downtrend
SPREADEX:DJI – When price rejects the high, the market begins to shift
On the 30-minute chart, price action is clearly signaling a loss of bullish momentum and a transition toward a bearish structure.
________________________________________
🧠 Price Action Analysis
1. First Failed Breakout
Price initially broke above the ascending trendline that had held since early October — but failed to hold the breakout.
➤ A classic early warning of buyer exhaustion, often seen during distribution phases.
2. Multi-Layered Resistance Zone
The 46,725 – 46,779 region has become a clustered resistance zone, rejecting price repeatedly.
➤ Multiple rejections here suggest dominant selling pressure, with strong supply overhead.
3. Second False Breakout
A more subtle second breakout attempt followed — but again, price was swiftly rejected.
➤ Consecutive failed breakouts typically indicate a lack of conviction and precede sharp reversals.
________________________________________
📉 Trend Structure Has Shifted Bearish
• Lower highs and lower lows now visible
• Price broke below the previous trendline
• Pullback attempts failed to reclaim broken support
• Market is respecting resistance instead of support
➡ These are clear signs of a short-term downtrend emerging.
________________________________________
🔻 Trading Strategy: Favoring Sell Setups in the New Bearish Context
✴️ Scenario 1: Sell at Retest of Proven Resistance Zone
• Optimal Sell Zone: 46,700 – 46,750
• This area has already triggered two failed breakouts — a third touch could be the ideal trap for late buyers
• Watch for bearish rejection candles (pin bars, bearish engulfing, etc.)
Suggested Sell Limit Order:
→ Entry: 46,730
→ Stop Loss: 46,830 (above prior swing high)
→ TP1: 46,500
→ TP2: 46,300
→ Risk-Reward: At least 1:2
_______________________________________
✴️ Scenario 2: Momentum Sell on Breakdown of Local Support
• Trigger Level: 46,580 — if price breaks below with strong momentum (long red candle, increased volume)
• Confirms trend continuation after consolidation
Suggested Sell Breakout Order:
→ Entry: 46,580
→ Stop Loss: 46,680
→ Target: 46,350 – 46,200
→ Tip: Use smaller position size if breakout appears weak to avoid getting trapped in a fakeout
________________________________________
🎯 Trade Management
• Only enter trades with clear price rejection or momentum confirmation
• Move SL to breakeven after TP1 is hit to lock in safety
• Exit the trade if price closes above 46,830 — that would invalidate the bearish thesis
________________________________________
False breakouts leave a trail — for those who know how to read it. It's not a failure. It’s the market whispering that direction has changed.
Please like and comment below to support our traders. Your reactions will motivate us to do more analysis in the future 🙏✨
Harry Andrew @ ZuperView
