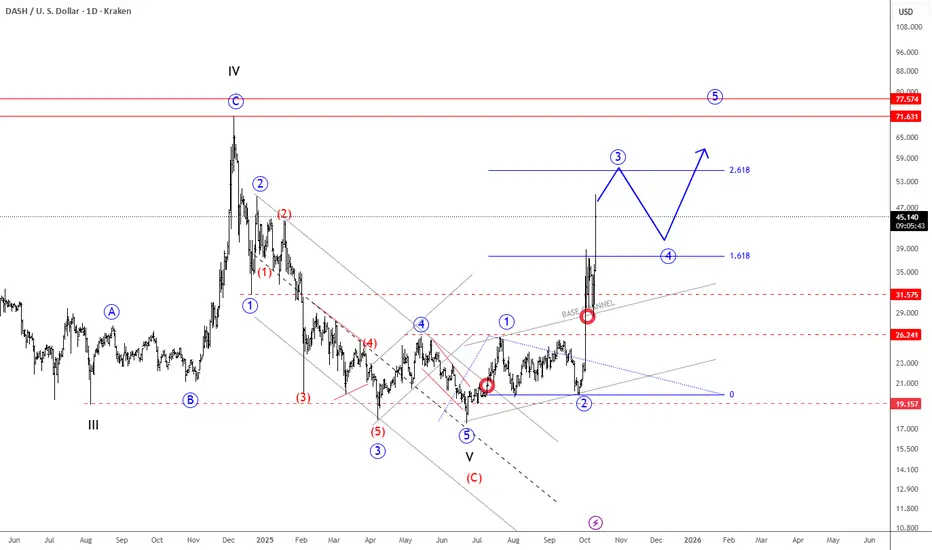
Dash Is Waking Up Strongly As AnticipatedWe talked about the bottom formation on Dash back on August 11, where we mentioned and highlighted that it's recovering from June lows out of the downtrend channel, which suggested that the impulsive decline from the 2024 highs has ended.
Dash is now in a massive rally, waking up strongly, so it's most likely in wave 3 of a five-wave bullish impulse that can extend the price even up to 70 area, we will just have to be aware of wave 4 pullback around 50-55 area. ALTseason can be here. Can other ALTcoins follow soon?
Dash is a cryptocurrency launched in 2014 that focuses on fast, low-cost payments and privacy. It uses a two-tier network with miners and “masternodes” to enable features like InstantSend (near-instant transactions) and PrivateSend (optional privacy). It started as a fork of Bitcoin.
Impulse
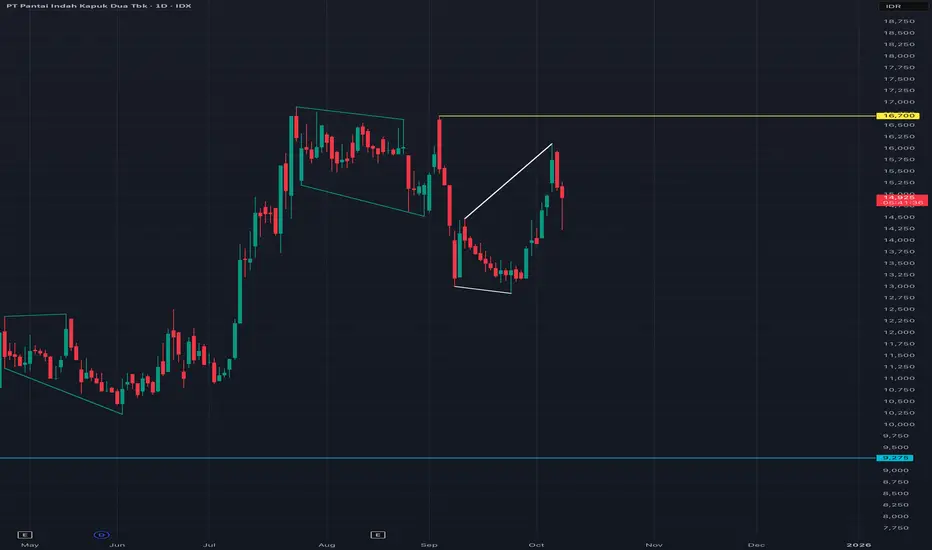
PANI UPDATE I expect this stock to drop below 12,850 without breaking above 16,700 for the moment.
If you plan to buy this stock, in my opinion, it’s a no buy for me at least until 12,850.
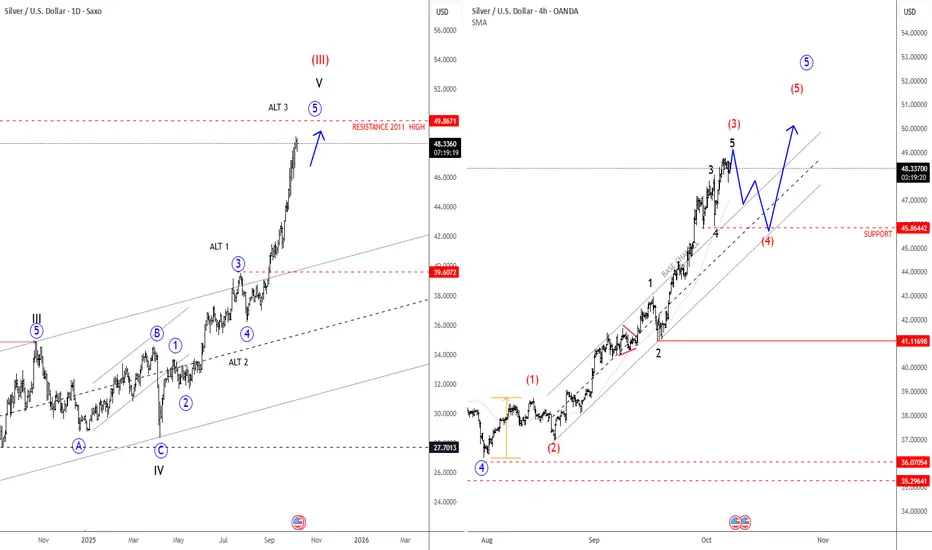
Silver Is Extending Impulsively Higher; All-Time Highs SoonSilver Is Extending Impulsively Higher, which can push the price into all-time highs from a technical point of view and by Elliott wave model.
Silver is on the rise and has been outperforming gold quite a lot over the last week, and it looks like an extended leg up is still in progress; seems like wave three of an extended impulse, therefore more gains are possible after next three-leg retracement. Based on the 4-hour chart, there is a chance that price goes towards 50usd, but there can be some new pullback first. Ideally red wave (4) could stabilize near 45.86. Only a sharp impulse down closer to 43 level will be an indication that higher degree wave four has started.
Higher Time frame charts show an ongoing bull cycle that is now targeting the high from April 2011, which could be the next major level and a potential area for a new retracement, maybe sometime in 2026.
EURUSD Long: Awaiting Bullish Breakout from PennantHello, traders! The price auction for EURUSD has been in a corrective phase, which has taken the form of a large downward pennant. This bullish reversal pattern has been defined by a series of complex lower highs and lower lows, with the price consolidating between the descending supply line and the demand line near the 1.1715 demand level.
Currently, the auction is at a critical inflection point, trading at the apex of this pennant where the supply and demand lines converge. The price has found support near the 1.1715 demand zone, and after a complex series of moves, is now challenging the immediate overhead resistance. This compression of volatility indicates a significant breakout is imminent.
My scenario for the development of events is a bullish resolution of this downward pennant. I expect the price to make an impulsive move and break out above the descending supply line. In my opinion, this breakout will have enough momentum to carry the price up to the major horizontal supply zone. The take-profit is therefore set at the 1.1815 supply level. Manage your risk!

BTCUSD Long: Path to 123000 After BreakoutHello, traders! The prior market structure for BTCUSD saw a significant reversal after the price broke out of a descending channel. This shifted control to buyers and led to a prolonged consolidation phase, with the price auction building a range between the demand zone 2 near 109700 and the supply zone around the 117000 level.
Currently, this long period of balance has been resolved with a decisive breakout. A strong bullish initiative from the demand zone 2 has propelled BTCUSD above the 117000 supply level and out of the consolidation range. The market is now in a clear bullish expansion phase after breaking this key structural point.
My scenario for the development of events is a classic breakout and retest. I expect the price to make a corrective pullback to test the former resistance at the 117000 - 118000 supply zone as new support. In my opinion, a successful bounce from this zone would confirm the breakout's validity and trigger the next impulsive wave higher. The take-profit is therefore set at 123000. Manage your risk.

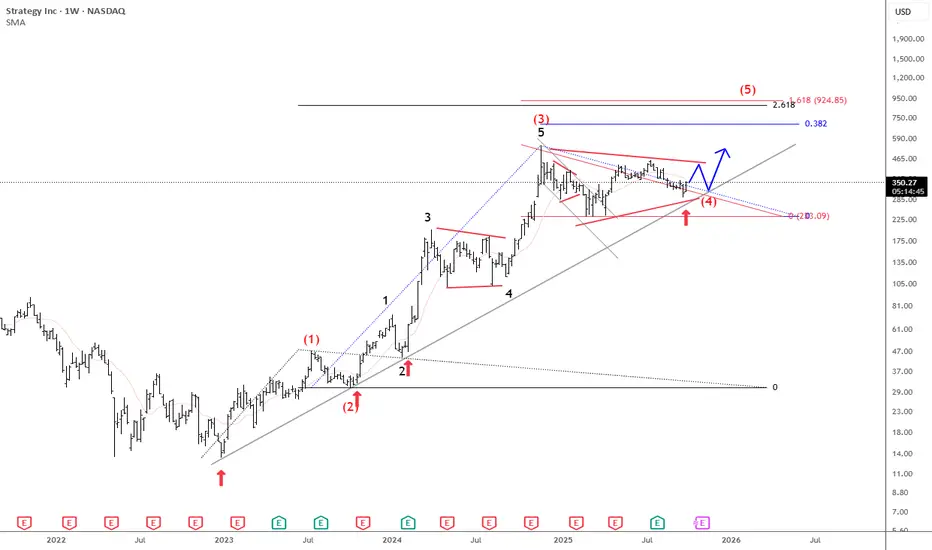
Microstrategy Is Still Pointing Higher For The Final 5th WaveMicrostrategy is a US business intelligence and software company, but it has become best known for its aggressive Bitcoin strategy. Under co-founder Michael Saylor, the company shifted from focusing mainly on software to also using Bitcoin as its primary treasury reserve asset.
Since 2020, MicroStrategy has been steadily buying Bitcoin, often using debt or equity raises to finance purchases. Their strategy is based on the belief that Bitcoin is superior to holding cash, as it can act as a long-term store of value against inflation and currency debasement.
From an Elliott wave perspective, we see Microstrategy nicely holding above trendline connected from the 2022 lows, so it's still unfolding a five-wave bullish impulse. Currently, it's consolidating within a bullish triangle pattern in wave (4), and once it's fully finished, we can expect another and maybe final push to the upside for wave (5) this year before a higher degree correction and bear market shows up next year.
We also want to mention that even Bitcoin can be finishing a 3-year bullish cycle, which can end this year, but there's still some space for more gains along with the Microstrategy to complete the 5th wave of an impulse.
BTCUSD: Awaiting Rejection from the Seller ZoneHello everyone, here is my breakdown of the current Bitcoin setup.
Market Analysis
From a broader perspective, the price action for Bitcoin has been highly volatile, transitioning from a Downward Channel into the current Broadening wedge. This pattern is defined by higher highs and lower lows, indicating an ongoing battle between buyers and sellers with expanding volatility and no clear winner yet.
After failing to break the major Resistance at the 115800 level, the price has rotated down across the entire pattern. Currently, it is trading at a critical location, testing the ascending support line of the wedge, just above the major horizontal Support zone which starts at the 110000 level.
My Scenario & Strategy
My scenario is built around the idea of a potential 'fake breakdown' or a liquidity hunt below the wedge's trendline. I believe the market may make one final push down to test the major horizontal Support at the 110000 level. The key signal I'm watching for is a swift reversal after this potential dip.
Therefore, the strategy is to watch for this reversal. A successful reclaim of the wedge would validate the long scenario. The primary target for the subsequent rally is the 115800 Resistance, which represents a full rotation back to the top of the pattern.
That's the setup I'm tracking. Thank you for your attention, and always manage your risk.

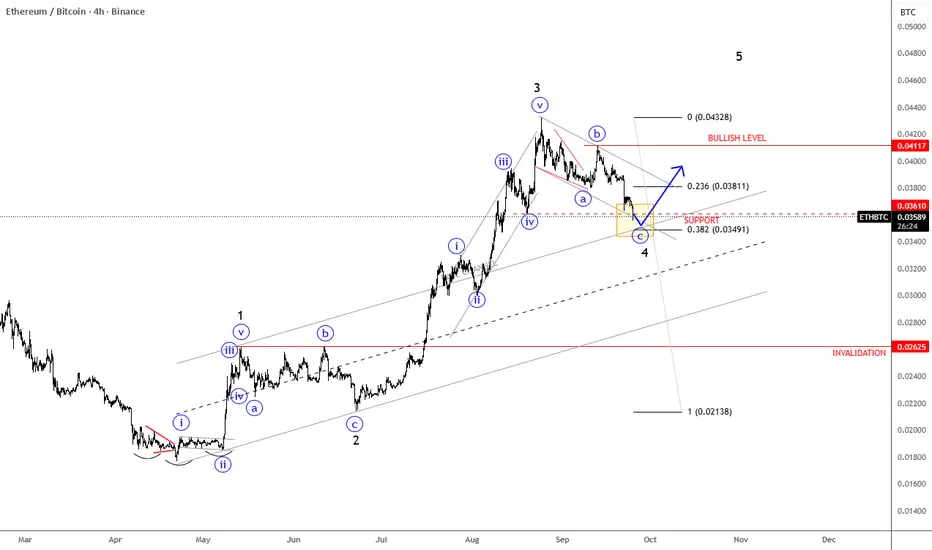
ETHBTC Has A TextBook Bullish PatternETHBTC Has A TextBook Bullish Pattern, as we see an ongoing five-wave bullish impulse by Elliott Wave model
ETHBTC pair is slowed down after a massive extension higher into wave 3, and it's right now testing important 0.035 - 0.034 support zone within an abc correction for wave 4. It's also trading at an important 38,2% Fibonacci retracement and base channel upper line, which can act as a strong support. So soon watch out for a bullish continuation within wave 5, especially if we see a rebound and recovery back above channel resistance line near 0.038 level. Bullish confirmation is above 0.041 level, while the invalidation level is at 0.026.
Gold Pulls Back Within UptrendGold pushed higher to the upper side of the triangle this month, and then also broke above the 3450 area, above both waves D and B swing points. This suggests the contracting range since May is finished and we are now in a new bullish phase, likely the fifth wave on the higher time frame chart. We see metal now in the third subwave of this fifth wave, extending now to 261.8% Fib target. So gold is clearly in an uptrend as long as we trade above 3400, but keep in mind that this higher-degree fifth wave could complete the bull run from the 2023 lows within the next few weeks. But we are not in that final stage yet, looks like more upside after intraday sub wave four pullback., First support is at 3579-3600. So after some slow-down, gold is expected to stay up.

EURUSD - Follow The Bulls Indeed!Hello TradingView Family / Fellow Traders. This is Richard, also known as theSignalyst.
📈EURUSD has been overall bullish trading within the rising channel marked in blue.
This week, EURUSD has been retesting the lower bound of the channel.
Moreover, the orange zone is a strong demand.
🏹 Thus, the highlighted blue circle is a strong area to look for buy setups as it is the intersection of the lower blue trendline and orange demand.
📚 As per my trading style:
As #EURUSD approaches the blue circle zone, I will be looking for trend-following bullish reversal setups (like a double bottom pattern, trendline break , and so on...)
📚 Always follow your trading plan regarding entry, risk management, and trade management.
Good luck!
All Strategies Are Good; If Managed Properly!
~Richard Nasr

BTC - Are You Ready?Hello TradingView Family / Fellow Traders. This is Richard, also known as theSignalyst.
📈BTC has been overall bullish trading within the rising wedge pattern marked in red.
This week, BTC has been retesting the lower bound of the channel.
Moreover, the orange zone is a strong strong and previous all-time high.
🏹 Thus, the highlighted blue circle is a strong area to look for buy setups as it is the intersection of the lower red trendline and previous ATH.
📚 As per my trading style:
As #BTC is around the blue circle zone, I will be looking for trend-following bullish reversal setups (like a double bottom pattern, trendline break , and so on...)
📚 Always follow your trading plan regarding entry, risk management, and trade management.
Good luck!
All Strategies Are Good; If Managed Properly!
~Richard Nasr

Silver Unfolds A New Impulse Within 5th WaveSilver is moving higher as expected, pushing even beyond 39, but since the market also broke to new highs, it’s clear that higher degree wave four is finished as a flat correction back at 36.20, so be aware of even further continuation higher into wave five while makret trades above 39. We need five subwaves now in this blue wave 5 cycle, so more gains can follow after some intraday setbacks. But keep in mind that we are in the final leg of the higher-degree fifth wave impulse that could come to an end around 42/43 this year.

EURGBP Steps Into A New Intraday Five-Wave Bullish ImpulseEURGBP has been moving in line with expectations over the past couple of weeks. After completing a projected higher-degree abc correction in wave B, it now appears that EURGBP has entered a new intraday five-wave bullish impulse, which could drive the price back toward the July highs.
Yesterday, we identified a lower-degree abc pullback in wave (ii). Since then, the pair has been trading nicely higher within wave (iii) of “iii.” This suggests further upside potential, though traders should remain cautious of a possible subwave (iv) pullback before the move continues.

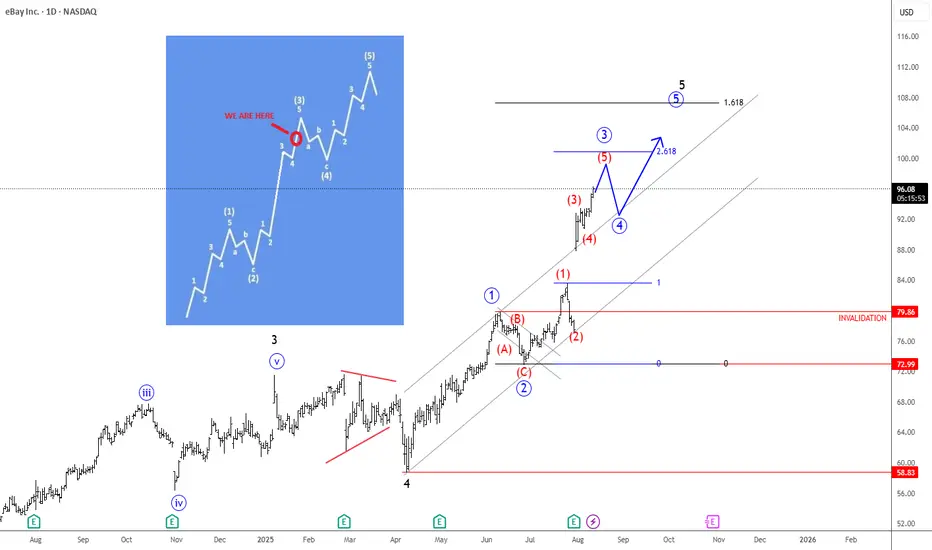
Ebay Extends The Rally; Pointing To 100 AreaEbay Extends The Rally within an impulse, which can push the price up to 100 area from technical and Elliott wave perspective.
Ebay is extending strongly higher after beating earnings at the end of July, which we see it as a wave 3 of an ongoing five-wave bullish impulse. Currently it can be trading in subwave (5) of 3 that can stop around 100 area, and from where we may see a new corrective pullback in wave 4, as eBay executives sell shares worth over 5.5million. So soon watch out for a new higher degree wave 4 pullback before the bullish trend for wave 5 resumes.
A bullish impulse in Elliott Wave Theory is a five-wave upward movement showing strong trend momentum. Wave 1 starts the advance, Wave 2 corrects part of it, Wave 3 is the longest and most powerful leg, Wave 4 consolidates without overlapping Wave 1, and Wave 5 is the final push before a larger correction. The key rules are: Wave 2 never fully retraces Wave 1, Wave 3 is never the shortest, and Wave 4 doesn’t enter Wave 1’s price zone. This pattern reflects shifting market psychology from early accumulation to final optimism.
Chfjpy start to look for buyFor chfjpy it is at the zone we should look for buy set up. Invalidation if the price breaks below 181.589. Target is toward 183 to 184.

Is Gold (XAUUSD) finally ready to rally?Gold has been in a corrective phase since April 2025. The broader complex correction or triangle formation now appears to be complete, and a high-probability bullish signal is emerging.
On the 1-hour chart, a clear 5-wave impulsive pattern has unfolded. I expect one more pullback to complete a 3-wave corrective move for Wave 2, ideally retracing toward the prior Wave 4 zone.
If this scenario plays out, it would provide a high-conviction entry ahead of a potential Wave 3 extension.
However, if price continues its current momentum and closes above $3,390 (the end of Wave 1), I’ll consider that Wave 2 may already be complete, in which case I would look to enter on confirmation of breakout strength (strong RSI reading).

Corrective Dip or New Downtrend on the S&P 500 Futures?🟣 1. Impulses vs. Corrections – The Classical View
When price trends, it doesn't move in a straight line. Instead, it alternates between directional movements called impulses and counter-directional pauses or retracements known as corrections. Most analysts define an impulse as a sharp, dominant move in the direction of the trend—typically accompanied by rising volume and momentum indicators. Corrections, on the other hand, tend to be slower, overlapping, and often occur with declining volume.
Common methods to identify impulses vs. corrections include:
Swing structure: Higher highs and higher lows suggest impulse; overlapping lows suggest correction.
Fibonacci retracements: Corrections often retrace up to 61.8% of a prior impulse.
Moving averages: Price above a rising MA is often viewed as impulse territory.
Volume analysis and oscillators such as RSI or MACD are used to confirm price behavior.
Despite the abundance of methods, the distinction between impulses and corrections often remains subjective. That’s where the Directional Movement Index (DMI) provides an objective lens—especially when paired with price action.
🟣 2. Rethinking Impulses with the DMI Indicator
The Directional Movement Index (DMI), developed by J. Welles Wilder, offers a quantitative way to assess the strength and direction of price movement. It breaks down market activity into three components:
+DMI (Positive Directional Movement Index): Measures the strength of upward movements.
−DMI (Negative Directional Movement Index): Measures the strength of downward movements.
ADX (Average Directional Index): Quantifies overall trend strength but is optional in this discussion.
The key to applying DMI lies in the crossover between +DMI and -DMI:
When +DMI > -DMI, upward price moves dominate—suggesting bullish impulses.
When −DMI > +DMI, downward moves dominate—suggesting bearish impulses.
Calculation is based on a comparison of successive highs and lows over a specific lookback period—commonly set to 14 or 20 periods.
While EMAs track trend direction and momentum, DMI helps dissect who’s in control. This makes it a powerful filter when evaluating whether a breakdown or breakout is likely to become an impulsive trend—or just another correction in disguise.
🟣 3. Case Study – Two Breakdowns, Two Outcomes
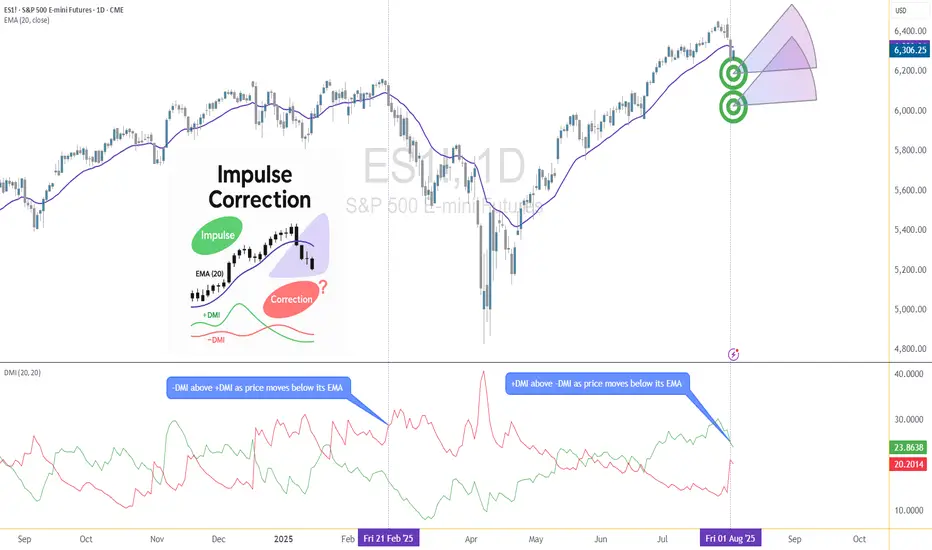
Let’s apply this logic to two recent moments on the E-mini S&P 500 Futures (ES) daily chart.
🔹 Feb 21, 2025 Breakdown
Price broke sharply below the 20-period EMA. At first glance, this looked like a potential trend reversal. The DMI confirmed this suspicion: −DMI surged above +DMI, signaling downside impulses were in control. The market followed through with a clear downtrend, confirming the move was not just a pullback—it was a shift in market structure.
🔹 Aug 1, 2025 Breakdown
A similar sharp break below the 20 EMA just occurred again. However, this time +DMI remains above −DMI, despite the bearish price action. This divergence tells a different story: the breakdown may not be impulsive in nature. Instead, it's likely a corrective dip within a broader uptrend, where buyers are still the dominant force.
This is a textbook example of how a moving average crossover without DMI confirmation can mislead traders. By combining these tools, we’re able to make more informed decisions about whether price action is signaling a true shift—or just a pause.
🟣 4. CME Product Specs – ES vs. MES
Traders can express directional views on the S&P 500 using two primary CME futures contracts: the E-mini S&P 500 Futures (ES) and the Micro E-mini S&P 500 Futures (MES). Both track the same underlying index but differ in size, capital requirement, and tick value.
✅ E-mini S&P 500 Futures (ES)
Symbol: ES
Contract Size: $50 x S&P 500 Index
Tick Size: 0.25 index points
Tick Value: $12.50
Initial Margin: Approximately $21,000 (varies by broker and through time)
Market Hours: Nearly 24/6
✅ Micro E-mini S&P 500 Futures (MES)
Symbol: MES
Contract Size: $5 x S&P 500 Index
Tick Size: 0.25 index points
Tick Value: $1.25
Initial Margin: Approximately $2,100 (varies by broker and through time)
The Micro contract provides access to the same market structure, liquidity, and price movement as the E-mini, but with a fraction of the exposure—making it ideal for smaller accounts or more precise position sizing.
🟣 5. Risk Management Matters
Understanding whether a market move is impulsive or corrective isn’t just academic—it’s the difference between positioning with the dominant flow or fighting it. Traders often get trapped by sharp moves that appear trend-defining but are simply noise or temporary pullbacks.
Using tools like DMI to confirm whether directional strength supports price action provides a layer of risk filtration. It prevents overreaction to every EMA crossover or sudden price drop.
Stop-loss orders become vital in both impulsive and corrective conditions. In impulsive environments, stops help lock in profits while protecting from reversals. In corrective phases, they act as circuit breakers against breakouts that fail.
Moreover, knowing the product you're trading is critical:
A single ES contract controls ~$320,000 of notional value.
An MES contract controls ~$32,000.
This disparity means poor sizing on ES can magnify errors, while proper sizing on MES can offer flexibility to test, scale, and hedge with tighter capital control.
Whether you're reacting to price or preparing for continuation, risk management is the only constant. It’s what turns analysis into disciplined execution.
When charting futures, the data provided could be delayed. Traders working with the ticker symbols discussed in this idea may prefer to use CME Group real-time data plan on TradingView: www.tradingview.com - This consideration is particularly important for shorter-term traders, whereas it may be less critical for those focused on longer-term trading strategies.
General Disclaimer:
The trade ideas presented herein are solely for illustrative purposes forming a part of a case study intended to demonstrate key principles in risk management within the context of the specific market scenarios discussed. These ideas are not to be interpreted as investment recommendations or financial advice. They do not endorse or promote any specific trading strategies, financial products, or services. The information provided is based on data believed to be reliable; however, its accuracy or completeness cannot be guaranteed. Trading in financial markets involves risks, including the potential loss of principal. Each individual should conduct their own research and consult with professional financial advisors before making any investment decisions. The author or publisher of this content bears no responsibility for any actions taken based on the information provided or for any resultant financial or other losses.
NIKE Confirms A Bullish Reversal With An Impulsive RecoveryWe talked about Nike on July 10 with our members, where we mentioned and highlighted a completed higher degree ABC correction in wave IV on the monthly and weekly charts.
Today we want to represent a closer view, as we see a five-wave impulsive recovery away from the lows on a daily chart. It actually confirms the bottom and bullish reversal, but since it can be trading in 5th wave that can stop around 80-85 area, we should be aware of a three-wave corrective setback soon. It can slow down the price back to the open GAP, so ideal buy zone is in the 70-60 area. Invalidation level is at 52.
Highlights:
Direction: Up, but watch out for a correction
Structure: Impulse, Wave 5 in final stages
Support: 70 / 60

GBPCHF - Classic 'W' PatternGBPCHF has been setting up for the next impulse phase as we can see common 'W' price action pattern which has made the last swing low in this reversal structure to see buyers step in and push price upward.
Always wait for confirmation, Good Luck

META Slows Down For A Correction Within UptrendMeta has seen a strong recovery recently, but barely retested February highs around 740, from where we can see some nice pullback, but it appears corrective, since it’s unfolding in three waves, and forming a potential bull flag — likely wave 4. A breakout above the downward channel on a daily close could signal the start of wave 5 and a push to new highs.
However, keep a close eye on the 666.1; a break below this level would invalidate the bullish view and suggest a deeper consolidation phase may follow.
Highlights:
Direction: Up (pending breakout)
Structure: Wave 4 bull flag; wave 5 possible soon
Support: 680 / 690

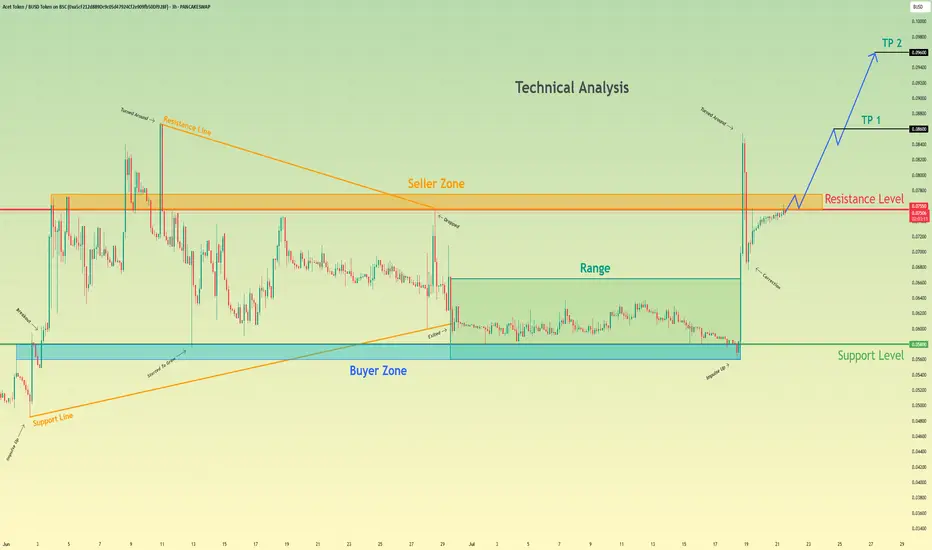
Acet Token will break resistance level and continue to move upHello traders, I want share with you my opinion about Acet Token. Looking at the recent price action, we can see a clear narrative unfolding. The asset initially formed a large wedge pattern, experiencing a trend reversal that led to a breakdown and a period of prolonged consolidation within a defined range between the buyer zone around 0.0580 and the upper boundary. Recently, however, the market showed a strong impulse, breaking out of this range and decisively moving upwards. Currently, the price of act is testing the key resistance level at 0.0755, an area historically defined as a seller zone. The hypothesis is that after this powerful impulse, the asset will manage to break and hold above this resistance. A successful retest of the 0.0755 level would likely signal a continuation of the uptrend, paving the way towards our specified take-profit targets. The first goal is set at TP 1 at 0.0860, with a further extension to TP 2 at 0.0960, capitalizing on the anticipated bullish momentum. Please share this idea with your friends and click Boost 🚀
Bitcoin Is Looking For A Bullish ContinuationMorning all! Bitcoin has impulsive characteristics on 4h time frame, and we can clearly see five waves up that can send the price even higher after recent projected ABC correction. With the current impulsive recovery back above 106k area, it confirms that bulls are still here and we should be aware of further rally in July, especially if breaks above channel resistance line near 110k area. Seems like it's in wave (1) of a new five-wave bullish impulse, so after current wave (2) pullback, we can expect more gains within wave (3).

GateChain Slows Down Within An Impulsive Bullish TrendGateChain with ticker GTUSD came slightly lower, but we still see it trading in a higher degree wave »iv« correction that can resume the bullish trend for wave »v«. It can be actually finishing final subwave (c) of a three-wave (a)(b)(c) corrective decline, so keep an eye on strong support here at the former wave (iv) swing low and 38,2% Fibonacci retracement. If we get sharp rebound and impulsive rise back above channel resistance line near 20 bullish confirmation level, then we can easily expect further rally within final wave »v« of 5 this year, which can push the price even up to 35 – 40 target area.
