Review and plan for 24th December 2025 Nifty future and banknifty future analysis and intraday plan.
stocks- shriramfin, nmdc.
This video is for information/education purpose only. you are 100% responsible for any actions you take by reading/viewing this post.
please consult your financial advisor before taking any action.
----Vinaykumar hiremath, CMT
Indianstockmarket

Axis Bank | Gann Square of 9 – 45° Reversal Case Study | 4 Apr 2This idea documents a historical intraday case study on Axis Bank Ltd, demonstrating how Gann Square of 9 degree levels act as precise resistance zones.
On 4 April 2022, Axis Bank initiated an upward move from the 0° reference near ₹767. Using the Gann Square of 9 calculation, the 45° projection was identified near ₹781.
Price advanced steadily and formed a high at ₹780.55, coming within 0.5 points of the calculated 45° level.
This reaction fell well within the acceptable tolerance range and resulted in a clear intraday rejection from the 45° degree zone.
📐 Key Gann Levels Observed
0° → ₹767
45° → ₹781
🧠 Concept Highlight
According to Gann’s price-degree structure, when price approaches a 45° level within the intraday time window, it often behaves as a temporary resistance or reversal zone.
This example shows:
Respect for angular resistance
Precision of degree-based levels
How small deviations can still validate Gann structure
Disclaimer:
This chart is shared for educational and analytical purposes only. It does not constitute a buy or sell recommendation.

Axis Bank | Major Gann Levels – Neutral Day Case Study
This idea presents a historical intraday case study on Axis Bank Ltd, highlighting how Gann degree levels help traders identify when to stay out of the market.
On 31 March 2022, Axis Bank respected Gann geometry on both the upside and downside, but no valid degree completion occurred, resulting in a neutral, no-trade session.
🔹 Downside Analysis
Initial 0° reference was marked near ₹760.95
Price moved lower but failed to reach 45° at ₹751
As per Gann Totaliser rules, no long trade was allowed
🔹 Upside Analysis
After rebounding near ₹751.30, this low became the new 0°
Upside 45° was calculated near ₹765
Price did not touch the 45° level
Hence, no short trade was triggered
📐 Major Gann Degree Levels Used
Upside Degrees
0° → 751
45° → 765
90° → 779
135° → 793
180° → 807
Downside Degrees
0° → 761
45° → 747
90° → 734
135° → 720
180° → 707
🧠 Key Learning
Gann’s method is not about constant trading.
When price does not complete a degree within time, the correct decision is no trade.
This session clearly demonstrates:
Respect for angular boundaries
Market neutrality
Discipline over prediction
Disclaimer:
This idea is shared strictly for educational and chart-analysis purposes only. It is not a buy or sell recommendation.

Axis Bank | Gann Square of 9 Intraday Case Study | 16 Sep 2022This idea documents a historical intraday case study on Axis Bank, analysed using the WD Gann Square of 9 to understand price behavior and logical reversal zones.
On 16 September 2022, Axis Bank opened with upward momentum, and the day’s low at ₹776 was taken as the 0-degree (0°) reference point.
Using Square of 9 calculations, the following degree-based price levels were identified:
0° → ₹776
45° → ₹790
90° → ₹804
As per Gann’s price–time relationship, when price approaches or completes the 45° level before the 2:30 PM time threshold, it often signals temporary exhaustion and a potential reversal zone.
At around 12:30 PM, Axis Bank reached the 45° level near ₹790 and faced clear rejection within the expected tolerance range. Following this, price reversed sharply toward the downside, reacting down to the ₹778 region.
This case highlights how degree-based price mapping, combined with time awareness, helps define structured intraday resistance zones, allowing traders to assess opportunities logically instead of reacting emotionally.
📌 Key Square of 9 Levels
0° → ₹776
45° → ₹790
90° → ₹804
📘 Educational Takeaways
Square of 9 helps quantify normal price capacity
45° often acts as a decision or reversal zone
Time confirmation improves probability
Structured levels reduce emotional trading
Disclaimer:
This idea is shared strictly for educational and chart-study purposes only. It does not constitute trading advice.

IS NIFTY IS READY TO GO UP?On the weekly timeframe, Nifty is currently trading at the support of its rising trendline and has also formed a rejection candle from this area. However, at the same time, the index is positioned near a major resistance zone, which is a strong historical selling area.
This creates a critical situation for the market. The key question now is whether the trendline support will be strong enough to hold Nifty, or whether sellers will dominate from this resistance zone.
If the market opens with a downside gap on Monday, there is a high probability of further decline towards lower support levels. Although bulls have made a strong attempt to keep the market elevated, bearish pressure may still overpower if selling momentum increases near this zone.
Overall, price action around the trendline support and the resistance zone will be crucial in determining the next directional move.
This analysis is for educational purposes only and not financial advice.

SBI Life Insurance: Breaking 420-Day Consolidation BUY Setup 🛡️
Entry: ₹1,936-1,945 (Current Level)
Target 1: ₹1,984-1,990
Target 2: ₹2,019-2,030
Target 3: ₹2,056-2,075 (Extended)
Stop Loss: ₹1,910
Technical Rationale:
MAJOR BREAKOUT after 420 days of consolidation (highlighted in cyan)
Breaking above long-term resistance at 1,930 level with strong momentum
Weekly chart showing powerful +5.27% surge
Volume buildup visible (highlighted) - institutional accumulation
Price breaking above descending trendline from 2024 highs
Trading above both EMAs indicating strong bullish trend
Rounding bottom formation on weekly - classic bullish reversal
High volume (5.03M) confirming breakout authenticity
RSI trending upward with room for further upside
Insurance sector showing relative strength
Clear support base at 1,876-1,910 zone
Risk-Reward: Excellent 1:4+ ratio
Pattern: Multi-month base breakout + Rounding bottom - extremely reliable bullish setup on weekly timeframe
Strategy: Positional/long-term - Book 25% at T1 (1,990), 25% at T2 (2,025), trail remaining 50% with SL at 1,950 after T1 achieved
Key Levels:
Breakout Zone: 1,930-1,945 (critical resistance broken)
Strong Resistance: 1,984, 2,019, 2,056
Major Support: 1,910, 1,876
Major Catalyst:
420-day consolidation breakout = huge pent-up energy
Volume accumulation phase complete
Financial sector strength
Disclaimer: For educational purposes only. Not SEBI registered. 420-day base breakout is significant - these typically lead to sustained moves. Weekly chart for medium to long-term position. Manage risk appropriately and conduct thorough research before investing.

Nifty50 hit the temporary resistance at the channel Nifty50 hit the temporary resistance at the channel, more pause for the upside

SANGAM (INDIA) LTD – Volume Breakout with Bullish MomentumCMP: ₹466.6
🟢 Buy Zone: ₹460–465 (on minor pullback or consolidation)
🎯 Targets:
Target 1: ₹481
Target 2: ₹490
Target 3: ₹497
🔻 Stop Loss: ₹447 (below recent swing low)
⏳ Duration: 5–10 trading days (short-term swing setup)
SANGAM (India) Ltd has shown a strong bullish breakout above the resistance zone with a surge in volume (see chart). The RSI reversal from mid-levels confirms renewed momentum. Sustaining above ₹457 could push price towards ₹490–₹497 levels in the coming sessions. A healthy retest near ₹460–₹465 offers a low-risk entry opportunity.
Risk–Reward: 1:2.5 (Favorable for short-term swing traders)
⚠️ Disclaimer:
This analysis is for educational purposes only and not financial advice. Always do your own research before investing or trading.

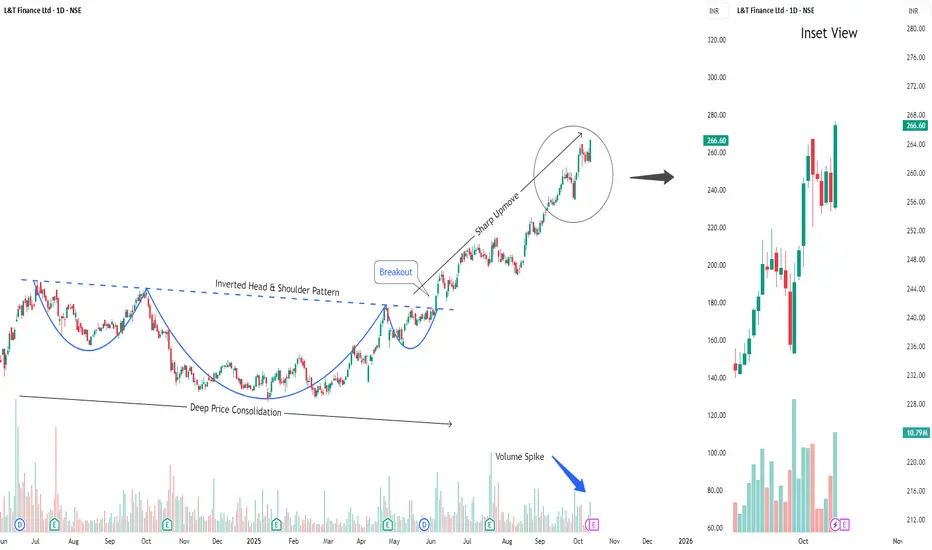
Buy L&T FinanceShort Term Trading Advice by Goodluck Capital
Buy L&T Finance
● Buy Range- 262 - 266
● Target- 280 - 285
● StopLoss- below 252
● Upside Potential- 6% -8%
● Approx trade duration 12 - 14 days
Buy Bharti AirtelShort Term Trading Advice by Goodluck Capital
Buy Bharti Airtel
● Buy Range- 2000 - 2050
● Target- 2120 - 2150
● StopLoss- below 1970
● Upside Potential- 5% -6%
● Approx trade duration 10 - 12 days

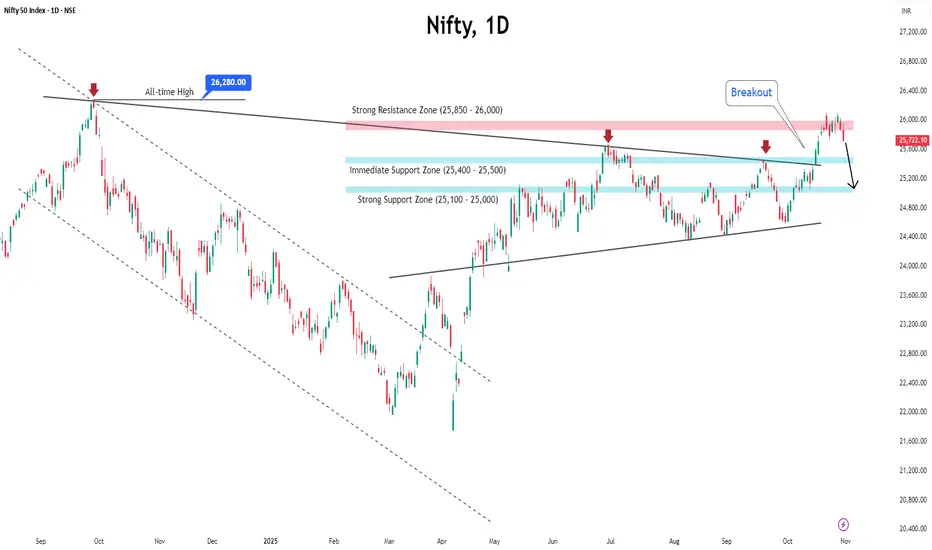
"Nifty Hits a Red Light After a Four-Week Sprint — What’s Next?"Indian markets finally took a breather after a four-week winning streak, ending the week marginally lower at 25,722.
The week began on an upbeat note, with the index advancing through the first three sessions. However, back-to-back declines in the last two days wiped out those early gains.
Even with this mild correction, October stood out as the best month in seven months, marking the strongest performance since March.
Technically, the index appears to be losing some steam after hitting a strong resistance near 26,000. This weakness could drag it toward the 25,400–25,500 support zone, and if the weakness deepens, a slide toward 25,000 cannot be ruled out.
On the fundamental side, one key factor to watch is India’s ongoing bilateral trade negotiations with the US, which are now in their final stages — a development that could sway market sentiment in the near term.
For traders, the strategy remains clear: stay stock-specific and adopt a buy-on-dips approach, as the broader market undertone remains constructive.
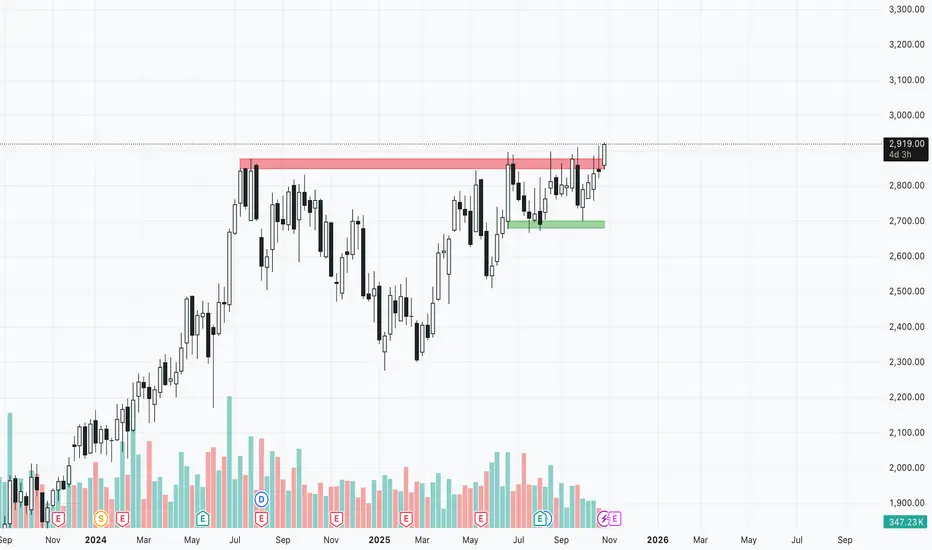
GRASIM - Weekly Breakout?Chart Analysis :
Price sustaining and breaking out above its major resistance of 2895-2910 zone. Price made a long consolidation of 67 weeks/ 15months and now breaking out.
Daily close above 2910-2920 will confirm breakout and can be considered for long.
Key Levels:
Entry level : Above 2920
Targets : 3000 psychologically imp level can move more if breaks out above 3000 (Trailing with day low SL post breakout is the suggested strategy)
StopLoss : Day close below 2820
Disclaimer:
I am not SEBI registered. This analysis is for educational purposes only and not investment advice. Please do your own research before trading or investing.
Nifty Hits the 26K Wall—Market Awaits the Spark for a Big LeapAfter six consecutive gains, the Indian benchmark Nifty paused on Friday and slipped slightly from its recent highs, mainly due to profit booking.
Despite the mild correction, the index still ended the week in green, registering modest gains — a sign that the broader market sentiment remains upbeat.
Meanwhile, The India VIX declined 0.30% to 11.59, pointing to subdued market volatility.
Technical View:
On the charts, Nifty attempted a breakout above the 26,000 mark but couldn’t sustain above it.
According to Open Interest (OI) data:
● Resistance: 26,000 remains the strong resistance zone, with heavy call writing indicating a supply wall.
● Support: The 25,500–25,400 zone holds firm as crucial support, backed by significant put writing activity.
Key Triggers for the Week Ahead:
1. US Fed Meeting (Oct 28–29)
Markets will watch closely as the Federal Reserve meets this week. Experts widely expect a rate cut to support growth and ease borrowing costs.
2. Q2 FY26 Earnings Season
The ongoing earnings season will continue to drive stock-specific moves as major Indian corporates announce their quarterly results.
3. US–China Presidential Meeting
Investors will keep an eye on global cues from the upcoming U.S.–China talks, which could influence global sentiment and trade outlook.
4. India–US Trade Deal Progress
Reports suggest India is close to finalising a trade pact with the U.S. — a move that could further boost investor confidence if concluded smoothly.
Looking Ahead
Nifty seems to be catching its breath within a tight range of 25,400–26,000. The bias remains positive, but a decisive breakout above 26,000 is needed to confirm fresh upside momentum.
Until then, traders should focus on stock-specific opportunities, manage risk tightly and stay agile — the next breakout could set the tone for November’s trend.

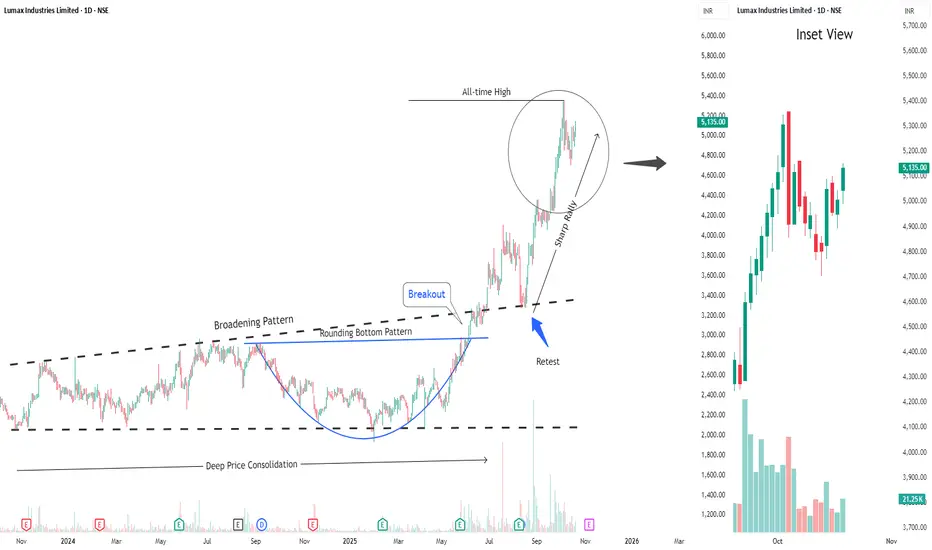
Buy Lumax IndustriesShort Term Trading Advice by Goodluck Capital
Buy Lumax Industries
● Buy Range- 5050 - 5150
● Target- 5350 - 5450
● StopLoss- below 4850
● Upside Potential- 5% -7%
● Approx trade duration 12 - 14 days
Weekly Market Wrap: Nifty Eyes All-Time HighsNifty closed the week at 25,709, gaining 400 points from the previous week’s close — marking another strong performance! It made a high of 25,781 and a low of 25,060.
As I highlighted last week, Nifty was expected to trade within the 25,700–24,850 range — and while it briefly broke out by 80 points, it closed right back within the range, showing controlled optimism.
Technical Outlook:
The monthly charts of both Nifty and Bank Nifty are now showing signs of forming a bullish W-pattern, which typically indicates trend reversal and strength. If Nifty manages to sustain above 25,900, we could see it rally towards its all-time high of 26,277, followed by the important Fibonacci level of 26,492.
On the downside, a pullback towards 25,450–25,500 could offer a great buy-on-dips opportunity for fresh long positions.
Next Week’s Range Expectation:
With a holiday-shortened week ahead (holiday on Wednesday and only a 1-hour trading session on Tuesday), expect Nifty to remain range-bound between 26,200–25,250. A breakout beyond these levels could spark some serious fireworks!
Big Picture View:
I continue to remain optimistic about India’s growth story. Over the coming years, I expect:
Nifty to reach 44,000+
Sensex to touch 1,44,000+
Of course, there will be healthy pullbacks and corrections along the way — offering smart investors a chance to accumulate at better valuations.
💡 Investment Ideas:
To participate in India’s long-term growth journey, consider systematic investments in:
NiftyBees, MidcapBees, SmallCapBees & GoldBees
Also, keep an eye on the Banking, Auto, and Infrastructure sectors — all showing strong bullish setups for the next few weeks.
Global Markets – S&P 500 Update:
The S&P 500 closed at 6,664, up nearly 110 points for the week, forming an inside candle on the weekly chart.
A move above 6,715 can push it towards 6,760 / 6,780 / 6,930 / 6,959 (key resistance levels).
On the downside, 6,555 and 6,384 are crucial supports — as long as 6,384 holds, it remains a buy-on-dips market for me.
Wishing everyone a very Happy & Prosperous Diwali!
May this festival of lights bring you wealth, wisdom, and winning trades!

Pre-Diwali Cheer on Dalal Street! Nifty Hits Fresh Yearly HighIndian markets extended their rally for a third straight session on Friday, October 17, with the Nifty hitting fresh one-year highs, spreading early Diwali cheer across Dalal Street.
With this surge, the Nifty 50 is now just 2.16% away from its all-time high of 26,277, reached in September 2024. October has been particularly strong, with the index closing most sessions in the green and posting month-to-date gains of 4.46%, its best performance since March 2025.
Key Drivers of the Rally
● Consumption Stocks Lead the Charge – FMCG and other consumption-oriented stocks gained as investors anticipate improved volume growth.
● Banking Sector Strength – A strong start to the earnings season, led by Axis Bank, boosted confidence with better-than-expected margins and improving asset quality. Nifty Bank NSE:BANKNIFTY even hit a fresh all-time high in the last session.
● Foreign Investor Support – FPIs turned net buyers, helping fuel the rally.
● Positive Macroeconomic Signals – Hopes of an India-U.S. trade deal and falling crude oil prices added to market optimism.
● Geopolitical Stability – Easing tensions in the Middle East reduced risk sentiment, supporting equities.
● Earnings Recovery Expectations – Investors expect H2 FY26 to see stronger earnings, aided by GST rate cuts and the RBI’s cumulative 100-basis-point repo rate reduction, boosting domestic consumption.
Technical Observations
Nifty has broken past the trendline resistance near its previous high of 25,670, signaling continued bullish momentum.
● Immediate support: 25,400–25,500
● Strong support: 25,000
● Resistance zone: 25,850–26,000
Outlook
Next week may stay muted as market holidays on October 21 and 22 could limit major moves. Nifty is likely to remain sideways with a slight bullish bias. Muhurat trading on Tuesday, October 21 (1:45 PM–2:45 PM) will serve as an early indicator of market momentum post-Diwali.

NIFTY 13th Oct'2025 | LONG | BULLISH Nifty : Bullish Trend
Long Entry
15m after sell-side lq sweep market likely move to bullish trend until above zone.

Nifty Pauses Below Resistance, Eyes Earnings-Driven MoveIndian markets closed on a strong note last week, with the Nifty rising over 1.5% to 25,285. The rally was led by IT sector (up nearly 5%) and PSU banks (up around 1.5%), reflecting sectoral strength during the earnings season.
The India VIX inched up 0.42% to 10.10, still near multi-month lows, though volatility may rise as corporate results roll in.
Technically, the Nifty is now testing a crucial resistance zone at 25,400–25,500, aligning with the apex of a large symmetrical triangle pattern. Open interest data shows heavy call writing at this zone, while strong put writing around 25,100–25,200 indicates immediate support. A decisive breakout on either side may set the tone for the next directional move.
Looking ahead, some consolidation or range-bound movement is likely as the market digests earnings and global developments. US–China trade tensions and semiconductor supply chain concerns may weigh on sentiment if risks intensify.
Given the current setup, traders are advised to adopt a cautious, stock-specific approach. While the broader bias remains positive, protecting profits and avoiding aggressive long positions until a clear breakout is confirmed would be prudent.

India 50 Major Market Caution Signs Emerging!Any time you see multiple head-and-shoulders patterns forming on the chart often signals serious trouble ahead.
Stay vigilant for a break in the right shoulder of this massive head-and-shoulders pattern currently developing.
As a macro trader, I focus on the big picture—economics and long-term trends. While markets like India and long-term trading don’t get much TV coverage, my aim is to shift your perspective and enhance your trading strategy.
Follow this post to track how multiple head and shoulders patterns and a rising bearish wedge evolve over time.
Let’s ignite your curiosity and elevate your overall trading and investing.
Like, follow, and subscribe to join me in tackling these wild markets. Let's get to 5,000 followers!

MOM30IETF Long positionMOM30IETF near resistance level, if this level breaks good chances of rally up
RSI level looks positive in long term 🟢

Positive Sentiment Drives Nifty Higher, Resistance in SightThe Nifty 50 closed the week on a positive note, rising nearly 1%, supported by strong macro cues and sectoral gains.
RBI Policy Boost:
The Reserve Bank of India kept the repo rate unchanged at 5.50% for the second straight meeting while raising FY26 GDP growth to 6.8% and lowering the inflation forecast — a move that lifted overall market sentiment.
Sector Highlights:
Banking stocks led the rally, with Bank Nifty up over 2% as private lenders like Kotak Mahindra Bank and Axis Bank posted solid gains.
Metals also shined, with Nifty Metal up 1.85%, driven by optimism over potential Fed rate cuts and a weaker dollar.
Key Levels to Watch:
Resistance: 25,000–25,100 remains a tough barrier. A breakout above 25,100 could spark a rally toward 25,400.
Support: 24,400–24,500 is the key zone to hold. A dip below this may trigger renewed selling pressure
Outlook:
The market is expected to consolidate within the current range, with sector rotation likely to drive short-term moves. Overall sentiment remains constructive as long as Nifty holds above key support levels.
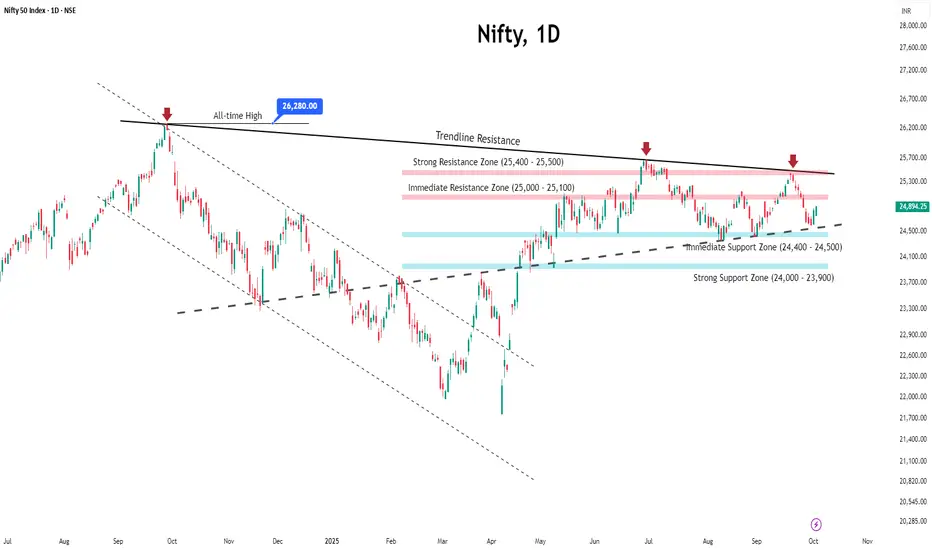
Market Mood Turns Sour as Nifty Slips Below 25KThe Nifty 50 ended its three-week winning streak with a sharp fall of ~2.6% , slipping below the crucial 25,000 psychological mark .
What Triggered the Decline?
● Global headwinds weighed on sentiment as trade tensions resurfaced, hurting risk appetite across equity markets.
● Domestic pressures coupled with persistent selling by foreign investors added to the weakness.
● Foreign Institutional Investors (FIIs) offloaded equities worth over ₹5,500 crore during the week.
● Concerns around a potential change in U.S. H-1B visa norms spooked the IT sector, a key driver of Indian exports.
Technical Backdrop
● The index has now fallen for 7 straight sessions , showing clear downward momentum.
● Immediate support: 24,400–24,500 zone. A break below this could drag the index toward the 23,900–24,000 strong support zone.
● Resistance levels: After slipping below the 25,000 mark, this level will now act as an immediate resistance. Strong resistance is placed at 25,400–25,500.
Market Outlook
With global uncertainties and foreign outflows, cautiousness and volatility are likely to dominate sentiment heading into October.
Strategy for Traders & Investors
● Maintain strict stop-loss discipline and manage position sizing carefully in this environment.
● For short-term traders: watch the 24,400–24,500 support zone for signs of reversal or breakdown.
● For investors: remain selective, focus on quality stocks, and avoid chasing momentum until stability returns.
