Indianstocks

ZEEL- BUYPlease stick to levels provided on the chart.
Please evaluate the possible risk in the position and only then enter the idea.
Carry 50% of original position, if buy triggered and first target completed.

LONG IIFL Finance (IIFL.NS) due to turnaround thesis
Fundamentals: Swung from loss to profit on margin recovery and credit normalization.
Technicals: Breakout from previous relevant swing highs with volume above 20SMA. Crossover with 30 EMA and 50 EMA.
I'm LONG IIFL Finance @ $649.30
SL or TP: When it closes below 50 EMA (WEEKLY)

Garware Hi Tech at key ResistanceGarware Hi Tech, Double Bottom "W" formation in play, weekly close above 4180-4220 and making it as support can see higher levels- possible 5700. Invalidation if breaks 4K and closes below on the weekly candle

Angel One Ltd | Weekly Chart | Compression Phase AnalysisAngel One has transitioned from a strong impulsive uptrend into a prolonged consolidation and compression structure. Price is currently trading inside a symmetrical triangle, indicating balance between demand and supply after a volatile expansion phase.
This is a classic volatility contraction setup on a higher timeframe.
Trend & Market Structure:
The stock witnessed a sharp vertical rally followed by heavy profit booking.
Post the top, price has been forming lower highs and higher lows, converging into a symmetrical triangle.
This structure reflects institutional digestion, not weakness.
The broader trend remains structurally bullish, but momentum is paused.
Pattern Insight
Pattern: Symmetrical Triangle (Weekly)
Nature: Continuation / Expansion setup
Implication: Directional move expected once price exits the structure decisively
Compression on a weekly timeframe often leads to large directional moves.
Key Price Zones:
Major Supply Zone (Upper): ₹3,700 – ₹3,850
→ Strong historical rejection
→ Long-term supply / distribution area
Intermediate Supply: ₹3,200 – ₹3,300
→ Multiple failed attempts
→ Acts as a trend-deciding zone
Triangle Support: ~₹2,200 – ₹2,300
→ Buyers consistently defending this area
Current Equilibrium Price: ~₹2,550
→ Midpoint of the structure
→ Decision zone
Final View
Angel One is coiling on the weekly chart after a massive expansion.
Such structures usually resolve with force, but direction is decided by breakout, not bias.
📌 Compression = Energy storage
📌 Breakout = Direction
📌 Volume = Confirmation
Educational analysis only. Not a buy/sell recommendation.

Chambal Fertilisers & Chemicals Ltd | Daily Chart | StructureChambal Fertilisers is currently trading inside a well-defined higher-timeframe demand zone after a prolonged corrective phase. Price action suggests the stock is attempting to stabilise after distribution, with clear levels now in place.
The stock was in a strong downtrend, marked by lower highs and lower lows.
Price has now entered a broad demand zone (~₹410–₹430) where buyers have historically stepped in.
Recent candles show base-building behaviour, indicating selling pressure is reducing.
This phase is best described as early accumulation / reaction phase, not a confirmed reversal yet.
Key Price Zones
Major Demand Zone: ₹410 – ₹430
→ Strong historical support
→ High-volume reaction seen earlier
Immediate Resistance / Supply: ₹455 – ₹470
→ Price has reacted here in the past
→ Needs a clean breakout to change bias
Upside Target Zone: ₹490 – ₹515
→ Previous supply area
→ Acts as logical mean reversion target if trend improvesShort-term EMA has started flattening, suggesting loss of downside momentum.
Final View
Chambal Fertilisers is no longer trending down aggressively, but it is not trending up yet.
The stock is in a high-impact structural zone, where patience matters more than prediction.
📌 Demand holding = opportunity building
📌 Breakout confirms strength
📌 Breakdown invalidates the setup
Educational analysis only. Not a buy/sell recommendation.

Indus Towers | Monthly ChartIndus Towers is currently trading near a major long-term resistance zone, which has historically acted as a supply-heavy distribution area. The current structure is important because price is no longer in a downtrend — it is transitioning into a range-to-trend decision phase.
Market Structure Overview
Price has completed a full mean-reversion cycle from multi-year lows.
Strong rally from the long-term demand zone (~₹130–₹150).
Current price is testing a decade-old resistance band (~₹460–₹500).
Structure resembles a range expansion attempt, not a confirmed breakout yet.
This makes the current zone a decision zone, not a chase zone.
Key Zones Identified
Major Resistance (Supply Zone): ₹460 – ₹500
→ Historical rejection zone
→ Multiple monthly wicks earlier
Intermediate Demand / Base: ₹330 – ₹380
→ Recent consolidation box
→ Acts as first support on pullbacks
Major Long-Term Support: ₹130 – ₹160
→ Multi-year accumulation zone
→ Structural bottom already validated
Volume Analysis
Expansion in volume during the rally from lows → accumulation confirmed
Volume contracted during consolidation → healthy pause
No extreme distribution volume near resistance yet
→ Suggests smart money is waiting, not exiting aggressively
Final View
Indus Towers is at a make-or-break level on the monthly chart.
The stock has recovered strongly, but confirmation is still pending.

Review and plan for 30th January 2026Nifty future and banknifty future analysis and intraday plan.
This video is for information/education purpose only. you are 100% responsible for any actions you take by reading/viewing this post.
please consult your financial advisor before taking any action.
----Vinaykumar hiremath, CMT

POSITIONAL IDEA - BAJAJ CONSUMER CARE Bajaj Consumer Care , part of the Bajaj Group and a well-established player in the Indian personal care segment, is currently presenting a positional trade opportunity, supported by a strong technical setup and improving price structure.
Reasons are listed below :
The 300 zone has acted as a strong resistance and has been tested multiple times, increasing the probability of a decisive breakout
Potential breakout from a triple bottom formation
Possible breakout from a consolidation phase of more than five years
Trading above both 50-week and 200-week EMAs, indicating strength in the long-term trend
Price structure remains bullish with higher highs and higher lows
Rising volumes suggest increasing participation and accumulation
Targets - 324 // 390 // 510
Stoploss - weekly close below 230
DISCLAIMER -
Decisions to buy, sell, hold or trade in securities, commodities and other investments involve risk and are best made based on the advice of qualified financial professionals. Any trading in securities or other investments involves a risk of substantial losses. The practice of "Day Trading" involves particularly high risks and can cause you to lose substantial sums of money. Before undertaking any trading program, you should consult a qualified financial professional. Please consider carefully whether such trading is suitable for you in light of your financial condition and ability to bear financial risks. Under no circumstances shall we be liable for any loss or damage you or anyone else incurs as a result of any trading or investment activity that you or anyone else engages in based on any information or material you receive through TradingView or our services.
@visionary.growth.insights

ABB-BUYPlease stick to levels provided on the chart. Trigger SL and Targets and please dont wait.
Please evaluate the possible loss before trying the idea.
Exit 50% on 1st Target and 25% each on 2nd and extended targets.

Silver Futures | Daily ChartSilver has moved into a vertical rally phase, showing strong momentum but now entering a possible EXHAUSTION GAP ZONE
Sharp impulsive move after accumulation
Price far extended from base → mean reversion risk
Volume expansion supports trend, but follow-through needs monitoring
Sustaining above this zone keeps the bullish bias intact
Failure to hold may lead to short-term consolidation or retracement
📌 Trend is bullish, but risk increases at higher levels.
Educational view only. Not a buy/sell recommendation.

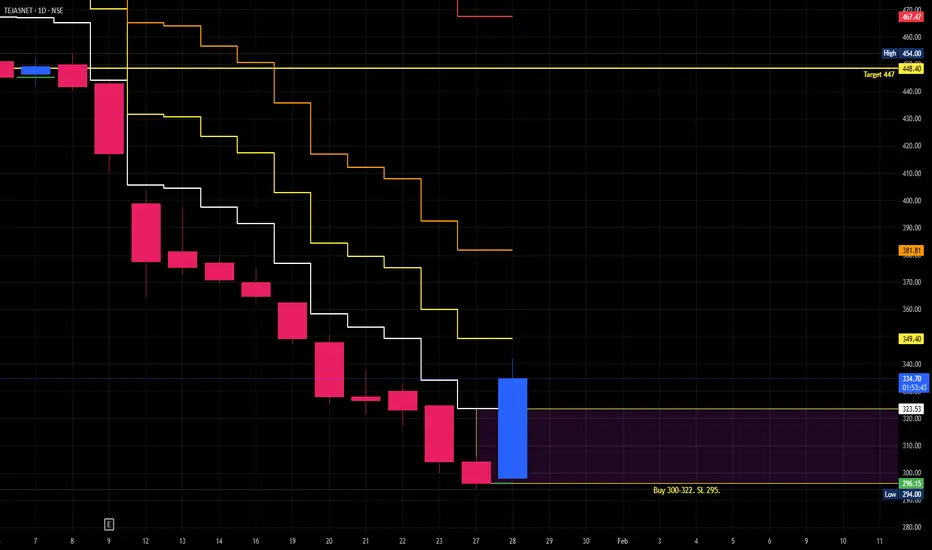
TEJASNET- BUY - HIGH RISKPlease stick to levels provided on the chart.
Evaluate possible loss, before venturing into the idea.
Markets are volatile and could result in sharp up and down moves, so please avoid, if u are strictly looking at from a trading perspective, since the buy involves some holding period.
HIGH RISK - BUY ZEELPls stick to the lvls given in the chart.
this is a very high risk long term possible double bottom confirmation for ZEEL.
but no need for it to hold so pls evaluate the risk before venturing for the BUY.
for extended target, hold 25% of original holding only.

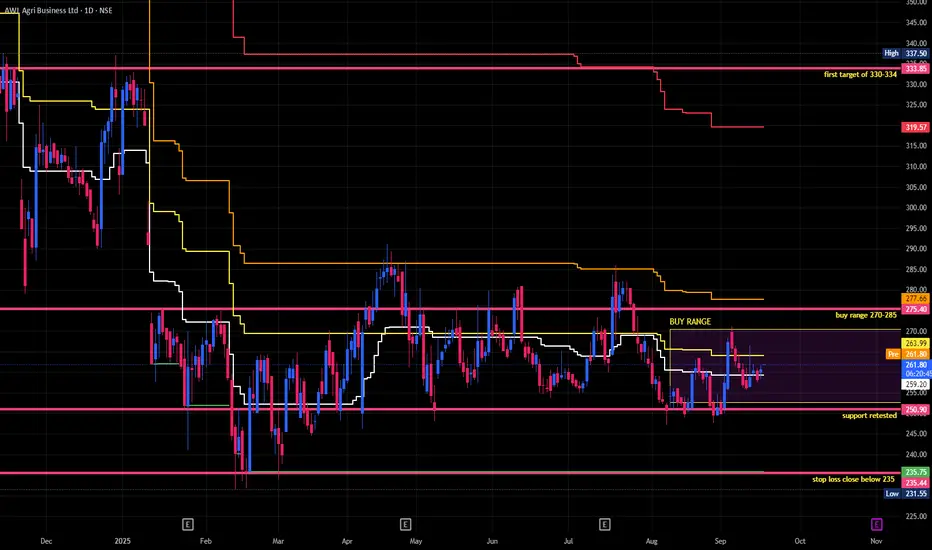
AWL-BUYPlease evaluate ur risk based on levels on chart. Please stick to them strongly and dont get trapped. Far better to trigger SL rather than Wait.
Book Profits, there will always be newer opportunities.
ShreeRenuka, BUYPossible Reversal. Please follow levels and directions provided on CHART. Please calculate risk/reward before initiating a trade.


ARE&MPls stick to levels on the chart.
Evaluate risk and possible loss before venturing into the idea.
Hold 25% of original for second target.
BUY 890-900. SL 830. Targets 1065, 1243.

Welspun corp- back to the trading channel, crucial levels nowAfter a breakout from the channel in Oct- Welspun Corp is now in the channel and testing the lower end. A break below that is going to be bad, added to it the STOCH RSI is likely to give a upward cross on the weekly and 2W chart, a buy at these levels has lower risk. Negation of this is the break below, which is a weekly close candle below the channel.
Keep a watch.

KPIT-BUYPlease stick to levels provided on the chart.
Evaluate possible loss before executing the idea.

InterArch- Trading Channel with supports and levelsInterArch- trading in a channel, higher highs and higher lows, Coming down now to support, 21W MA , buying zone has touched, should not break this channel else view is negated. Either ways if breaks down, should test the support zone, which can become resistance again where positions can be exited if breaks downward. DYOR

INDUSINDBANK - BUYPlease evaluate possible loss on trigger of SL, before venturing into the trade.
Please stick to the levels provided for Target and Stop-Loss.

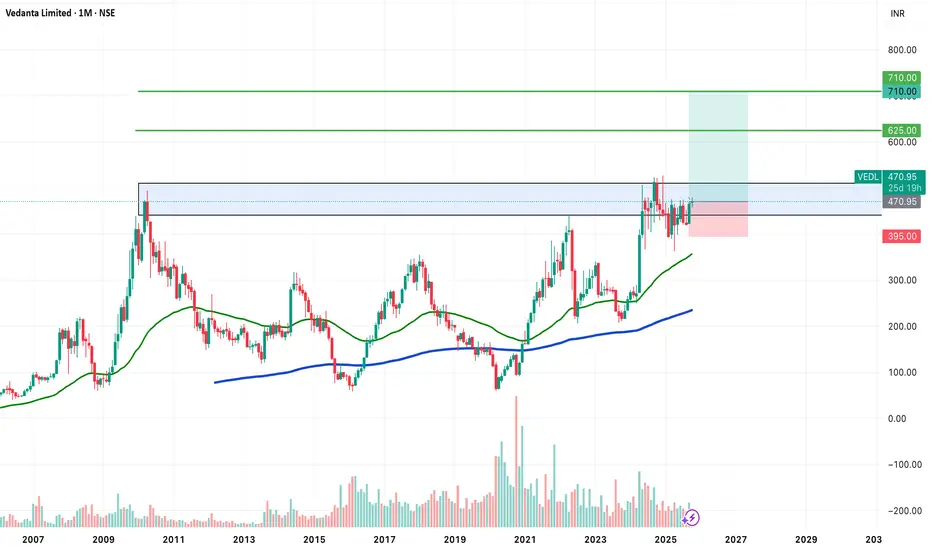
POSITIONAL IDEA - VEDANTA (VEDL)Vedanta Ltd , one of India’s leading diversified natural resources companies, is showing a strong long-term breakout setup supported by powerful technical signals.
Reasons are listed below :
Attempting a multi-year breakout after nearly 14 years of consolidation
Potential VCP (Volatility Contraction Pattern) breakout forming
Bullish engulfing candle on the monthly timeframe
Consolidating near all-time highs, showing strength in price structure
Trading above 50 & 200 EMA on both weekly and monthly charts
Maintaining a clear higher-high, higher-low trend structure
Target - 625 // 710
Stoploss - monthly close below 395
DISCLAIMER -
Decisions to buy, sell, hold or trade in securities, commodities and other investments involve risk and are best made based on the advice of qualified financial professionals. Any trading in securities or other investments involves a risk of substantial losses. The practice of "Day Trading" involves particularly high risks and can cause you to lose substantial sums of money. Before undertaking any trading program, you should consult a qualified financial professional. Please consider carefully whether such trading is suitable for you in light of your financial condition and ability to bear financial risks. Under no circumstances shall we be liable for any loss or damage you or anyone else incurs as a result of any trading or investment activity that you or anyone else engages in based on any information or material you receive through TradingView or our services.
@visionary.growth.insights
IDBI - Second Pick for 2026Ending week 1 of 2026 on a strong note. Taken out resistance of 108. Cup and Handle BO.
Targets: 119/133/175
Support: 108/101
SL: 101/84
Disclaimer: I have entered the trade around 109-110 today.
