"WTI Crude Oil – Bullish Bounce from Demand Zone? "🔵 . Demand Zone:
⬇️ 60.53 – 59.71
This is the buy zone where bulls are likely to step in!
Price is currently testing this area. Watch closely!
🛑 . Stop Loss (Risk Zone):
📉 Below 59.66
If price falls below here, exit the trade – demand has failed.
🎯 . Target Point:
🚀 63.85
This is the take profit zone. A successful bounce could reach this level!
🟠 . EMA (9-period DEMA):
📉 Currently around 60.86
Price is slightly below EMA, showing short-term bearish pressure.
🟢 . Trade Idea Summary:
• Enter near the blue demand zone
• SL below 🔴 59.66
• TP at 🎯 63.85
• R:R ratio looks favorable (low risk, high reward)
Outlook:
As long as price holds above the demand zone, this setup remains bullish 📈
Let’s see if the bulls can push it to that 63.85 target! 🚀💰
Indicators

"EUR/JPY Trendline Break & RBR Zone Setup"🔹 Trendline Breakout
* ✍️ A descending trendline was clearly broken
* 📉 This signals a shift from bearish to bullish sentiment
* 🚀 Potential for a strong move upward
🔵 RBR Zone (Rally-Base-Rally)
* 📦 Marked as a demand zone
* 🧲 Price dipped into this zone and bounced — bullish sign!
* ✅ Ideal entry area for long trades
🎯 Target Point: 164.208
* 📈 This aligns with a previous swing high
* 🎯 Potential move: +309.8 pips / +1.92%
* 🥅 Clear bullish target if the momentum holds
🛑 Stop Loss: 160.455
* 🧱 Placed just below the demand zone
* 💡 Gives the trade breathing room
* 🔐 Risk-managed setup
📊 Indicators & Price Action
* 📍 Current Price: 161.443
* 📈 Above the DEMA (9) = Short-term bullish
* 🟢 Price action supports long entry
Summary
* 📌 Bias: Bullish
* 🎯 Target: 164.208
* 🛑 Stop: 160.455
* ⚖️ Risk-Reward: Excellent (R:R ≈ 1:3+)

Gold (XAU/USD) Breakout Setup – Bullish Reversal from RBR Zone!🔹 Trade Idea: Long (Buy) Setup
📈 Targeting a price rally from a demand zone!
---
🔵 .ENTRY ZONE (Buy Area)
🟦 Marked between 3,039.773 – 3,043.052
📍 Located in the RBS + RBR zone (Resistance becomes Support + Rally-Base-Rally)
💡 Price dipped here and bounced — showing bullish intent
🔻 .STOP LOSS
🚨 Placed at 3,014.537
🛡️ Protects you in case the price drops below the zone
✋ Risk is clearly defined here
🎯 .TARGET POINT (Take Profit)
🚀 Aiming for 3,115.910
💸 A high reward area if momentum continues
🔥 Great R:R ratio (~1:3) — solid risk/reward
📊 .Technical Confirmation
📌 Price has moved above the 9-period DEMA (3,043.052)
⚡ Signals bullish momentum
🕯️ Strong bullish candles forming after the bounce — confirming entry.
🔍 .Market Structure Notes
⬇️ Previous trend was down
🔄 Now forming a potential reversal
🧱 Support holding strong near 3,014–3,030
✅ Summary: 💥 Buy idea from demand zone
🔝 Targeting new highs
🛑 Stop loss tightly managed
⚖️ Clean setup with momentum on your side

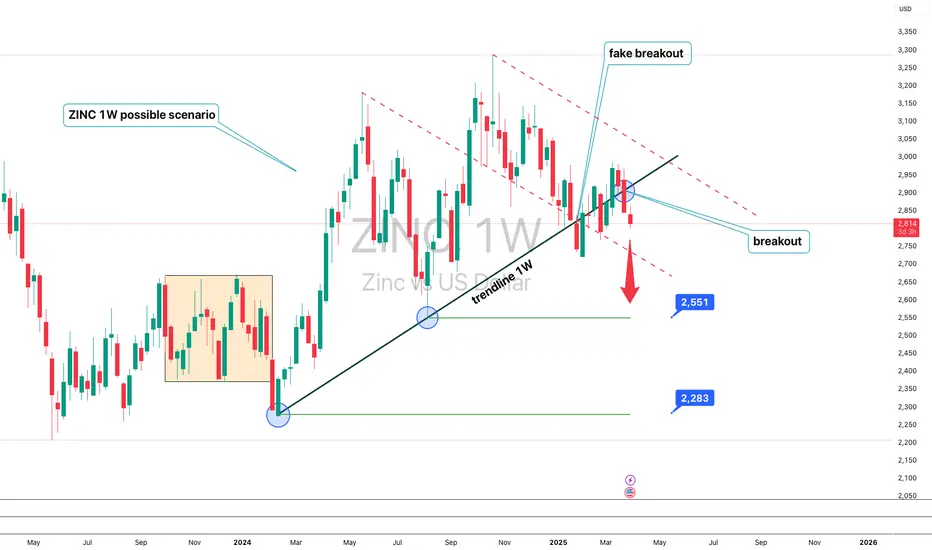
Zinc (ZINC) – Technical Analysis 1WThe price has broken below the 1W trendline, confirming a bearish scenario. After a fake breakout, the price moved downward and is now targeting 2551 and 2283. A breakdown below these levels could accelerate the decline. RSI shows weakening momentum, MACD signals a bearish crossover, and EMA 50/200 suggest further downside. Fundamentally, zinc prices depend on industrial demand, macroeconomic conditions, and USD strength. The main scenario is a drop to 2551 and 2283, while a recovery above 2900 could push prices toward 3100.
AUD/USD Bearish Trade Setup – Trendline Rejection & SBR Zone📉 Trendline & Market Structure
🔵 Downward trendline connects lower highs (🔴🔴🔴), showing a bearish trend.
🔵 Price is forming lower highs and lower lows, confirming the downtrend.
🟦 SBR Zone (Support Became Resistance)
🔵 SBR Zone (🟦) was previously a support but now acts as resistance.
🔵 Price is testing this area → Possible rejection and move down.
📌 Trade Setup
✅ Entry: Short (Sell) near SBR zone if rejection occurs.
❌ Stop Loss: 0.60650 (🔺 Above SBR Zone)
🎯 Target Point: 0.59150 (🔻 Downside goal)
📉 Potential Drop: -2.08% (-125.4 pips)
📊 Confirmation Checklist
✔️ Price must reject 🟦 SBR Zone.
✔️ Bearish candles like Pin Bars or Engulfing confirm entry.
✔️ DEMA (9) at 0.60175 → If price drops below, trade is valid.
⚠️ Risk Management
🚀 Good Risk-to-Reward Ratio → Worth considering if rejection occurs.
🔄 Invalidation: If price breaks above 0.60650, setup is canceled.

BTC/USD Long Setup – Bounce from Demand Zone Towards $80K TargetKey Zones
Demand Zone (Buy Zone)
🔵 $74,250 – $75,000
Strong support area
Buyers previously stepped in here
Marked for potential entry
Resistance Zone
🟣 $77,300 – $77,600
Mid-level resistance
Could cause a short pullback
Watch for breakout or rejection
Target Point
🎯 $80,273.49
Potential upside: +6.68% gain
Previous supply/structure zone
Take Profit (TP) zone
Stop Loss
⛔ $74,247.07
Just below the demand zone
Protects against invalid setup
Trade Idea
1. 🔽 Price expected to drop into demand zone
2. 🔄 Wait for bullish confirmation (e.g. bounce or engulfing candle)
3. 📈 Enter long position near $75,000
4. ⬆️ Ride it up through resistance
5. ✅ Target = $80,273 | ❌ Stop = $74,247

"Gold Price Rejection Setup – Trendline + Resistance Combo"XAU/USD 1H Chart Analysis 🪙📉
🔹 Trendline 📐
* Descending trendline marked by 3 touches
* Shows consistent bearish pressure
* Price is respecting it—watch for rejections
🔹 Resistance Area ⛔
* Blue zone between $3,014 - $3,025
* Strong supply zone—price failed to break it before
* Potential reversal zone if price touches again
🔹 Entry Point 🎯
* Suggested short entry at $3,014.29
* Just under resistance + near trendline
* Great spot for catching a downward move
🔹 Stop Loss ⚠️
* Placed at $3,025.13
* Above resistance = smart protection
* Keeps risk under control if breakout happens
🔹 Target Point 💰
* Take-profit marked around $2,964.45
* Down at a key support level
* Clean risk-to-reward around 1:5 (sweet setup!)
🔹 Moving Average (DEMA 9) 📈
* Dynamic resistance (line hugging candles)
* If price closes below, confirms bearish move
Summary ✅
This setup is a classic trendline + resistance short. You're betting on price respecting resistance and heading lower.
Bias: Bearish 🔻
Entry: $3,014.29
SL: $3,025.13 🛑
TP: $2,964.45 ✅

#Gold #xauusd(April9)Key levels ahead of gold prices have been charted. Focus on the buying zones!
Naturally, at each level, you can have buy and sell positions and you can freely use the levels for a new order or for TP of your postions. The levels are updated daily!
The results of price reaction to these levels will be shown in the upcoming videos.

USD/CAD Bearish Setup: Trendline Rejection & Supply Zone Trade📉 Trendline & Market Structure
🔵 Descending Trendline: The price has respected this trendline multiple times (🔴 red dots mark rejection points). This confirms a bearish structure.
📦 Supply Zone (Sell Area)
🟦 Blue Zone (Supply Zone): This is a strong resistance area where sellers may push the price down.
🚀 Price Rejected Here: Market reaction suggests potential bearish momentum.
⚠️ Stop Loss & Target 🎯
❌ Stop Loss (1.42308): If the price breaks above, the bearish setup is invalid.
🎯 Target (1.40437): Marked with a blue arrow 📉 indicating a downward move.
✅ Trade Plan
🔽 Sell Entry: Inside the supply zone
🛑 Stop Loss: Above the supply zone
🎯 Take Profit: At the lower blue level
This setup suggests a high-risk reward ratio favoring short positions. 📊 Keep an eye on the trendline and market reaction!

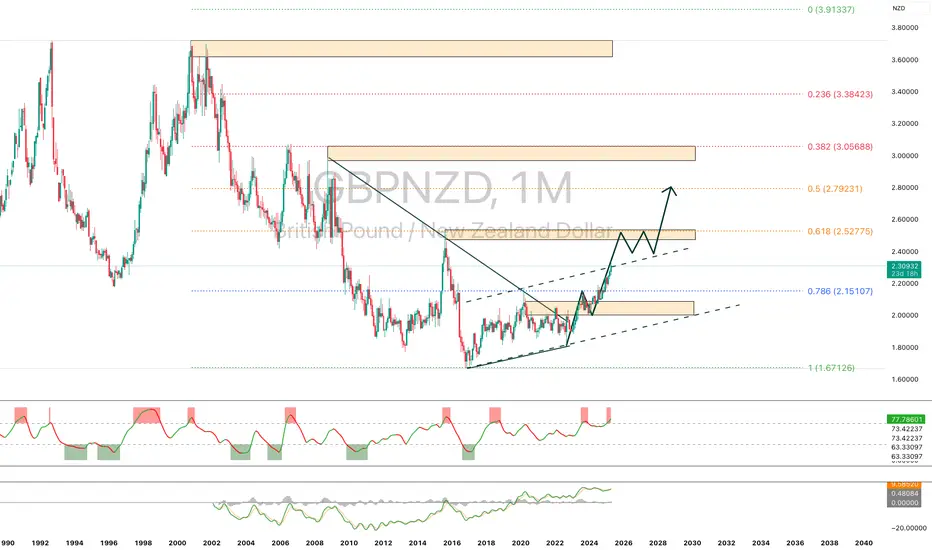
GBPNZD – Technical Analysis (1M)Following a breakout from a multi-year narrowing channel, GBPNZD has established a bullish trend above a key resistance level. Price is now approaching a major supply zone around 2.52–2.55, where a consolidation or pullback may occur. A breakout above this zone could pave the way toward the 0.5 Fibonacci level at 2.79 – a major upside target.
Momentum indicators are in overbought territory, suggesting potential correction or sideways action before further continuation. Chart structure indicates a potential bullish flag or accumulation range forming.
Main scenario: price pulls back to 2.42–2.45 before continuing upward to 2.79.
Alternative scenario: rejection below 2.30, leading to a deeper retracement toward 2.15.
U.S. Dollar Index (DXY) - Bearish Breakdown or Reversal?📊 U.S. Dollar Index (DXY) - 4H Chart Analysis
🔵 Supply Zone (104.400 - 104.683)
🟦 Resistance area where sellers may step in 📉
🟡 Key Level (~104.200)
🟧 Decision point – price struggling to hold this level
📉 Trend Line (Broken) 🔻
❌ Previous uptrend is broken, signaling potential bearish momentum
🟢 Demand Zone (103.200 - 103.400)
🟩 Support area where buyers may get active 📈
🚀 Potential Market Movement:
1️⃣ Bearish Breakdown Expected ⬇️
🔹 Price broke below trendline ➡️ selling pressure increasing
🔹 Possible pullback to key level (~104.200) before more downside
🔹 Targeting demand zone (~103.200-103.400) 🎯
2️⃣ Invalidation/Stop-Loss 🚫
🔺 If price moves back above 104.683, bearish setup is invalid
🔺 Stop-loss placed at 104.683 for risk management
🎯 Trading Strategy:
✅ Short Entry: After pullback near 104.200
🎯 Target: 103.200 demand zone
⚠️ Stop Loss: Above 104.683

USD/JPY 4H Chart Analysis:Trend Break & Support-Based Long Setup1. Previous Uptrend Channel
📈
Price moved in a rising channel
Lower trendline acted as support ✅
Then came the trend line break ⚠️ — signal of trend reversal
2. Major Drop
🔻💥
After breaking support, the price fell sharply
Strong bearish momentum took over
Sellers dominated the market
3. Support Zone Identified
🟦 Support Box (146.110 - 145.156)
Buyers stepped in at this level
Possible bounce or consolidation
Price currently at 147.014 — just above support
4. Trade Setup Idea
🛒 Buy Opportunity (if price holds support)
📌 Entry Zone: Around 146.110
🎯 Target: 150.260
🛑 Stop Loss: 145.156
📊 Risk:Reward = ~1:2 — solid R:R setup!
5. Indicators & Confirmations
🟠 DEMA (9): Sitting at 146.110 — aligns with support!
✅ Extra confluence for the bounce!
Summary
If price holds above support:
Buyers might push toward 150.260
If it breaks below 145.156:
Sellers may regain control

BRIEFING Week #14 : What a Mess !Here's your weekly update ! Brought to you each weekend with years of track-record history..
Don't forget to hit the like/follow button if you feel like this post deserves it ;)
That's the best way to support me and help pushing this content to other users.
Kindly,
Phil

CAD/JPY Bearish Setup Near Resistance – Rejection Incoming?📉 Trend Analysis:
The pair is in a downtrend, confirmed by the descending trendline.
Lower highs and lower lows indicate bearish momentum.
📌 Key Levels:
Resistance Zone (104.5 - 106.0): Marked in purple, this area has previously acted as support and is now a key resistance zone.
Support Area: Around 100.0 - 101.0, a psychological level where price may find demand.
📊 Trade Scenario:
Bearish Rejection Expected: Price is approaching the resistance zone and trendline confluence. If rejection occurs, a downward move towards 100.0 is likely.
Break Above? If price breaks above the resistance zone and trendline, bullish momentum could invalidate the bearish setup.
🔍 Conclusion:
Watching for rejection near 105.0-106.0 to confirm a short opportunity.
If rejection happens, next targets are 102.0 → 100.0.
A bullish breakout above 106.0 could shift momentum upwards.

Gold Price Analysis:Key Supply & Demand Zones with Potential Bkl🔥 Key Levels & Zones
🔵 Supply Zone (3,135-3,140 USD) 📉
Acts as resistance where selling pressure increases.
If price reaches here, expect a potential pullback.
🟢 Demand Zone (3,085-3,095 USD) 📈
Strong support area with buying interest.
Price has tested this zone multiple times = accumulation.
🎯 Target Point (~3,167 USD) 🚀
If price breaks out, it may rally towards this level!
❌ Stop Loss (~3,080 USD) ⛔
Marked below demand zone to limit risk.
---
📊 Trend Analysis
🔹 Trend Line Break ⚡
The price broke the previous uptrend = potential reversal or deeper correction.
🔹 Market Structure 🏗️
Price consolidating inside the demand zone = possible bullish move ahead.
🔹 Double Bottom Formation (DBF) at Supply Zone 🔄
Shows failed breakout attempts = strong resistance.
---
🔍 Indicators & Insights
📌 DEMA (9 close) at 3,099 USD 📈
Price hovering around this moving average = market indecision.
---
🚦 Possible Scenarios
✅ Bullish Scenario:
If price holds the demand zone & breaks above 3,110 USD, it could rally to supply zone (~3,135 USD).
A breakout above 3,140 USD could lead to the target zone (~3,167 USD) 🚀.
❌ Bearish Scenario:
If price breaks below 3,085 USD, it may hit stop loss (3,080 USD) and continue lower.
---
🎯 Trading Plan
🟩 Long Entry ➡️ Around 3,090-3,100 USD 📊
🛑 Stop Loss ➡️ Below 3,080 USD 🚨
🎯 Target ➡️ 3,135-3,167 USD 🎉

Bitcoin (BTC/USD) Trade Setup & Analysis🔹 Trend Analysis:
📉 The chart shows a downtrend followed by a reversal attempt.
📈 The price bounced off a support zone and is moving upwards.
🔹 Indicators:
📊 The 9-period DEMA (83,805.38) is slightly above the current price, acting as a resistance level.
🔹 Trade Setup:
🟢 Entry Zone: Around 82,943 (Current Price)
🔴 Stop-Loss: 81,183.22 ❌ (Below support level)
🎯 Target Point: 85,563.52 ✅ (Upper resistance level)
🔵 Strategy: The trade anticipates a price dip before

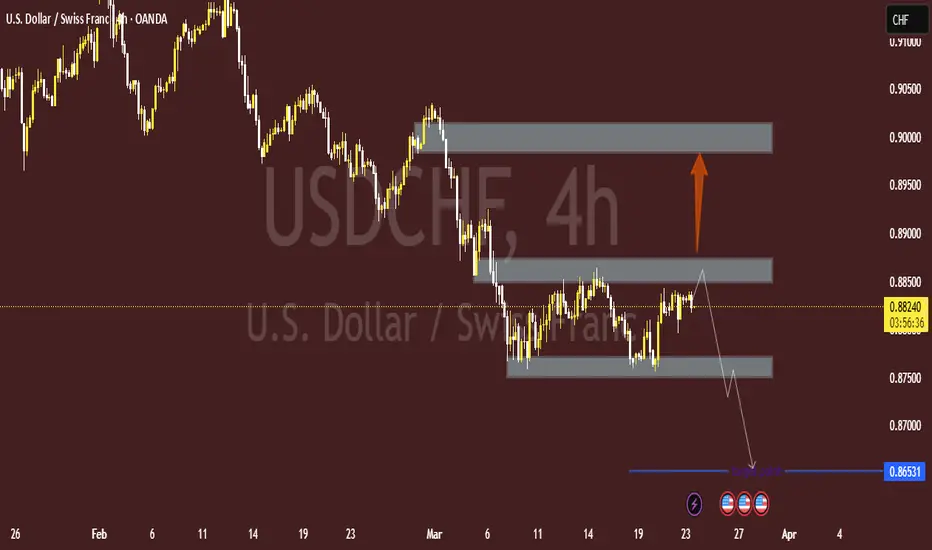
USD/CHF 4H Analysis – Key Levels & Trade Setup🔍 Key Observations:
📌 Supply & Demand Zones:
🔴 Upper Supply Zone (~0.9000): 🔥 Strong resistance where sellers might enter.
🟠 Mid Supply Zone (~0.8850): ⚠️ Key resistance where price is testing.
🟢 Lower Demand Zone (~0.8750): ✅ Possible support where buyers could step in.
📊 Price Action:
🔼 Price is currently at 0.88230 📍 near resistance.
🔽 If rejected, it might drop ⬇️ toward 0.86531 🎯.
🔼 If buyers win, it could rise to 0.9000 🚀.
📉 Bearish Bias Expected:
❌ Rejection at 0.8850 → Drop to 0.86531 ⏳.
✅ If it breaks higher, look for 0.9000 🎯.
🔎 Final Thoughts:
⚡️ Watch for reactions at 0.8850 📍.
🔹 Bearish confirmation? Sell ➡️ 0.86531.
🔹 Bullish breakout? Buy ➡️ 0.9000.
🎯 Trade wisely! 💰📉📈
Gold (XAU/USD) Bullish trend Demand Zone –Trend Analysis & ts🔵 Demand Zone (Support Area):
This blue zone represents a strong buying area where buyers are expected to step in.
If the price touches this zone and bounces, it confirms bullish strength.
📉 Trend Line Break:
The previous trendline has been broken ⛔, signaling a possible retest before a move up.
🛑 Stop Loss (Risk Management):
Positioned at 3,108.52 🔴, meaning if the price drops below this, the trade setup becomes invalid.
🎯 Target Point (Take Profit Level):
3,167.77 ✅ is the potential profit zone if the price moves upward from the demand area.
🟠 Expected Price Movement:
The orange dotted line 🔶 suggests a likely move:
1. Price dips into the demand zone (🔵).
2. Bounces back up 🔄.
3. Breaks minor resistance 🟦.
4. Rallies to the target zone 🎯.
Overall, bullish movement 📈 is expected if the demand zone holds! 🚀

Bitcoin (BTC/USD) Price Analysis: Bearish Breakdown Ahead?🔥 Bitcoin (BTC/USD) 1-Hour Chart Analysis 🔥
🔹 Trend Analysis:
🟡 Price was moving in an ascending channel 📈 but has broken below the trendline.
🟠 A retest of the broken trendline is happening, suggesting a potential drop 📉.
🔹 Trade Setup:
🔽 Short Entry: Expected rejection from the trendline.
❌ Stop Loss: $85,671 - $85,710 (Above resistance).
✅ Take Profit Target: $81,386 - $81,347 (Bearish target 🎯).
🔹 Indicators & Confirmation:
📊 EMA (9) at $84,254 → Acting as resistance 🚧.
🔄 Break & Retest Pattern → Typical for a bearish continuation 🛑📉.
🔹 Conclusion:
⚠️ Bearish Bias: If the price rejects the trendline, it could drop towards $81,386 🎯.
🚨 Invalidation: If the price breaks above $85,710, the short setup is canceled ❌.

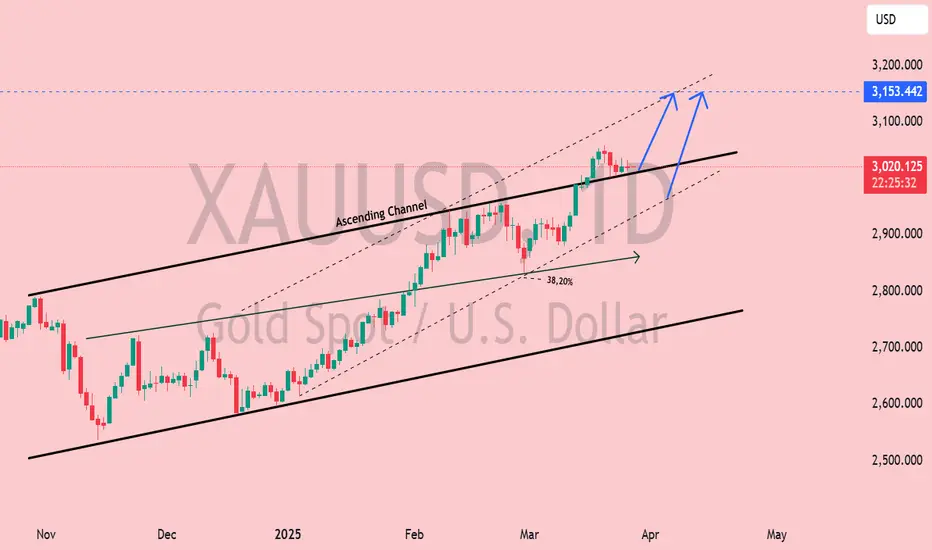
XAU/USD Gold Bullish Momentum – Targeting $3,153+?📊 XAU/USD Daily Analysis – Bullish Continuation in Ascending Channel
🔹 Market Structure & Trend Analysis
Gold (XAU/USD) remains in a well-defined ascending channel, respecting both dynamic support and resistance levels. The trend remains bullish, with higher highs and higher lows forming since late 2024. Currently, price is trading near the upper boundary of the channel, suggesting strong bullish momentum.
🔹 Key Technical Levels
Resistance Zone: $3,153 – $3,200 (potential breakout target)
Current Price: $3,020 (holding above key mid-range support)
Support Levels:
Channel Midline Support: ~$2,980
38.2% Fibonacci Retracement: ~$2,900 (potential corrective zone)
Channel Bottom Support: ~$2,700 (strong demand area)
🔹 Bullish Scenario 🟢
A break and close above $3,153 would confirm a bullish breakout, opening the door for a rally toward $3,200 and beyond.
Momentum remains strong, with price structure favoring continued upside as long as it stays above the midline of the channel.
🔹 Bearish Scenario 🔴
Failure to break above $3,153 could trigger a short-term pullback toward $2,980 - $2,900, where buyers may re-enter.
A confirmed breakdown below the ascending channel would invalidate the bullish setup and expose $2,700 - $2,600 as potential downside targets.
🔹 Conclusion & Trade Considerations
Bias: Bullish as long as price remains inside the ascending channel.
Entry Considerations: Retest of $3,020 - $2,980 as support could offer a high-probability long setup.
Breakout Confirmation: A daily close above $3,153 strengthens the bullish case for continuation.
Gold Spot (XAU/USD) Price Analysis – Key Zones & Potential Movem🔵 Key Price Levels:
Current price: 🟠 $3,130.99
DEMA (9): 🔵 $3,138.21
Target price: 🎯 $3,174.92
📌 Zones Identified:
🟢 Demand Zone (Support) ⬇️: Strong buying interest, potential bounce area. If price falls here, buyers may step in.
🟡 RBR Zone (Rally-Base-Rally) 🔄: A mid-level area where price could consolidate before moving up.
🔴 Supply Zone (Resistance) ⬆️: Sellers might emerge, causing a reversal or slowdown in price movement.
📈 Potential Price Action:
🔹 Scenario 1 (Bullish 🐂): A retrace to the RBR Zone 🟡 could lead to a bounce 📈 toward the Target 🎯 at $3,174.92.
🔹 Scenario 2 (Bearish 🐻): If price drops below the Demand Zone 🟢, it may signal a trend reversal 📉.
🔹 Breakout Confirmation: If price breaks above the Supply Zone 🔴, it may continue rallying 🚀 toward the target point.

Silver (XAG/USD) Price Analysis – Key Levels & Market Outlook🔍 Key Observations:
📊 Current Price: 34.19250 USD
📈 DEMA (9, close): 34.25605 USD
🎯 Target Price: 35.38940 - 35.5000 USD
🔵 Zones Identified:
🟦 Supply Zone: 34.50 - 34.80 USD (🔼 Selling pressure area)
🟦 RBS Zone: 34.00 - 34.20 USD (🔽 Potential bounce zone)
🟦 Lower RBS Zone: 32.80 - 33.20 USD (⬇️ Strong support)
📉 Market Scenarios:
✅ Bullish Case:
Price bounces off the RBS zone at 34.00 USD ➡️ Uptrend resumes 🚀
Target: 35.50 USD 🎯
❌ Bearish Case:
Breaks below 34.00 USD ❗
Next stop: 33.00 USD ⚠️
📢 Final Thoughts:
🟢 Buyers: Wait for a bounce at 34.00 USD before entering 📈
🔴 Sellers: Look for rejection at 34.50 - 34.80 USD or breakdown below 34.00 USD 📉
⚡ Key Level to Watch: 34.00 USD 👀 A hold = bullish 📊, a break = bearish ⚠️

Dow Jones 4H Chart Analysis: Support Test & Potential Reversal 📉 Downtrend: The price was falling sharply before forming an upward channel.
📊 Channel Break: The price broke below the ascending channel 🚨.
🟦 Support Zone: The blue area marks a strong support region 📌.
🔵 Bounce Expected? If the price holds, a rebound could happen 📈.
🎯 Target: The projected upside target is 42,758.3 🚀.
⚠️ Risk: If the support fails, the price may drop further ⛔.
🔴 Watch for: A confirmed reversal near support or further breakdown!
