ASX 200 Rallies into Resistance ClusterIt can be useful to monitor several renditions of the same market, in order to identify higher probability support and resistance levels. And I would personally argue this becomes the more important if one trades CFDs exclusively.
Today I am comparing the ASX 200 cash market (XJO) and ASX 200 futures market (SPI 200, or AP1!) alongside the forem.com AUS200 CFD.
All three markets are approaching a key resistance cluster around 8,000. Neither the cash market nor futures market has broken above 8,000 yet and have several resistance levels (including a 61.8% Fibonacci ratio while the March low and December high) remain unbreached. Also note that futures volumes have been declining while prices rise, which shows a lack of bullish initiation (and also points to a short-covering rally).
Therefore, my bias is to fade into moves on the AUS200 should it breach its own 8,000, with the short bias becoming invalidated with a break above the 61.8% Fib level.
Matt Simpson, Market Analyst at City Index and Forex.com
Indicies

Avoid Trading Indices on Long Weekends and Bank HolidaysTrading indices during long weekends or bank holidays can be risky due to lower liquidity and higher volatility. Many major financial institutions and market participants are away, leading to thinner trading volumes. This can cause exaggerated price swings, making it harder to execute trades at desired levels. Additionally, unexpected news or geopolitical events over the extended break can trigger sharp gaps when markets reopen, increasing the chances of significant losses.
Another key concern is the lack of immediate reaction time. Since markets are closed for an extended period, traders have no opportunity to adjust positions in response to breaking news. This can leave portfolios exposed to unforeseen risks. Spreads on indices also tend to widen during these times, increasing trading costs. For these reasons, it’s often safer to wait for normal trading conditions rather than risking unpredictable moves during illiquid holiday sessions.

JPN225 Short 1. This trade is against the trend
2. There are multiple patterns on all timeframes
3. This trade is oversold on all timeframes
4. There is a triple bottom on M15 with divergence
5. 200 Pip stop loss
6. First target at M15 overbought since this is counter trend
US30; Heikin Ashi Trade IdeaPEPPERSTONE:US30
In this video, I’ll be sharing my analysis of US30, using my unique Heikin Ashi strategy. I’ll walk you through the reasoning behind my trade setup and highlight key areas where I’m anticipating potential opportunities.
I’m always happy to receive any feedback.
Like, share and comment! ❤️
Thank you for watching my videos! 🙏

Possible push down for NAS100After A strong Bearish push, price action is filling the inefficiency left behind. Price is currently testing the structure lows previous support. The bearish move and retracement is the 78.6% PRZ
Wait for your lower time frame play to enter. This is an over all counter trend trade, however this could have a nice quick move down to retest the Daily previous structure high area of 21,843
Daily Chart has a Bearish Divergence that is playing out.
**Caution** on the macro bullish trend, this recent pull back retraced back to the 23.6 lvl with a wick while "retesting" the previous structure high on the H4 time frame....Enter with caution.

FTSE100 Short This is against the H4 and Daily trend
There are multiple patterns on M30, H1, and H4
All timeframes are overbought
There are multiple tops on M15, M30 and H1
Stop loss of 50 pips
Take half profit at M15 oversold

NASDAQ 100 (NAS100USD): Assessing the Potential BreakoutOver the past few months, the NASDAQ 100 (NAS100USD) has demonstrated a clear upward trajectory, marked by higher highs and higher lows—a classic sign of sustained bullish sentiment. However, we've seen periods of consolidation and recent volatility - let's take a look at its current technical landscape.
Current Market Overview:
As of January 29, 2025, the NASDAQ 100 is trading at approximately 21,600, a level that has served as a significant pivot point in recent trading sessions. A decisive move above this threshold could validate the ongoing uptrend and open the door to further gains.
Key Levels to Monitor:
Immediate Resistance : The 21,600 level is crucial. A sustained break above this point could signal the continuation of the bullish trend.
Support Levels : Should the price retreat, the 21,300 - 21,200 are notable support areas to watch.
Recent Developments:
The market has recently experienced heightened volatility, notably a sharp dip around January 27, followed by an aggressive recovery. This shows how unpredictable the market can be and hints at continued bullish movement.
Strategic Considerations:
Breakout Confirmation : A sustained move above 21,600, ideally accompanied by increased trading volume, would provide stronger confirmation of the breakout.
Support Retest : If the price successfully breaches the 21,600 resistance, this level could transform into a support zone. A subsequent retest of this level as support could present a compelling entry opportunity for long positions.
However , considering the Fed decision and fundamental factors around todays announcement - the most likely scenario would be slightly hawkish or a hawkish pause , which would be somewhat negative for the index. This would allow price to experience a temporary drop back down to the previous support (demand) level of 21,200 before buyers re-engage.
Trading Strategies:
Long Positions on Breakout Confirmation : A clear break and close above 21,600 could signal a long (buy) entry.
Long Positions on Retest of Support : A pullback to the 21,200 support level (assuming it holds) could offer a better opportunity to enter long positions.
Disclaimer:
This analysis is for informational purposes only and should not be considered financial advice. Trading involves significant risk, and it's essential to conduct your own thorough research and analysis before making any investment decisions. Past performance is not indicative of future results. Always use appropriate risk management techniques and trade responsibly. OANDA:NAS100USD IG:NASDAQ PEPPERSTONE:NAS100

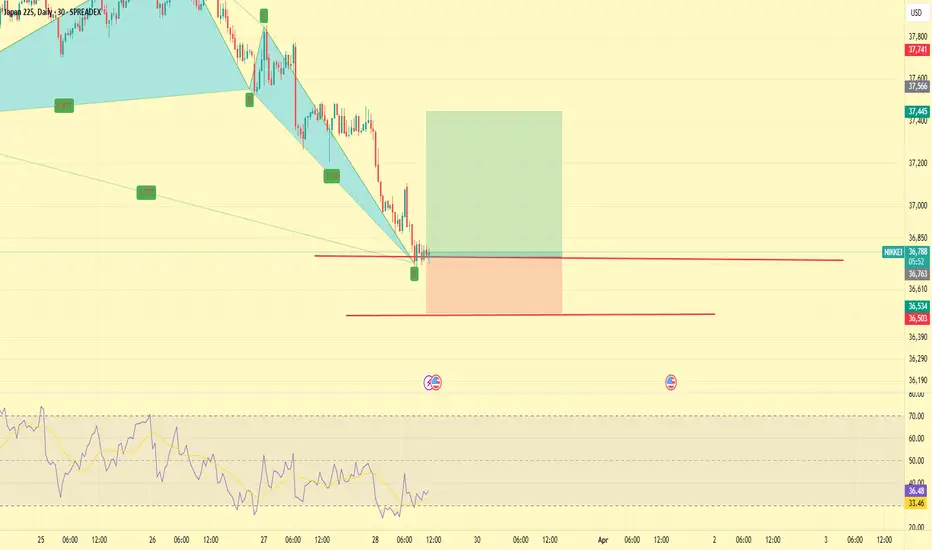
NIKKEI LONGThere is a pattern on M15, M30 and H1
This trade is with the H4 and Daily trend
Stop loss of 200 pips
Take first profit at M15 overbought

DAX H4 | Approaching all-time highDAX (GER30) is rising towards a multi-swing-high resistance and could potentially reverse off this level to drop lower.
Sell entry is at 20,510.80 which is a multi-swing-high resistance.
Stop loss is at 20,800.00 which is a level that sits above the 127.2% Fibonacci extension.
Take profit is at 20,013.22 which is an overlap support that aligns close to the 61.8% Fibonacci retracement level.
High Risk Investment Warning
Trading Forex/CFDs on margin carries a high level of risk and may not be suitable for all investors. Leverage can work against you.
Stratos Markets Limited (www.fxcm.com):
CFDs are complex instruments and come with a high risk of losing money rapidly due to leverage. 64% of retail investor accounts lose money when trading CFDs with this provider. You should consider whether you understand how CFDs work and whether you can afford to take the high risk of losing your money.
Stratos Europe Ltd (www.fxcm.com):
CFDs are complex instruments and come with a high risk of losing money rapidly due to leverage. 66% of retail investor accounts lose money when trading CFDs with this provider. You should consider whether you understand how CFDs work and whether you can afford to take the high risk of losing your money.
Stratos Trading Pty. Limited (www.fxcm.com):
Trading FX/CFDs carries significant risks. FXCM AU (AFSL 309763), please read the Financial Services Guide, Product Disclosure Statement, Target Market Determination and Terms of Business at www.fxcm.com
Stratos Global LLC (www.fxcm.com):
Losses can exceed deposits.
Please be advised that the information presented on TradingView is provided to FXCM (‘Company’, ‘we’) by a third-party provider (‘TFA Global Pte Ltd’). Please be reminded that you are solely responsible for the trading decisions on your account. There is a very high degree of risk involved in trading. Any information and/or content is intended entirely for research, educational and informational purposes only and does not constitute investment or consultation advice or investment strategy. The information is not tailored to the investment needs of any specific person and therefore does not involve a consideration of any of the investment objectives, financial situation or needs of any viewer that may receive it. Kindly also note that past performance is not a reliable indicator of future results. Actual results may differ materially from those anticipated in forward-looking or past performance statements. We assume no liability as to the accuracy or completeness of any of the information and/or content provided herein and the Company cannot be held responsible for any omission, mistake nor for any loss or damage including without limitation to any loss of profit which may arise from reliance on any information supplied by TFA Global Pte Ltd.
The speaker(s) is neither an employee, agent nor representative of FXCM and is therefore acting independently. The opinions given are their own, constitute general market commentary, and do not constitute the opinion or advice of FXCM or any form of personal or investment advice. FXCM neither endorses nor guarantees offerings of third-party speakers, nor is FXCM responsible for the content, veracity or opinions of third-party speakers, presenters or participants.

Bullish Continuation for SPX500After Trading in a small consolidation SPX looks to pick back up on its Bullish movement.
- Price has broken and now retesting bearish trendline.
-Price swept the lows of the liquidity and is now retesting the previous resistance of the zone.
The Retest is taking place at the H1 lvl resistance 5,903
- Rejection wick with an inside bar pattern
- There's a weak bullish divergence with the previous low.
-Wait for your entry signal

Quick Rally For 3030 Has Fallen to a High volume trading area reaching the point of control that could act as a strong support, added There's also a strong Hidden Bullish Divergence on the RSI that gives great indication that we could see a rally up from this daily support lvl (42,300) back to the "trend line" break & previous structure low,(Filling the sell side imbalance -FVG)
Confluences on This Trade
- Rejecting Daily support lvl 42,266
- Rejecting Demand zone
- @ 38.2 Fib Retracement
- Hidden Bullish Divergence (RSI)
- Buy Side imbalance fill
- Daily Volume Support
Lock in with your LTF Bullish Entry Signal,
WAIT FOR YOUR CONFIRMATION AND
**RISK ACCORDINGLY
Intro to the next possible move:
After this bullish move - price could reject the Trend line and previous structure low, then continue down.
**This bullish to bearish move would give price action a "Head and shoulders ish" Pattern on a HTF.
Caution on the Bearish Sell- we have high volume right below the 41,000 bank lvl that could act as a support.
with all of that being said the one thing that gives me great hesitation on the 2nd part of this move The "Bearish Sell" is the fact that this current pull back only brought price down to the 38.2 Fib lvl, so this could just be a minor pull back for a big Bullish continuation move.

GER40 SHORTThis trade is against the H4 trend but there is a lot of consolidation and it has a lot of structure at this level
There are multiple patterns on all timeframes
100 pip stop loss
Take profit at M15 oversold since this is against the trend

NAS100 Long This trade is with the H4 trend
There is a very strong movement up with indices these past few months
M15 and M30 are oversold and there are multiple bottoms with divergnece
Stop loss of 100 pips

Weekly Projection for NAS100NAS100 is steadily setting off to melt after the Big US election Last Week.
For now, I am going to extract my usual 1:2 masterpieces from this amazing NAS100 market...
Nevertheless, stay safe out there.
ASD0

Ger40 LongThere is a pattern on M15 to buy
This trade is with the H4 trend
THis is also with the Daily trend
double bottom on M15 with divergnece
100 pip stoploss

JPN225 LongThis trade is with the trend
There is no pattern
stop loss below the last structure
take profit at M15 overbought

OHLC Statistical Mapping + Average Range Levels Pre-Elections I expected big volatility prior elections and I entered at key time of the day 9:30 at key level +Manipulation. My Stop-loss was placed below 1/3ADR- and since I expected big volatility I targeted 5ADR

GER40 Short There is a pattern on M15 and M30
This trade is with the H4 trend
triple top on all timeframes with divergence
stop loss of 100 pips
Aim to take half profit at oversold

Fractal Consolidations Pre-Elections Shortprice swept after london session LRLR (blue box) High adn that was my entry Stop-Loss went above HRLR (red box) and I targeted Previous Week Low which was LRLR at the same time!

OHLC Statistical Mapping + Average Range Levels Asia LongI entered at +Manipulation since I was bullish from Daily timeframe SL put below 1/3ADR- and targeted +Distribtuion and the target was delivered at NewYork Killzone. Easy model purely mechanical.

H4 OHLC Statistical Mapping Text Book Short SetupFor the OHLC Statistical Mapping when you are bearish you use -M as a entry point and target -Distribution and that's it... don't overcomplicate it.

Fractal Consolidation Long Entry Trade RecapPrice swept LRLR (blue box) and overall I was bullish from the Higher Time-Frame then I waited when price breaks HRLR (red box) after price closed above HRLR I entered the trade and targeted another HRLR which was also Previous Week High.

Average Range Levels Money Print Long Model Bullish Model:
Entry: 1/3AWR-
Stop-Loss: 50% of 1/3AWR- & ADR-
Take-Profit: Buyside Liquiditiy (Old High)
