NAS100 Liquidity Grab & Distribution ExplainedNAS100 runs buy-side liquidity during active hours and fails to hold above premium supply. The move higher is corrective, not continuation. Under-hours price action suggests distribution, with lower highs forming and downside liquidity as the main objective.
📉 Bias: Bearish
Institutionaltrading

Gold analysisGold is soaring down and there is no similar occasion in history. I believe this was caused by social media popularity, which pushed gold and silver in an unhealthy way through an insane amount of leveraged positions. Institutions saw this as an opportunity, triggering a domino effect where every single position liquidated caused another liquidation, moving the price insanely down.
I can see from the chart that the price is touching a support level, but cumulative delta is not confirming the price. This suggests an exhaustion and that the price can push back up again. You can find these indicators on my profile, named Trendlines and Institution Radar.
Where do you think gold and silver will move next?

Order Block Theory: Trading Institutional FootprintsStop drawing random trendlines. Banks do not look at your diagonal lines. Banks trade based on Liquidity and Equilibrium.
If you want to trade like a relentless machine in 2026, you must learn to spot the "Footprints" that institutions leave on the chart. These footprints are called Order Blocks (OB).
Today, we are moving beyond "Support and Resistance" and entering the world of Smart Money Concepts (SMC).
1. What is an Order Block?
When a massive institution (like BlackRock or a central bank) wants to buy $100 Million of Bitcoin, they cannot just click "Buy." It would spike the price instantly, giving them a terrible entry.
Instead, they manipulate the price.
They Sell heavily to drive the price down into a liquidity zone (inducing panic sellers).
They absorb all that panic selling with their massive Buy orders.
The price explodes upward.
The Footprint: That final "Sell Candle" before the explosion is the Bullish Order Block. It represents the institutional point of interest.
2. How to Identify a Valid OB
Not every candle is an Order Block. A valid OB must meet three criteria:
Violence: The move away from the candle must be explosive. It should leave behind a "Fair Value Gap" (FVG) or Imbalance (a gap where price moved too fast).
Break of Structure (BOS): The move must break a previous High (for bullish) or Low (for bearish). This proves the institutions are in control.
Unmitigated: The price has not returned to this level yet.
How to Spot Valid and Invalid Order Blocks
Not every order block is worth trading. Some levels look good on the chart but fail quickly when price comes back. Common signs of a weak or fake order block include:
*Price didn’t move away clearly after the block formed
*No push beyond a nearby high or low before the move
*The zone has already been tested or traded through (mitigation block)
*Price returns and moves straight through with little or no reaction
*The move looks slow or messy instead of clean and decisive
Bullish Order Block
A bullish order block is a price area where buying showed up just before a strong move up. It often appears near the end of a downward move, close to the last bearish candle before price starts rising.
When price comes back to this area, it may slow down or bounce, which is why traders often see it as a potential support zone.
Bullish OB: The last Red Candle (Down) before a violent Green Move (Up).
Bearish Order Block
A bearish order block is a price area where selling showed up just before a strong move down. It usually forms near the end of an upward move, close to the last bullish candle before price starts falling.
Bearish OB: The last Green Candle (Up) before a violent Red Move (Down).
3. The "Cheat Code": How to Spot Them Automatically
If you are new to SMC, your eyes might trick you. It can be difficult to distinguish between a "random candle" and a "valid institutional footprint."
To solve this, I personally use a specialized tool to filter out the noise:
Tool: Tuffy SMC OB Indicator (by TuffyCalls).
Why it works: It automatically highlights only the Order Blocks that have caused a Break of Structure (BOS), saving you hours of chart time. You can find it in the public library or check my profile for the setup.
4. The "Mitigation" Strategy (Why Price Comes Back)
This is the secret sauce. Why does Bitcoin often crash, touch a specific line to the dollar, and then skyrocket?
The Logic: Remember step 1? The Bank Sold to drive the price down before they Bought. This means they still have Short Positions open that are technically in a loss as the price rockets up.
They must bring the price back down to their Order Block to close those Short positions at Breakeven before they let the price fly to the moon. This process is called Mitigation.
Your Trade:
Entry: You place your Limit Buy Order at the Top (Open) of the Bullish Order Block.
Stop Loss: Just below the Bottom (Wick) of the Order Block.
Target: The next major liquidity pool (previous high).
Conclusion
Trading Order Blocks requires patience. You are no longer chasing green candles; you are acting like a sniper, waiting for the price to come to you.
Retail traders chase the pump.
Smart Money waits for the retest.
Draw the block (or let the Tuffy SMC indicator draw it for you), set the alert, and wait for the footprint.

Why Gold Respects Supply and Demand ZonesA Complete Price Action Guide for XAUUSD Traders
Gold (XAUUSD) is one of the most technically respected markets in the financial world. Unlike many instruments that behave erratically, gold consistently reacts to supply and demand zones, making it ideal for price action and institutional trading strategies.
What Are Supply and Demand Zones?
Supply and demand zones are areas on the chart where large orders from institutions (banks, hedge funds, central banks) are placed.
Supply Zone: Area where strong selling pressure enters the market
Demand Zone: Area where aggressive buying absorbs selling pressure
These zones represent imbalances between buyers and sellers, not random lines.

USDJPY – Daily Distribution Phase On the daily timeframe, USDJPY is showing a classic distribution structure. Price made multiple tests into the highs (1st and 2nd test), swept liquidity, and filled the daily gap—a common sign of smart money unloading positions. Momentum is weakening, structure is compressing, and buyers are failing to push higher. This usually precedes a markdown phase, with price targeting lower inefficiencies and unfilled gaps below.
If this level continues to hold as resistance, the probability favors downside rotation toward the next major daily gap and demand zone.
📉 This is how institutions distribute before the drop — not random price action.
Pitch
I don’t trade indicators.
I trade structure, liquidity, and HTF logic like this.
If you want to:
Read distribution early
Stop buying tops
Trade with a clear HTF bias
👉 Follow me on TradingView and trade side-by-side with real market logic, not guesswork.

Forex Strategy: USD/CHF & EUR/USD (Trap vs. Failure Setup)The Setup: We are tracking a high-probability "Negative Correlation" setup on USD/CHF and EUR/USD (15m Timeframe), identified by the QuantFlow Algo.
We are strictly following the "Trap Success vs. Trap Failure" rule. We do not guess; we trade the breakout of the Signal Candle.
1. USD/CHF (Left Chart - Yellow Sell Signal):
Scenario A: Trap SUCCESS (Bearish)
Trigger: Break below the Signal Candle Low (0.78939).
Action: SHORT. Institutional selling is confirmed.
Scenario B: Trap FAILURE (Bullish Reversal)
Trigger: If price reverses and breaks the Signal Candle High (0.79032).
Action: SWITCH TO LONG. This indicates the sellers were trapped, and we ride the squeeze up.
2. EUR/USD (Right Chart - Blue Buy Signal):
Scenario A: Trap SUCCESS (Bullish)
Trigger: Break above the Signal Candle High (1.17766).
Action: LONG. Institutional buying is confirmed.
Scenario B: Trap FAILURE (Bearish Reversal)
Trigger: If price reverses and breaks the Signal Candle Low (1.17669).
Action: SWITCH TO SHORT. This indicates the buyers were trapped, and we follow the stop-loss hunt down.
Why this matters: Institutions often set "Traps" to grab liquidity before the real move.
If the Signal Candle holds, we follow the trend.
If the Signal Candle breaks the opposite way, it is often a massive reversal move.
Rule: We are neutral until the High or Low breaks.
Indicator Used: QuantFlow Algo: Institutional Trap & Reversal
Disclaimer: Trading Forex involves risk. These levels are for educational purposes.

Whale Watching: What Institutional Flow Actually Tells Us
In the Ocean of Markets, the Biggest Players Leave the Deepest Wakes
Most retail traders stare at price.
Serious traders watch who is behind the move.
In the era of AI and real‑time data, you don't have to guess what the "smart money" might be doing. You can read their footprints in volume, order flow, and on‑chain behavior — then decide whether to swim with them or stay out of the way.
Who Are the Whales, Really?
"Whales" aren't mythical creatures. They're large players whose orders are big enough to move the market:
Hedge funds and prop firms
Pension and mutual funds
Investment banks and market‑making desks
In crypto: early adopters, exchange wallets, protocol treasuries and large funds
They don't trade like retail because they can't . Size forces them to:
Enter and exit over time
Hide intent with execution algorithms
Use levels where liquidity is deep enough to absorb flow
That's why their activity leaves patterns you can study.
Why Following Flow Matters More in the AI Era
AI and automation haven't made whales less important — they've made them more efficient:
Execution algos slice large orders into small pieces
Smart routing hunts for the best liquidity across venues
Portfolio models rebalance at increasingly precise trigger points
That means big decisions (accumulation, distribution, hedging, de‑risking) still show up in:
Unusual volume where price barely moves
Levels that absorb wave after wave of orders
On‑chain flows into and out of exchanges (for crypto)
You don't need to know who the whale is. You just need to recognize when "someone big" is quietly changing their exposure.
Three Practical Ways to Spot Whale Footprints
Volume That Doesn't Match the Candle
High volume but small candle body can signal accumulation or distribution.
Repeated volume spikes at the same level hint at a large resting order being filled.
Order Flow and Liquidity Behavior
Blocks and icebergs: large orders sliced into many smaller prints at the same price.
Support that "refuses" to break despite aggressive selling.
Resistance that repeatedly rejects pushes higher.
On‑Chain Flows (Crypto)
Big transfers to exchanges often precede potential selling pressure.
Big transfers from exchanges into cold wallets often align with accumulation.
Concentration in a few wallets can increase systemic risk.
AI tools can monitor all this in the background, pinging you only when something unusual happens.
Thinking in Terms of the Accumulation/Distribution Cycle
Zoom out and you see the same story play out over and over:
Accumulation – Big players quietly build positions while sentiment is bearish.
Markup – Price trends higher as demand overwhelms supply.
Distribution – Whales offload to latecomers near highs.
Markdown – Price grinds or flushes lower as supply dominates.
You can't know every motive behind every print. But you can ask:
"Does the current behavior look more like quiet accumulation or organised distribution?"
"Is volume confirming or contradicting the move?"
"Am I buying from strong hands or selling to them?"
How AI Can Help You Track Whales Smarter
Instead of manually staring at raw volume all day, AI‑driven tools can:
Tag and classify large prints and block trades
Detect recurring absorption at key levels
Aggregate on‑chain flows into simple dashboards (net inflows/outflows)
Alert you when "unusual" activity appears relative to normal behavior
Your edge isn't memorizing every tick — it's designing the rules for what counts as meaningful whale activity, and letting systems watch for you.
Staying Grounded: What Whale Watching Can't Do
It can't guarantee direction — whales hedge, scale, and reposition.
It can't replace risk management — big players can be early or wrong.
It can't turn a bad strategy into a good one — it can only improve timing and context.
Treat whale analysis as an extra lens, not a green‑light signal by itself.
Your Turn
How much weight do you give to institutional flow in your trading decisions?
Do you focus more on volume, order flow tools, or on‑chain metrics if you trade crypto?
Share what has (and hasn't) worked for you — your process might help someone else stop swimming blind.

Why Institutions Trap Retail TraderThis video explains why institutions trap retail traders for liquidity by analyzing common price behavior around key levels. The discussion focuses on how liquidity builds near obvious highs and lows, why false breakouts and sudden reversals occur, and how institutional participation can create traps through market structure and order flow behavior.
The objective of this video is to build awareness around liquidity-driven moves and help understand market mechanics from an educational perspective, without offering any trading or investment recommendations.

GBPUSD – Institutional Sell Setup | Multi-TF Supply Confluence GBPUSD is approaching a high-timeframe supply zone, aligning with both fundamental headwinds and a clean technical distribution structure. This presents a high-quality 5.06R bearish swing setup, supported by imbalance fill, liquidity sweep, and multi-month supply alignment.
FUNDAMENTAL ALIGNMENT (Why GBP Should Weaken)
1. Diverging Monetary Policy
The Bank of England faces slowing growth and softer inflationary pressure.
The Federal Reserve remains comparatively restrictive, maintaining tighter policy expectations.
This divergence supports USD strength and GBP weakness.
2. UK Growth Momentum Slowing
Recent UK macro data reflects weakening consumer demand and slower business investment.
Markets are pricing in potential BoE easing earlier than expected → bearish GBP.
3. Risk Sentiment Favours USD
In periods of market uncertainty, capital typically flows into USD as a safe haven.
This adds further downside pressure on GBPUSD.
➡ Overall Macro Bias: Bearish GBPUSD
TECHNICAL ALIGNMENT (Why This Chart Is Bearish)
1. Higher-Timeframe Supply Zone (3M + Daily Confluence)
Price previously reacted strongly from the 3-Month supply zone, rejecting the 1.37 region with aggressive selling.
The current rally is a return-to-origin (RTO) into that same supply area.
2. Liquidity Sweep + Break of Structure
The previous swing high was swept, collecting buy-side liquidity.
Price then broke down, confirming major bearish structure.
This shift signals institutional distribution.
3. Clear Imbalance (IMB) Fill Target
Price is retracing toward a Daily imbalance before continuing the downward leg.
This creates a precise entry window within supply.
4. Trendline Manipulation
The ascending trendline was broken aggressively, and price is now forming a corrective pullback—classic institutional pattern before continuation.
5. High-Probability Entry
The entry aligns with:
✔ A retest of Daily supply
✔ IMB mitigation
✔ Liquidity sweep
✔ Bearish orderflow
✔ Trend continuation structure
Risk-to-Reward: 5.06R, offering strong asymmetric payoff.
TRADE PLAN
Bias: Short (Sell)
Entry: Daily Supply Zone (around 1.36–1.37)
Stop-Loss: Above recent swing high
Target: Revisit lower structure around 1.30 and below
R:R: ≈ 5.06R
TRADE MANAGEMENT PLAN (Institutional Framework)
1. Position Sizing & Risk
Risk 0.5%–1% per position (institutional-grade sizing).
If volatility expands near entry, reduce size proportionally.
No additional scaling until price confirms bearish intent.
2. Entry Execution
✔ Primary Entry:
Execute shorts inside the Daily Supply Zone (1.36–1.37), ideally at the mitigation of imbalance.
✔ Alternative Entry (Confirmation-Based):
If price shows:
rejection wicks
displacement to downside
BOS (Break of Structure) on LTF
then enter on the first pullback.
This allows flexibility while protecting against premature entries.
3. Stop-Loss Management
Initial SL remains above the liquidity sweep / swing high that anchored the distribution (structural invalidation).
Do not tighten SL before price confirms a macro shift, to avoid knockouts during liquidity grabs.
4. Scaling Strategy
No scale-in inside the supply zone (high manipulation area).
Scale-in only after confirmation, such as:
Clear bearish displacement
Lower timeframe BOS
Retest of broken structure
This maintains institutional discipline and preserves risk integrity.
5. Profit Taking Strategy
Use a systematic approach:
TP1 – Partial at 1R
Lock in early profit
Move SL to breakeven only after a clean break of structure (to avoid stop hunts)
TP2 – Major Target at the IMB Fill / Mid-Structure Area
Partial profit where price may temporarily react
Maintain runner for full swing move
TP3 – Final Target at 1.30 (Swing Objective)
This is the full 5.06R target
Exit remaining position here
Structure completes the macro bearish leg
6. Monitoring & Adjustment
Track key things:
A. Fundamentals
BoE statements
Fed policy tone
UK inflation and employment releases
If fundamentals shift toward GBP strength, consider tightening risk.
B. Price Behaviour
If price reclaims the supply zone and holds above structure → invalidate trade
If price consolidates under supply with weak bullish reaction → confirmation of bearish intent
7. Invalidation Criteria (Hard Exit)
Close the trade entirely if:
Daily closes above the supply zone
Structure forms a higher-high and invalidates the distribution
USD loses strength due to major macro shift (e.g., unexpected Fed easing)
No hesitation—professional traders exit mechanically based on rules.
8. Psychological Management
Expect volatility inside supply zones
Avoid emotional management (e.g., moving SL impulsively)
Follow your plan: execution > prediction
Focus on process, not outcome
9. Post-Trade Review
After completion of the 5.06R idea:
Archive chart
Record execution quality
Review entry precision, SL placement, and emotional discipline
Optimize model for future setups
Institutional traders always debrief.
Final Notes
This trade idea is built on multi-timeframe confluence, institutional orderflow, and macro alignment.
The setup remains valid as long as price stays below the Daily/3M supply structure and bearish orderflow persists.

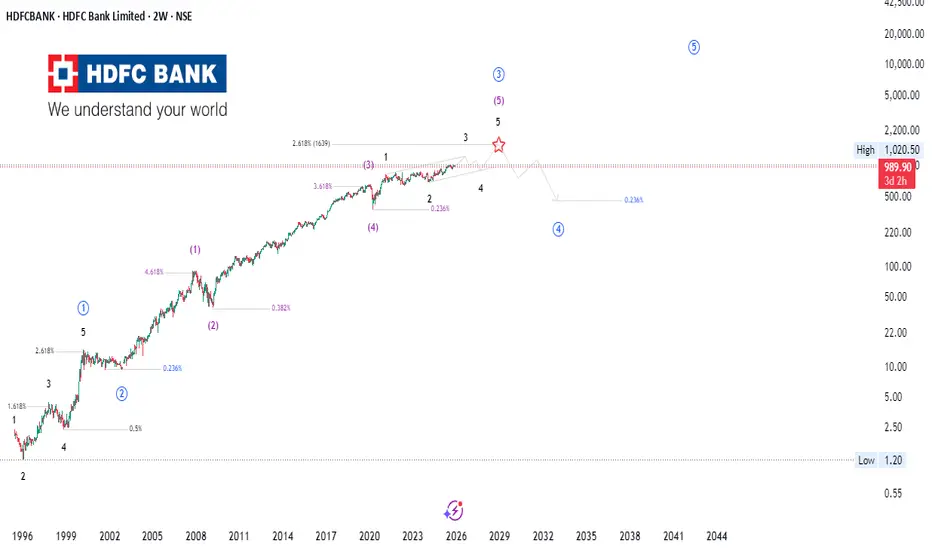
HDFC Bank | Wave-5 Exhaustion or Structural Re-Accumulation?This multi-decade chart of HDFC Bank reflects a compelling confluence of Elliott Wave Theory, Smart Money Concepts (SMC), Price Action, and Fibonacci symmetry —all signaling a maturing macro structure as the market approaches a probable Wave-5 terminal zone.
📈 Institutional Market Structure Outlook
The long-term advance appears to be unfolding within a clean 5-wave impulsive cycle , with the current structure showing:
Wave 3 projecting into the 2.618 extension zone—typical of strong institutional momentum.
A developing Wave-5 that aligns closely with prior impulse proportions, indicating possible trend exhaustion .
Clear structural higher highs and higher lows , yet momentum divergence around the projected terminal region (marked with ⭐), hinting at distribution.
🧠 Smart Money & Price Action Confluence
Price is entering a region historically associated with premium pricing —an area where Smart Money prefers to offload positions.
Multiple internal liquidity grabs near the highs suggest engineered wicks before a potential macro correction.
Market behavior resembles a buy-side liquidity sweep , followed by early signs of distribution on lower-timeframe structures.
🔢 Fibonacci Confluence & Market Cycle Alignment
Long-term impulses consistently respect 1.618 / 2.618 extension geometry.
The projected corrective leg ( Wave 4 ) aligns with the 0.236–0.382 retracement cluster, forming a probable demand re-accumulation zone.
Broader cycle rhythm hints at a transition from growth > distribution > mean reversion before Wave-5 completion.
🔮 What to Monitor Next
Reaction at the terminal Wave-5 zone
Breakdown of internal structure (SMC CHoCH/ BOS)
Volume profile shifts indicating institutional distribution
Retracement into the 0.236–0.382 macro demand zone for long-term opportunities
🚀 Stay Ahead of the Curve
For more institutional-grade analysis, follow our TradingView profile and turn on alerts 🔔 to never miss actionable insights on market structure, macro waves, and smart-money footprints.
⚠️ Disclaimer
This is not financial advice . The analysis is for educational purposes only. Markets are unpredictable—always conduct your own research before taking positions.
GBPJPY | Institutional Sell Setup – D1 & W1 Sweeps AlignGBPJPY has completed a multi-timeframe liquidity sweep, with both W1 and D1 sweeps aligning inside a premium price zone.
The structure has shifted bearish following a clear CHOCH and a rejection from the FVG imbalance area, confirming potential downside continuation.
🔹 Execution Bias: Instant Sell
🔹 Entry Zone: 202.60–202.80
🔹 Stop-Loss: Above 203.40 (protected high)
🔹 Target: 199.00 (liquidity zone)
🔹 Bias: Bearish
Technical Breakdown:
• Weekly sweep confirms distribution.
• Daily sweep adds confluence of liquidity grab.
• CHOCH at discount confirms bearish intent.
• FVG + refined OB = smart-money entry zone.
• Targeting inefficiency and old liquidity lows.

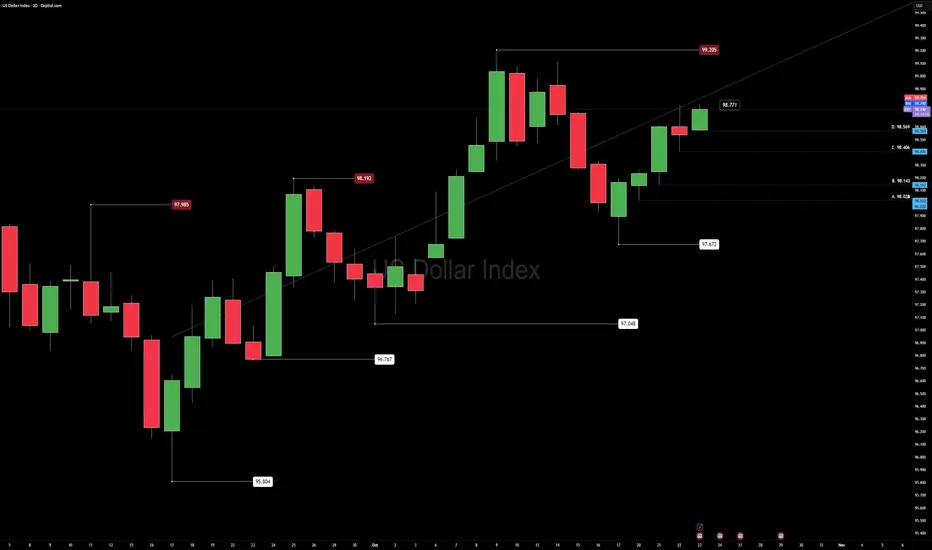
US DOLLAR AnalysisRespect the Higher Low: The Quiet Power of an Uptrend
U.S. Dollar Index (DXY) | 23 Oct 2025 | Pre–New York Session Outlook
By Daniel Fadeley
The U.S. Dollar continues to show a bullish bias, with higher lows forming consistently across both the weekly and daily structure. This ongoing strength keeps the broader tone positive for USD, while EURUSD and GBPUSD remain under cross-asset pressure.
We’re currently operating inside a bullish range with 97.672 as the range low and 99.205 as the range high.
Context
Momentum favors the dollar as buyers continue defending each pullback. If this month’s bullish structure holds, the market could confirm a longer-term upward phase.
However, conditions are slightly extended on Fibonacci sequence levels, suggesting reduced reward-to-risk for new swing positions until a clean retest offers better value.
Technical Map
Price took out yesterday’s high (98.771) and approaches the range ceiling at 99.205.
Volatility remains elevated through the week, and intraday momentum supports buy-the-dip behavior while daily lows continue to hold.
For cross-assets, this structure implies ongoing pressure on major USD pairs while the dollar holds above recent higher lows.
Fundamental Outlook
The week ahead features several key macro events:
U.S. GDP advance data
Core PCE inflation release
Multiple Federal Reserve speakers
Ongoing U.S. government funding discussions
Impact lens:
Yields rising → typically strengthens USD and tightens global liquidity.
Yields easing → can relieve pressure on risk assets such as equities and crypto.
Liquidity trends show ETF inflows slowing and capital rotating defensively, consistent with cautious macro positioning.
Plan
Current outlook remains bullish within range, focusing on position trades from defended lows and short-term rotational setups during volatility spikes.
Patience near 99.205 is key — a clean breakout with retest would confirm continuation; failure there could mean another controlled rotation inside the range.
Mindset
“Structure builds confidence. Clarity builds control.”
In fast markets, the goal is not prediction but preparation — follow structure, protect capital, and let confirmation lead conviction.
Educational use only — not financial advice.
Follow @CORE5DAN for calm, data-driven analysis and weekly structure lessons.
— CORE5DAN
Institutional Logic. Modern Technology. Real Freedom.
GBPJPY | Daily Sweep to 15M Supply ReactionDaily liquidity swept. 1H CHOCH confirms bearish shift — if price reacts instantly at 15M supply, that’s not luck, it’s smart money execution.
Watch for the retest to ride GBPJPY into the 179-pip inefficiency zone. 🩶
After a daily liquidity sweep, price printed a clear 1H CHOCH, confirming a bearish shift in market structure.
We refined our POI to the 15-minute supply zone, where displacement originated.
Now, if price taps this POI and drops immediately without forming a lower-timeframe CHOCH, that’s not invalid — it simply signals smart-money execution at origin.
When all higher-timeframe confluences (Daily Sweep ✅, 1H CHOCH ✅, 15M Supply ✅) align, the first tap can be the move.
That impulsive drop = institutional confirmation.
From here, we watch for:
🔹 Retest of 50–61% of the first impulsive leg for refined entry.
🔹 Targeting PDL (201.20) and extended inefficiency zone (200.0–199.8).
🔹 SL above the M15 POI high (~203.10).
“When the higher-timeframe story is complete, the market doesn’t ask for your confirmation — it just moves.”
— BFU-FX MARKETS
Bias: Bearish
Key Levels: 202.75
Target: 179-pip inefficiency fill

EURUSD Analysis : Rejection at Demand – Institutional Buy Setup🔍 Technical Storyline – What the Chart Tells Us:
🔸 1. Previous Bearish Structure – Descending Channel:
Price has been moving within a well-respected bearish channel, signifying structured sell-side liquidity control.
This channel served as a trap zone, where retail sellers were induced while institutions accumulated buy-side positions below the range.
The controlled movement inside the channel ended with a breakout to the upside, signaling a disruption in bearish control.
🔸 2. QFL Zone Formation – Manipulation & Liquidity Grab:
QFL (Quasimodo Failure Level) is evident in two phases here:
The first QFL acts as a reaction point where the market dropped to test demand and rallied aggressively.
The second QFL near the highs shows price swept previous liquidity before dumping, hinting at institutional profit-taking and possible redistribution into discount areas.
🔸 3. Central Reversal Zone (CRZ):
Price reversed sharply from this CRZ, which acted as a major supply level. The CRZ marks the top of the manipulation range.
This was a liquidity sweep targeting trapped long positions that entered too late at the highs.
🔸 4. Demand Revisit + Positive Rejection Pattern (Current Phase):
Price has now reached the MMC-validated demand zone, which previously launched a strong bullish move.
The long lower wick in the latest candle shows buyer absorption, suggesting early signs of a Positive Reversal Pattern.
This area is marked with high probability for bullish continuation, as it aligns with both technical support and smart money logic.
💡 Trading Plan & Market Mindset:
🔸 📈 Bullish Scenario (High-Probability Play):
Wait for bullish confirmation, such as:
Bullish engulfing on 1H/4H
Break of minor intraday structure (e.g., break of internal LH)
Strong volume surge from the zone
Entry zone: Within the demand block – 1.15500 to 1.15750
Stop-loss: Just below the demand zone (1.15250)
Target 1 (TP1): 1.16500 – minor intraday resistance
Target 2 (TP2): 1.17500–1.18000 – retest of QFL high and Central Reversal Zone
🔸 ❌ Bearish Invalidator:
A 4H candle close below 1.15250 would break the demand zone structure.
Invalidation of MMC reversal – move toward deeper liquidity (1.14500–1.14800)
🧠 Trader’s Psychology & Institutional Mindset:
Institutions often induce price spikes to trap both buyers and sellers.
This entire structure reflects classic accumulation → manipulation → distribution → reaccumulation.
The retest of the original demand zone allows institutions to re-enter at discount before pushing price back toward the highs.
“In MMC, patterns are not just shapes – they are footprints of institutional intent.”

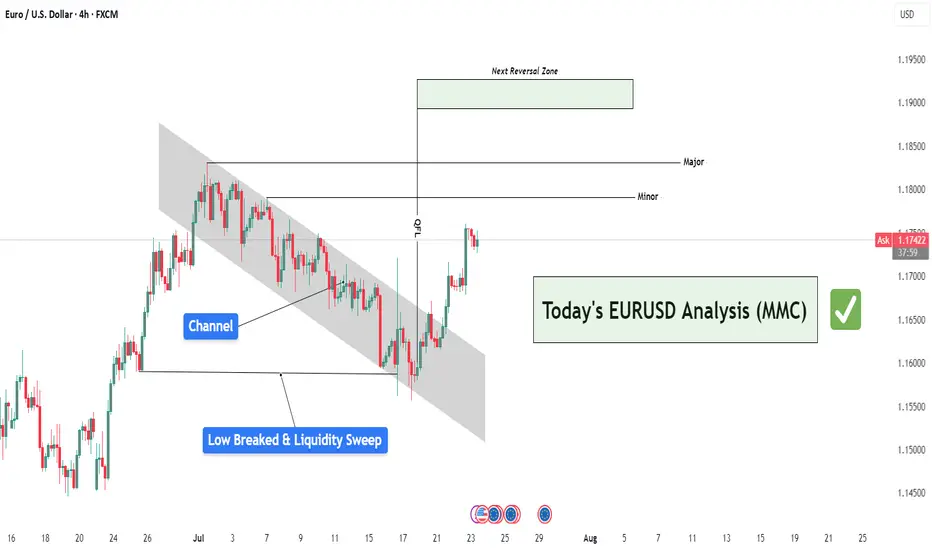
EURUSD Analysis : Liquidity Sweep – EURUSD Targets TO Reversal🧠 Institutional Context & Big Picture
EURUSD has been in a tightly controlled descending channel for several weeks—a classic sign of a market being engineered for liquidity collection. Rather than a naturally trending bearish market, this price action reflects stealth accumulation and market maker manipulation.
The channel structure was used to:
Establish a visible bearish trend (to trap sellers)
Trigger emotional bias for continued shorting
Build up stop orders below swing lows
This phase was about building energy, not continuation.
🔍 Detailed Breakdown of the Chart Elements
📌 1. Descending Channel – Controlled Manipulation
The pair moved within a well-defined bearish channel for multiple weeks.
Each touch respected the top and bottom perfectly—not random, but institutional structure.
It fostered retail confidence in the downtrend while market makers prepared for a reversal.
💥 2. Liquidity Sweep & Trap (Low Breaked & Liquidity Grabbed)
Price spiked below the previous low, clearly sweeping liquidity on July 21.
This is the "engineered breakdown", meant to trigger breakout sellers and stop out early longs.
Immediately after the sweep, the price violently reversed—clear evidence of a liquidity trap.
This is classic MMC logic: induce, trap, reverse.
🟩 3. QFL Base Formed – Bullish Engine Ignited
At the point of reversal, the chart shows the formation of a QFL (Qualified Liquidation Failure) zone.
This QFL base is the core of smart money accumulation—price broke below a base, then quickly reclaimed it.
It's not just support—it’s the true origin of the reversal and an optimal entry point.
📈 4. Breakout from the Channel – Structure Shift Confirmed
Price broke out of the descending channel with strong momentum, confirming:
Structure shift from lower lows → higher highs
Momentum shift in favor of bulls
Entry confirmation for MMC-based long setups
This breakout invalidates the bearish trend and signals a fresh leg up, likely toward unmitigated supply zones.
🟨 5. Current Price Action – Healthy Bullish Consolidation
After the breakout, price is consolidating just above the broken channel, forming a mini-flag or base.
This indicates:
Smart money is accumulating more
No significant selling pressure
Likely continuation toward next supply
🎯 6. Next Targets – Reversal Zones
Minor Resistance: ~1.1800
Major Resistance: ~1.1850 – 1.1880
Next Reversal Zone: 1.1900–1.1950
This zone is highlighted as a potential sell-off area where institutions may offload positions or create new traps.
Watch for signs of exhaustion or redistribution here.
📌 Trade Plan Based on MMC Structure
✅ Bullish Scenario (Currently Active)
Entry Area: Ideally at QFL base or breakout retest (~1.1700–1.1720 zone)
Confirmation: Bullish price action (engulfing, flag break, or liquidity wick)
Targets:
🎯 TP1: 1.1800
🎯 TP2: 1.1850
🎯 TP3: 1.1950 (Reversal Supply Zone)
❌ Invalidation:
A break below the QFL base (~1.1670) with bearish volume would invalidate the bullish MMC structure.
🧠 Smart Money Insight & Logic Recap
This entire move reflects a classic Market Maker Strategy:
Build a trend (descending channel) to shape trader bias
Trigger liquidity events (false breakdown)
Accumulate at the lows via QFL logic
Shift structure (channel breakout)
Target unfilled institutional supply (1.1850–1.1950)
This isn’t random—it’s engineered movement. Your job as a trader is to identify footprints, not follow the crowd.
The "True Close" Institutions Don't Talk About — But Trade On█ My Story from the Inside
I worked at a hedge fund in Europe, where I served as a Risk Advisor. One thing I never expected before joining the institutional side of the market was this:
They didn’t treat the current day’s close as the "true" close of the market.
Instead, they looked at the first hour of the next day — once all pending flows had settled, rebalancing was done, and execution dust had cleared — that was the true close in their eyes.
Here’s why that changed everything I knew about trading:
█ Institutional Reality vs Retail Fantasy
⚪ Retail traders are taught:
“The daily close is the most important price of the day.” But institutions operate under constraints that most retail traders are never exposed to:
Orders too large to fill before the bell
Internal compliance and execution delays
Batch algorithms and VWAP/TWAP systems that extend into the next session
So while the market might close on paper at 17:30 CET, the real trading — the stuff that matters to funds — might not wrap up until 09:30 or 10:00 the next morning.
Although the official “close” prints here, institutional volume ends quickly. It drops off sharply, almost immediately. Once the books are closed and final prints are done, big players exit — and what's left is thin, passive flow or noise.
The first hour of the New York session reveals structured flows, not random volatility. This is where institutions finalize yesterday’s unfinished business, which is why many consider this the “true” close.
And that’s the price risk managers, portfolio managers, and execution teams internally treat as the reference point.
█ Example: The Rebalance Spillover
Let’s say a fund needs to offload €100 million worth of tech stocks before month-end. They start into the close, but liquidity is thin. Slippage mounts. They pause execution. Next morning, their algo resumes — quietly but aggressively — in the first 30 minutes of trade.
You see a sharp spike. Then a reversal. Then another surge.
That’s not noise. That’s structure. It’s the result of unfinished business from yesterday.
█ Why the First Hour is a War Zone
You’ve probably seen it:
Prices whip back and forth at the open
Yesterday’s key levels are revisited, sometimes violently
Big moves happen without any overnight news
Here’s what’s happening under the hood:
Rebalancing spillovers from the day before
Late-position adjustments from inflows/outflows
Risk parity or vol-targeting models triggering trades based on overnight data
The market’s not reacting to fresh news — it’s completing its old to-do list.
█ What the Research Really Says About Morning Volatility
The idea that "the true close happens the next morning" isn’t just insider intuition — it’s backed by market microstructure research that highlights how institutional behaviors disrupt the clean narrative of the official close.
Here’s what the literature reveals:
█ Heston, Korajczyk & Sadka (2010)
Their study on intraday return patterns shows that returns continue at predictable 30-minute intervals, especially around the open.
The key driver? Institutional order flow imbalances.
When big funds can’t complete trades at the close, they spill into the next session, creating mechanical, non-informational momentum during the first hour. These delayed executions are visible as persistent price drifts after the open, not random volatility.
█ Wei Li & Steven Wang (SSRN 2010)
This paper dives into the asymmetric impact of institutional trades. It shows that when institutions are forced to adjust positions — often due to risk limits, inflows/outflows, or model-based triggers — the market reacts most violently in the early hours of the day.
When funds lag behind the clock, the next morning becomes a catch-up window, and price volatility spikes accordingly.
█ Lars Nordén (Doctoral Thesis, Swedish Stock Exchange)
In his microstructure research, Nordén found that the variance of returns is highest in the early part of the session, not at the close. This is especially true on days following macro events or at the end/start of reporting periods.
The data implies that institutions “price in” what they couldn’t execute the day before, making the next morning more informative than the actual close.
█ Bottom Line from the Research:
The first hour isn’t wild because it’s full of emotion.
It’s wild because it’s full of unfinished business.
These studies reinforce that price discovery is a rolling process, and for institutional flows, the official close is just a checkpoint, not a final destination.
█ How to Use This as a Trader
⚪ Don't assume the official close is final
Treat it as a temporary bookmark. Watch what happens in the first hour of the next day — that’s when intentions are revealed.
⚪ Volume in the first 30–60 minutes matters
It’s not noise — it’s flow completion. Often non-price-sensitive. Often mechanical.
⚪ Design strategies around “true close” logic
Test fade setups after the first hour’s range is established. That’s often the real “settled” level.
⚪ Use the first-hour VWAP or midpoint as a reference
Institutions may anchor to that — not the official close — for mean reversion or risk metrics.
█ Final Thought
The first hour is not the start of something new.
It’s the conclusion of yesterday’s market.
And unless you understand how institutions truly close their books — and how long that takes — you’ll always be a step behind.
So next time you see chaos at the open, stop calling it random.
👉 It’s just the market putting yesterday to bed — late.
-----------------
Disclaimer
The content provided in my scripts, indicators, ideas, algorithms, and systems is for educational and informational purposes only. It does not constitute financial advice, investment recommendations, or a solicitation to buy or sell any financial instruments. I will not accept liability for any loss or damage, including without limitation any loss of profit, which may arise directly or indirectly from the use of or reliance on such information.
All investments involve risk, and the past performance of a security, industry, sector, market, financial product, trading strategy, backtest, or individual's trading does not guarantee future results or returns. Investors are fully responsible for any investment decisions they make. Such decisions should be based solely on an evaluation of their financial circumstances, investment objectives, risk tolerance, and liquidity needs.

EURJPY Technical Breakdown (MMC Strategy) : Target Zone 🧠 Concept Focus: MMC – Mirror Market Concept
The Mirror Market Concept (MMC) helps identify pattern inversions, price reflection zones, and structural symmetry that hint at upcoming market turns. This chart reflects a curve-based reversal logic rooted in smart money behavior, volume analysis, and pattern exhaustion.
📊 Technical Structure Breakdown
🔹 1. Volume Contraction + Breakout (June 6–7)
Early signs of bullish pressure were detected with volume contraction, forming a tight range wedge/triangle.
This is often a liquidity trap where weak hands sell into strength.
Smart money absorbed sell-side liquidity before impulsively breaking out.
This is a common MMC move: contract > trap > expand.
🔹 2. 50% Area Used – Smart Money Trap (June 9)
After the breakout, price tapped into the 50% equilibrium zone of the previous major move.
This level often acts as a liquidity sweep zone, ideal for smart money to unload or build counter positions.
The rejection wick here confirms that institutional traders reacted at this level.
🔹 3. Curve Bending Pattern – Exhaustion in Play
The market has now entered a curve bending phase, visible with the arching price movement.
This signifies momentum exhaustion, where bullish attempts get weaker.
Think of this curve like a mirror ceiling — as each high gets tapped, it bends, showing the market can't sustain higher levels.
🔹 4. Next Reversal Zone (Projected Target: ~164.150–164.200)
Based on MMC symmetry and previous demand zones, the area highlighted as Next Reversal is a key structure zone.
This is where we expect price to react — either bounce (for buyers) or break (for continuation shorts).
A clean bounce here could mirror the earlier pattern in reverse, hence the Mirror Market Concept.
🔁 Summary of Market Psychology
🧲 Volume contraction signals manipulation.
🎯 50% zone rejection shows trap completion.
🪞 Curve bending shows buyers losing strength.
🔻 Price likely to drop into the reversal zone, completing the mirror leg.
🧩 What Traders Should Watch
Indicator/Zone Notes
50% Area Used Smart Money Exit or Entry Trap
Curve Bending Reversal Geometry (Momentum Exhaustion)
Next Reversal Zone Smart Money Demand Zone (~164.150)
Break Below 164.100 Confirms deeper bearish continuation
🎯 Trading Strategy Outlook
🔍 Short Bias: Look for confirmation (e.g., bearish engulfing, BOS on lower TFs) to enter shorts below curve zone.
🛑 Invalidation Level: Clean breakout above 165.500 would invalidate the mirror structure and shift to continuation long.
🎣 Reversal Scouting : If price respects the Next Reversal Zone, there could be a potential long scalp back into mid-range.
🧠 Educational Note: MMC in Action
The Mirror Market Concept is powerful for intraday trading. It uses pattern reflection, liquidity logic, and price symmetry to forecast reversals before typical indicators catch up. If mastered, this concept can give early reversal entries and trap avoidance.

JPYUSD Smart Money VIP Analysis – Eyeing High-Probability Target📈 Market Context:
The JPYUSD (Japanese Yen vs. US Dollar) is currently navigating through a critical structure phase where price is reacting to previously established institutional zones. Recent price movements reveal a clean and structured setup — one that aligns perfectly with Smart Money Concepts (SMC) and CHoCH (Change of Character) theory.
This 2H chart provides a roadmap for anticipating the next high-probability reversal, giving traders an edge in both short-term scalps and mid-term swing trades.
🔍 In-Depth Chart Analysis:
🧱 Resistance Zone (0.007020–0.007040):
This area has been tested multiple times in the past and acted as a strong supply zone. Institutional orders have previously caused significant bearish pressure from this level. Unless a strong bullish breakout occurs with volume, this zone is likely to hold again.
🔁 Next Reversal Zone (0.006975–0.006985):
Price is currently climbing from the SR Interchange Zone, heading toward this marked reversal area. Here's why this zone matters:
Confluence of past resistance and imbalance
Potential liquidity sweep above minor highs
Perfect setup for a bearish reaction to form a lower high
Traders should watch for signs of weak bullish candles, wicks, or a bearish engulfing here.
🔄 SR Interchange (Support-Resistance Flip):
This level held firm, showing buyer interest after a previous structure break. It signals a healthy correction phase — a typical SMC signature before larger moves occur. The market is offering a retracement opportunity.
🟡 CHoCH Zones:
Minor CHoCH (0.006900): A break and close below this level would invalidate bullish correction and confirm the shift in momentum.
Major CHoCH (0.006840): The final confirmation of bearish dominance. A breach here opens the door for new lows, targeting long-term support areas.
⚔️ Smart Money Playbook:
Current Move: Price is in bullish retracement from previous demand zone
Watch Zone: 0.006975–0.006985 (Potential Smart Money sell zone)
Reaction Setup:
Bearish structure forms (e.g., M pattern, liquidity sweep, bearish engulfing)
Price breaks minor CHoCH
Sell Entry: After confirmation, with stops above reversal zone
TP1: SR Interchange level
TP2: Major CHoCH zone
📅 Fundamental Triggers Ahead:
Watch for upcoming USD economic data (CPI, PPI, interest rate decisions) between June 11–14, which could act as catalysts for volatility and confirm technical setups.
🧠 Educational Note:
This setup is a classic example of market structure shift, liquidity engineering, and order block theory — concepts used by banks and smart money traders. Retail traders often get trapped on the wrong side of these zones. Your edge lies in anticipating the trap, not reacting to it.
🎯 Conclusion:
JPYUSD is offering a textbook Smart Money setup. The current retracement gives an opportunity to position early into a likely bearish continuation, provided structure confirms at the next reversal zone. Patience, discipline, and precise timing will be key to capitalizing on this move.

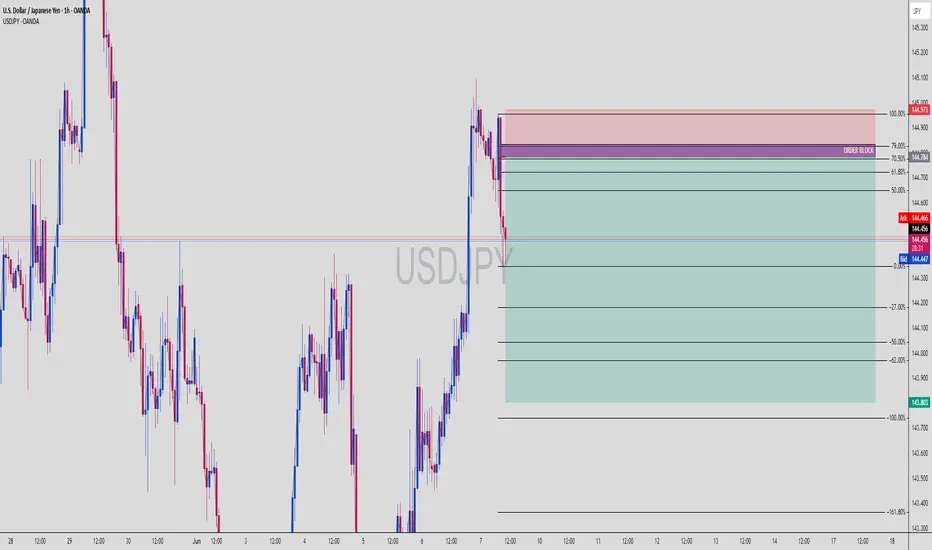
USDJPY Short Setup: OB Rejection + Fib Premium Sell-Off IncomingUSDJPY (1H Chart) | Institutional Short Setup with OB + Fib Confluence
The market is showing clear Smart Money Distribution behavior — with a rejection from a high-confluence zone combining Order Block, Premium Fib Levels, and bearish momentum shift.
🔍 Smart Money Setup Breakdown:
🔻 Bearish Order Block Zone (OB)
Price wicked into OB zone and got instantly rejected
OB located precisely at the 70.5% – 79% premium range
Mark of institutional sell-side interest
📐 Fibonacci Retracement + Premium Zone
Retracement from swing high (144.973) to swing low (144.436)
Premium zone between 61.8% to 79% aligns with OB (144.700–144.973)
Entry taken from this zone for high-probability sell setup
📉 Bearish Confirmation
Aggressive bearish reaction post-OB tap
Market structure flipping bearish
Momentum candle breaks previous bullish leg
🔻 Target Zones (Measured Fib Extensions)
-27%: 144.200
-62%: 144.000
-100%: 143.803
-161.8%: 143.300 (extended liquidity draw)
🧠 Chart Ninja Entry Plan:
🔹 Entry Zone 144.784 – 144.973 (OB + Premium Fib + FVG rejection)
🔻 SL Above 145.000 (above OB wick)
📉 TP 1 144.200 (first fib extension)
📉 TP 2 143.803 (full -100% extension)
⚖️ RRR Approx. 1:4+ — stealthy sniper precision
💬 Pro Tip from the Ninja Dojo:
The market doesn’t move because of indicators — it moves because of liquidity.
Find the OB. Wait for the imbalance. Strike where Smart Money hides. 🥷📊
This isn’t retail — this is calculated execution.
🎯 Save this chart before price melts to 143.8
💬 Drop your entry zone & SL idea in comments
USDJPY | Smart Money Long Setup – Deep Fib + OB Reaction💴 USDJPY | Institutional Long Play with Perfect OB + Fib Confluence
Price gave us an aggressive push off the demand zone, showing clear Smart Money accumulation behavior. This setup is high probability based on Smart Money Concepts (SMC).
🔍 1. Technical Breakdown
Strong impulse move upward
Clean pullback into the Order Block
Confluence with 70.5%–79% Fibonacci retracement zone
Price respected the OB zone and printed higher highs
That reaction was institutional — no cap 🧢.
🧱 2. Bullish Confluences
🔥 Order Block (OB): Purple demand zone = unmitigated
📐 Fib Sweet Spot: 70.5%–79% = institutional re-entry levels
✅ Strong Wick Rejection: Shows absorption of sell-side liquidity
📈 Market Structure Shift: Break of structure to the upside
🎯 3. Trade Plan
Entry: 142.89 (within OB + 70.5%)
Stop Loss: 142.00
Take Profit: 145.49 zone
This setup targets the -27% fib extension — a classic institutional TP level.
⚖️ 4. RRR (Risk-Reward Ratio)
💰 Entry: 142.89
🔒 SL: 142.00
📍 TP: 145.49
✅ RRR ≈ 1:2.9
Solid intraday-to-swing play with clean structure.
🧠 5. Key Confirmation Points
Break and close above 144.36 = confirmed bullish intent
Price respecting 143.44 OB = bulls still in control
SL below OB = protected by demand block
💬 Comment “SMC Long Sniper 💹” if you caught this move!
🔄 Share this if you love OB + fib sniper entries
📌 Save this setup for your next demand zone playbook

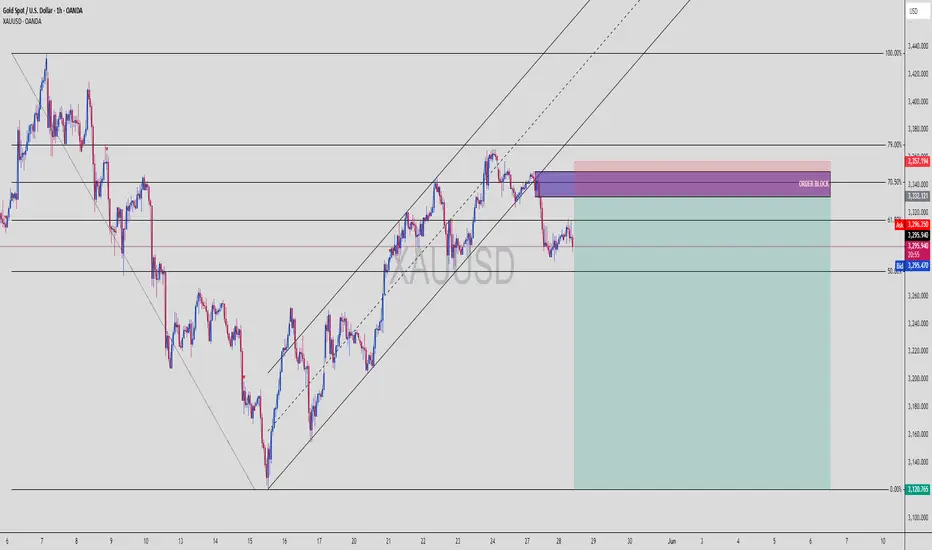
XAUUSD | Institutional Sell Setup – OB + 79% Fib Confluence🪙 XAUUSD | Gold Sell Setup Based on Smart Money Concepts
This is a classic example of how institutions lure in retail traders — tap the golden zone, reject hard, and leave a trail of liquidated longs.
🔍 1. Technical Breakdown
Price aggressively climbed into a strong Order Block zone
Rejection from the 70.5%–79% Fibonacci retracement area
Broken ascending channel confirms shift in momentum
Bearish BOS already occurred = Smart Money in control
This zone (3332–3357) is a magnet for institutional sells.
🧱 2. Bearish Confluences
💀 OB Rejection: Previous up candle before the sharp drop
📐 Fib Overlap: 70.5–79% = premium zone for shorts
📉 Structure Shift: Channel break + bearish order flow
⚠️ No Candle Close Above OB: = market respecting supply
🎯 3. Trade Plan
Entry: 3332–3357 (executed)
Stop Loss: 3360 (above OB)
Take Profit: 3120 zone
This is a deep sell-side liquidity hunt.
⚖️ 4. RRR (Risk-Reward Ratio)
📥 Entry: ~3345
🔒 SL: 3360
💰 TP: 3120
✅ RRR ≈ 1:15
This is a "swing short with conviction" kind of setup, where patience = profit.
🔁 5. Key Confirmation Points
Watch for lower lows and lower highs to continue
Price closing below 3290 = full confirmation
If Gold reclaims 3360 = setup invalidated
💬 Comment “Sniped Gold 🥷💰” if you took this short!
📌 Save this chart for OB + Fib zone study
🎯 Post your entry/exit levels — let’s compare setups
BTCUSD Rejection Setup – Order Block Hit, Weak Lows in Sight!📉 BTCUSD is setting up a textbook bearish reversal — Smart Money style.
This 1H chart shows Bitcoin tapping into a high-timeframe Order Block at ~$104,190–104,560, with a clear rejection from the premium zone and confluence with the upper trendline.
📊 Technical Breakdown:
✅ Order Block tapped at $104,190–104,560
✅ Strong rejection candle near the trendline resistance
✅ Price failed to break above the Strong High — a sign of Smart Money distribution
✅ Targeting Sell-Side Liquidity at $101,420
✅ Final target? Weak Low and liquidity pool around $99,189
🔍 Smart Money Confluence:
Price has moved into a premium selling zone, aligning with the upper bounds of market structure
Order Block rejection suggests institutional selling interest
Weak lows below $100K are prime targets for liquidity grabs
Retail longs are likely trapped — ideal conditions for a downward sweep
🧠 Institutional Logic:
Smart Money doesn’t chase price — it delivers it. This move likely represents a "Mitigation and Distribution" phase before a deeper selloff:
📌 Mitigation of previous long positions inside the OB
📌 Distribution at the highs before targeting the next liquidity pool
📉 Trade Idea:
Short Entry Zone: $104,200–104,500
Targets:
TP1: $101,420 (Sell-side Liquidity)
TP2: $100,000 (Psych level / Weak Low)
TP3: $99,189 (Liquidity Magnet)
Invalidation: Clean break and close above $104,800 (above the OB and Strong High)
🧠 Tip for Traders:
Wait for a confirmation bearish structure shift or lower high on the LTF (15m/5m) before entering full size. Smart Money leaves clues — not impulses.
💬 Comment "BTC Setup" if you’re trading this drop
🔁 Save this analysis — this is how Smart Money dominates crypto markets.

GBPJPY Trap & Reversal | Smart Money Loading from OB Zone!We’re analyzing a high-probability bullish reversal setup forming on GBPJPY 1H, built on clean SMC logic. Here’s how this trade is setting up:
🔄 Market Structure:
Prior bearish move into a reversal area
Equal highs (liquidity built up)
Clean sweep below short-term lows ➝ Liquidity grab ✅
Price now reacting from a defined Order Block zone
🧱 Order Block Zone:
Purple OB zone marked at 192.753–192.118
This zone is resting between 61.8% and 70.50% fib levels – high confluence 🔥
💸 Liquidity Levels in Play:
Sell-side liquidity already swept
Buy-side liquidity sitting above the recent highs @ 196.413 (target zone)
🚀 Entry Plan:
Entry Point: Reacting from OB near 192.753
Stop Loss: Below the strong low (192.118)
TP Zone: 196.413 = Buy side liquidity ➝ Weak High marked for potential sweep
🧮 RRR (Risk-to-Reward):
Massive potential ➝ Approx 1:8+ RRR
This is the kind of setup institutions dream of. 🚀
📈 Key Confluences:
Equal highs = liquidity magnet
OB sitting at golden zone
Strong low protecting entry
Institutional pattern: Sweep ➝ OB reaction ➝ expansion
📉 Watch for Pullback/Entry Reconfirmation:
Price may tap deeper into the OB before expanding
Wait for bullish momentum confirmation (CHoCH on 15M or 30M TF = better entry sniper style)
📢 Pro Tip (Trader Mindset):
This setup screams “liquidity engineering”. Retail traders shorted the lower high; Smart Money is about to flip the script. Be the shark, not the fish 🦈
