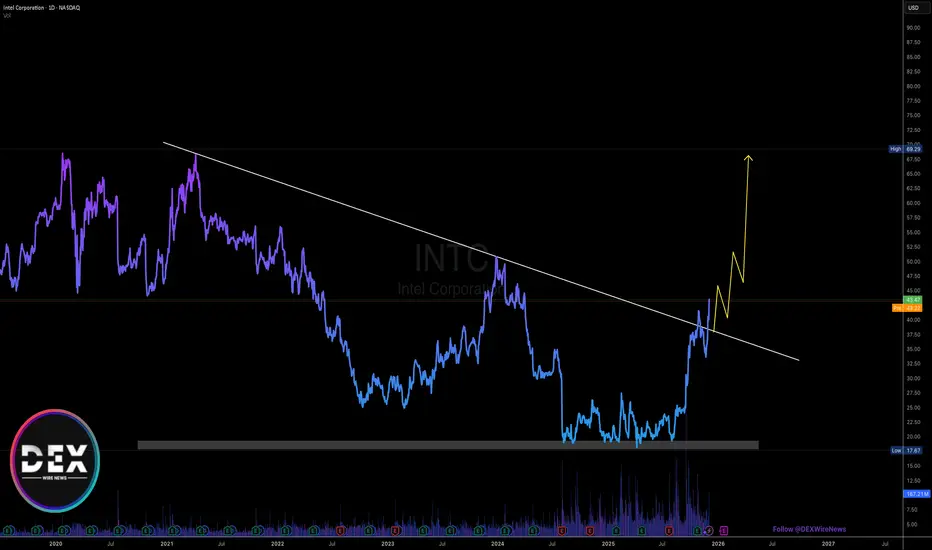
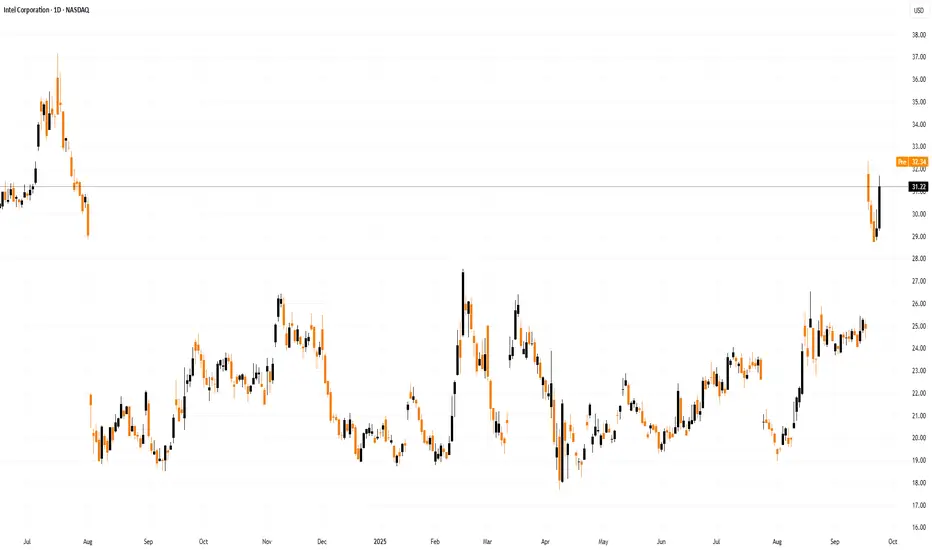
INTC Weakness Exposed — Are Sellers Still In Control?🔥 INTC Bearish Profit Play — Smart Money Thief Mode Activated?
📌 Asset
INTC — Intel Corporation
NASDAQ Exchange | Stock Market Profit Playbook
🕒 Swing Trade / Day Trade Setup
🧠 Market Bias
📉 Primary Bias: Bearish
Price structure shows weak momentum, failed bullish continuation, and distribution behavior near resistance. This setup favors controlled downside continuation rather than aggressive longs.
🎯 Trade Plan (Bearish Thief Setup)
🔑 Entry
📍 Flexible Entry Zone
➡️ Any favorable price level aligned with bearish confirmation
(Structure break, rejection, or weak bounce)
🛑 Stop Loss
⚠️ Thief-Style SL: 38.00
Dear Ladies & Gentlemen (Thief OGs),
This stop-loss level is NOT a recommendation.
Risk management is your own responsibility — trade at your own risk and adjust according to your strategy.
🎯 Take Profit Zones
Primary Target 🎯
✅ TP-1: 34.00
Extended Target (Escape With Profits) 💰
🚀 TP-2: 31.00
📌 Why TP-2 matters:
Strong historical support zone
Oversold conditions likely to appear
Potential trap & reaction bounce
Broader market correlation suggests profit-taking is wise here
Dear Ladies & Gentlemen (Thief OGs),
These targets are NOT mandatory.
Secure profits based on your own plan and risk tolerance.
🔍 Technical Breakdown (Clean & Professional)
📉 Lower-High Structure intact
❌ Failed bullish continuation
📊 Weak volume on pullbacks
🧠 Distribution near resistance
🔄 Correlation with tech sector weakness
This supports a sell-the-rally / continuation downside approach rather than bottom-fishing.
🔗 Related Pairs & Correlation Watchlist
Keep an eye on these correlated instruments 👇
NASDAQ:NDX (Nasdaq-100)
➝ Tech weakness usually accelerates downside in INTC
NASDAQ:SOXX (Semiconductor ETF)
➝ Sector confirmation strengthens bearish conviction
NASDAQ:NVDA / NASDAQ:AMD
➝ Relative strength comparison — INTC underperformance adds pressure
TVC:DXY (US Dollar Index)
➝ Strong USD often pressures equities, especially tech
📌 If these pairs remain weak, INTC downside probability increases.
🧠 Master Trader Notes
This is NOT financial advice
No prediction — only reaction
Capital preservation > hero trades
Take profits when market offers them
If anything here feels aggressive, scale down — the market will always give another setup.
✨ “If you find value in my analysis, a 👍 and 🚀 boost is much appreciated — it helps me share more setups with the community!”
⚠️ Disclaimer
This is a thief-style trading strategy just for fun.
Educational & entertainment purposes only.
Intcstock

Intel - This behavior is wonderful!🎉Intel ( NASDAQ:INTC ) respects all structure:
🔎Analysis summary:
Just in the end of 2024, Intel perfectly retested a major long term horizontal support. After we then witnessed bullish confirmation, it was so obvious, that Intel will create a move higher. Now, Intel rallied +120% and is ready for a shorter term correction now.
📝Levels to watch:
$45
SwingTraderPhil
SwingTrading.Simplified. | Investing.Simplified. | #LONGTERMVISION

Breaking: Intel Corporation (INTC) Surge 8.6% Set for $70 MoveThe price of Intel Corporation (NASDAQ: NASDAQ:INTC ) saw a noteworthy uptick of 8% in Tuesday's extended trading session breaking out of the ceiling of a symmetrical triangle- eyeing the $70 resistant amidst increase in bullish sentiment.
The rise came as the S&P 500 and the Nasdaq Composite jumped 0.2% and 0.5%, respectively.
Intel's stock continued to climb tod, driven by Friday's unconfirmed report that the chipmaker is set to begin manufacturing semiconductors for Apple's MacBook Air and iPad Pro.
If the report is confirmed, it would be a massive win for the embattled chipmaker. Intel once dominated the semiconductor industry with its efficient CPUs, but it has fallen behind in the era of artificial intelligence (AI), a technology that is powered primarily by GPUs. A vote of confidence from Apple would go a long way in aiding the company's turnaround efforts.
About INTC
Intel Corporation designs, develops, manufactures, markets, and sells computing and related products and services worldwide. It operates through Intel Products, Intel Foundry, and All Other segments. The company offers microprocessor and chipset, stand-alone SoC, and multichip package; Computer Systems and Devices; hardware products comprising CPUs, graphics processing units (GPUs), accelerators, and field programmable gate arrays (FPGAs); and memory and storage, connectivity and networking, and other semiconductor products.
$INTC is set to go to $50I shared this when Intel was sitting at $23 and I am still bullish.
We pulled back to last quarterly opening price which is $34. I wouldnt be surprised if we bounce from here.
Anyway, sentiment is very positive on Intel so good luck.
First $50 then $100 in a long run.
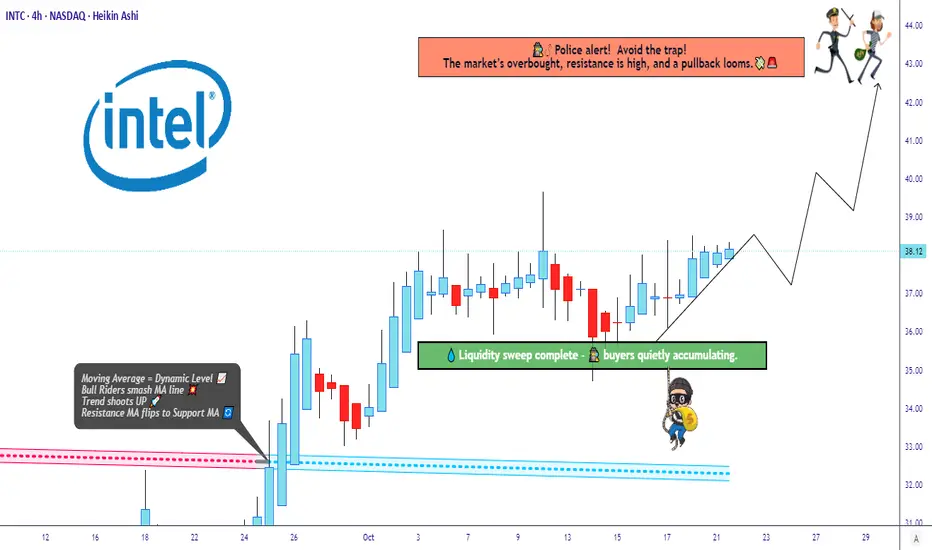
“Intel’s Bullish Structure Building Power for a Breakout Move!”🔥 INTC “Intel Corporation” – The Thief’s Profit Playbook 🕶️💰 (Swing/Day Trade Setup)
⚔️ Plan Overview – Bullish Setup with Thief Precision
The Thief Strategy is in play here — a smart layering entry method designed to steal optimal positions from impatient traders. 🕵️♂️
Our mission: Load, Layer, Loot, and Leave with Profits.
🎯 Entry Plan (Layering Method)
We’re layering multiple buy limits (thief-style) to catch value dips:
Buy Limit Layers: 35.00 💵 → 36.00 💵 → 37.00 💵
(⚙️ You can expand your layers based on your risk tolerance and style — thieves adapt fast.)
💡 Why Layer? Because a pro thief never rushes a vault — we break in step-by-step. This builds position strength while keeping entry efficiency.
🛡️ Stop Loss (Thief’s Escape Hatch)
📉 Stop Loss @34.00
💬 “Dear Ladies & Gentlemen (Thief OG’s) — I’m not recommending you set my SL. You’re the boss of your vault. Manage your own risk, grab the bag, and disappear in profits like a shadow.” 🌑💼
🚀 Target Zone (Profit Extraction Level)
🎯 Main Target: @43.00
📛 Police Barricade @44.00 — strong resistance zone + overbought region + potential bull trap.
🧠 Play it smart — escape clean with gains at 43.00 before the blue lights flash. 🚨
💬 “Dear Ladies & Gentlemen (Thief OG’s) — not recommending you follow my TP blindly. Make your own move, take your profit, and vanish like a ghost.” 👻💸
🧩 Technical Breakdown
Intel (INTC) forming a strong base accumulation near the $35–37 range.
Volume Profile shows liquidity pockets aligning with the layering zones.
RSI hovering mid-levels → room for upside before overbought conditions hit near $43–44.
EMA Confluence: Price reclaiming short-term EMA — early trend reversal signals in motion.
Fundamental Boost: Intel’s AI chip roadmap and cost-optimization headlines add bullish narrative momentum. ⚙️📈
🌍 Related Pairs to Watch (Correlation & Market Sync)
💠 NASDAQ:NVDA – Leader in AI semis; momentum correlation ~0.78 with INTC.
💠 NASDAQ:AMD – Similar sector swing potential; can mirror INTC lag-moves.
💠 NASDAQ:SMH (VanEck Semiconductor ETF) – Sector strength indicator. A breakout above resistance supports INTC’s upside.
💠 NASDAQ:QQQ / NASDAQ:NDX – Tech-heavy indices; bullish bias strengthens chip sector sentiment.
🧭 Correlation Tip: If NVDA or QQQ rallies strongly while INTC consolidates — that’s your thief’s golden signal to layer your entries quietly before the breakout sparks. ⚡
⚙️ Risk Management Wisdom
Never go all-in; layer your risk like a pro.
Keep your SL tight but mind flexible.
Respect zones — police don’t like thieves hanging around too long. 😎
✨ “If you find value in my analysis, a 👍 and 🚀 boost is much appreciated — it helps me share more setups with the community!”
📜 Disclaimer: This is a Thief-Style Trading Strategy shared for educational & fun purposes only. Not financial advice. Trade wisely — stay stealthy. 🕶️
#INTC #Intel #StockMarket #SwingTrade #DayTrading #ThiefStrategy #LayeredEntries #TechnicalAnalysis #NASDAQ #StocksToWatch #AIStocks #TradingViewCommunity #TradingViewEditorsPick #Semiconductors #NVDA #AMD #QQQ #ProfitPlaybook
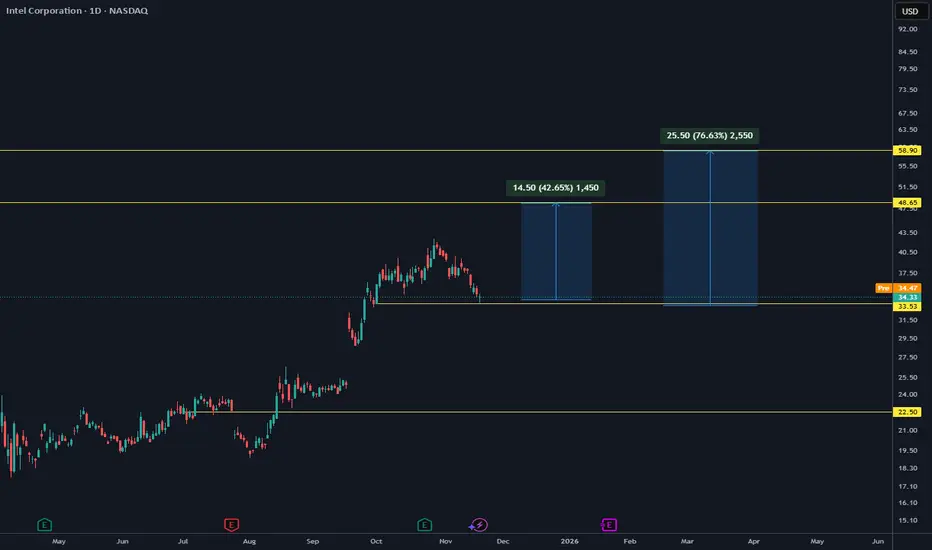
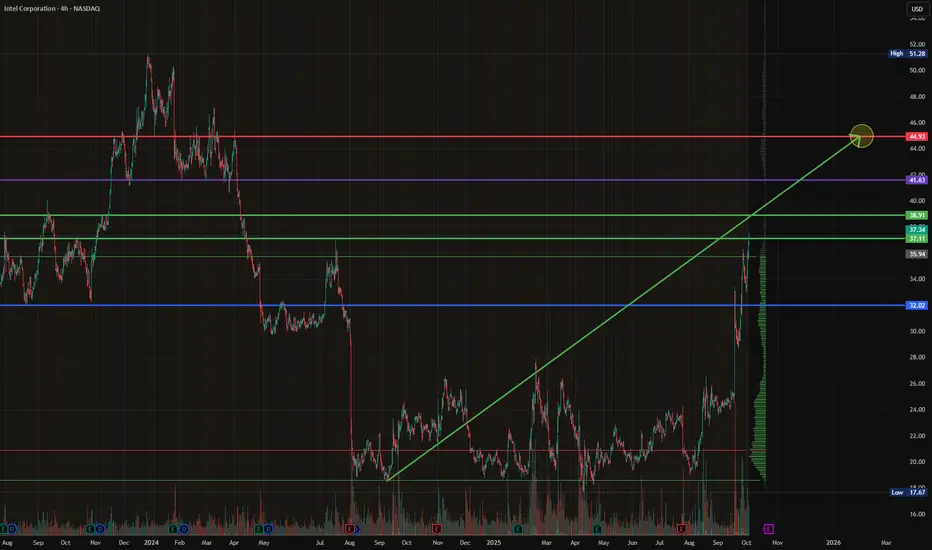
$INTC - Intel Corp - $32.02 Re-Entry - $44.93 PTNASDAQ:INTC broke out to $38.91 before running into the previous resistance leve and consolidating since. We're watching to see if it holds that mid-level (light blue) support or if it continues back to $32.02 for a Re-Entry & Hold to find support, push through $38.91 finally, to retest the $44.93 Levels again.

Intel - The parabolic bullrun!💸Intel ( NASDAQ:INTC ) rallies significantly:
🔎Analysis summary:
After Intel retested a major support a couple of months ago, we already witnessed an expected rally of about +100%. Considering that the next horizontal resistance is about +25% higher, a bullrun continuation remains totally likely. Intel just perfectly plays out.
📝Levels to watch:
$45
SwingTraderPhil
SwingTrading.Simplified. | Investing.Simplified. | #LONGTERMVISION

$INTC - Intel Corporation - $44.93 RetestNASDAQ:INTC is marching to it's next breakpoint at $38.91, with the potential to find next level resistance around the $41.63's, which we're looking for Momentum to drive it through, to retest $44.93.
Intel - The breakout happens now!💰Intel ( NASDAQ:INTC ) will break out quite soon:
🔎Analysis summary:
For the past two decades, Intel has overall been moving sideways. While we witnessed significant swings during this period of time, Intel recently retested another strong support area. If Intel now breaks the short term resistance, we will officially see the bottom formation.
📝Levels to watch:
$25
SwingTraderPhil
SwingTrading.Simplified. | Investing.Simplified. | #LONGTERMVISION

Intel (INTC) Shares Trade Around $30Intel (INTC) Shares Trade Around $30
In August, we noted that:
→ Intel (INTC) shares gained strong bullish momentum following reports that the US government was in talks to acquire a stake in the company;
→ the INTC chart was signalling that the depressed market, in place since 2021, was undergoing a fundamental shift in sentiment, with a potential rally foundation being formed.
Last month also brought the official announcement that Japanese conglomerate SoftBank Group would invest $2 billion in Intel. September, in turn, delivered further reasons for price gains:
→ On 18 September 2025, Nvidia officially announced a $5 billion investment in Intel and the launch of a multi-year strategic partnership. This came as a shock to the market: instead of competing, the two giants decided to join forces in developing new products. INTC shares gapped strongly higher, surpassing the psychological $30 mark for the first time this year.
→ More recently, Bloomberg reported that Apple is also considering investing in Intel. Although this remains at the level of speculation (with no official confirmation from either side), INTC shares rose by more than 6% yesterday.
Technical Analysis of INTC Shares
In earlier chart analysis, we highlighted the importance of the $20 level, which appeared to act as support from large players. This may have reflected confidence that the government would not allow a strategically important US company to be left behind in difficult times, particularly in the context of technological competition with China.
For many months, INTC shares had been in decline (shown by the red line). However, the price action in August–September has broken this pattern, confirming earlier assumptions. Higher lows and higher highs in 2025 have established an ascending channel (shown in blue), with key features as follows:
→ in early September, the price consolidated near the median, signalling a balance between supply and demand around $25;
→ September’s bullish news shifted the balance in favour of buyers, with INTC stock jumping towards the upper boundary of the channel.
From a bearish standpoint, potential obstacles to further growth include:
→ the psychological $30 level (which acted as support in May);
→ the upper boundary of the blue channel.
Although the market looks overbought, it is possible that:
→ buyers may refrain from taking profits in anticipation of longer-term gains;
→ and if positive rumours of further investment in Intel continue to be confirmed, this could drive an extension of the upward trend — potentially along a steeper trajectory (shown in orange).
This article represents the opinion of the Companies operating under the FXOpen brand only. It is not to be construed as an offer, solicitation, or recommendation with respect to products and services provided by the Companies operating under the FXOpen brand, nor is it to be considered financial advice.
Intel - The bottom is in!🔮Intel ( NASDAQ:INTC ) forms a clear bottom:
🔎Analysis summary:
After a consolidation of about three decades, Intel is now creating a strong bottom formation. With the retest of a major horizontal support area, Intel is respecting clear market structure. Quite likely therefore that Intel will soon start its next major higher timeframe bullrun.
📝Levels to watch:
$25
SwingTraderPhil
SwingTrading.Simplified. | Investing.Simplified. | #LONGTERMVISION

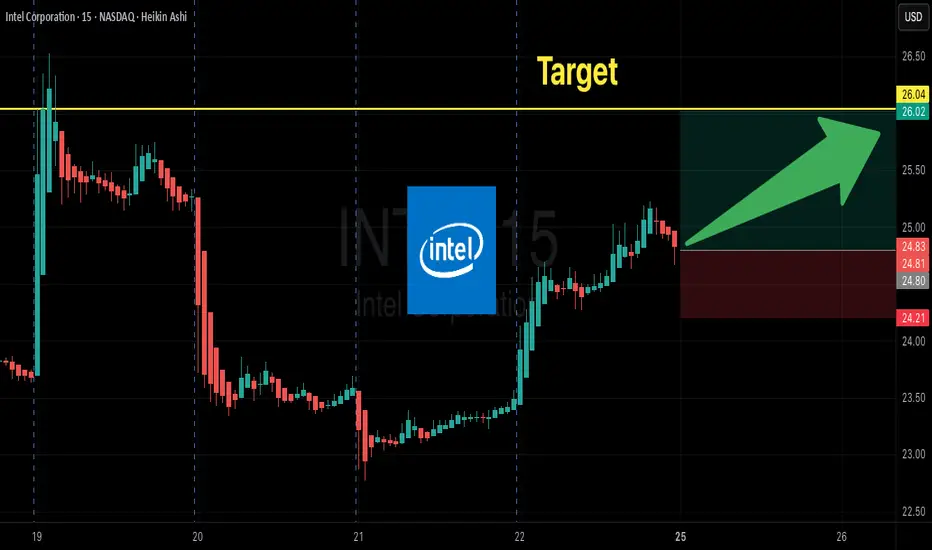
INTC $26C Swing Play—Don’t Miss Out🔥🚀 **INTC Swing Options Play — Moderate Bullish Setup!** 🚀🔥
📊 **Swing Trade Breakdown (2025-08-22)**
* 🎯 **Ticker**: \ NASDAQ:INTC
* 🔀 **Direction**: CALL (LONG)
* 🎯 **Strike**: \$26.00
* 💵 **Entry Price**: \$0.80
* 🛑 **Stop Loss**: \$0.55 (-35%)
* 🎯 **Profit Target**: \$1.60 – \$2.00 (+100% to +150%)
* 📅 **Expiry**: 2025-09-05 (14DTE)
* 📈 **Confidence**: 70%
* ⏰ **Entry Timing**: Market Open
💡 **Why this trade?**
✅ **Momentum Rising**: Daily RSI at 65.0, 10D gain of +25.46% 📈
✅ **Low VIX (14.4)** = Safer holding, less decay risk ⚡
✅ **Bullish Bias Confirmed** across timeframes
⚠️ **Risks**: Weak volume (1.0x avg) & neutral options flow → breakout confirmation needed!
\#INTC #OptionsTrading #SwingTrade #CallOptions #StockMarket #MomentumTrading #BullishSetup #TradingStrategy #DayTrading
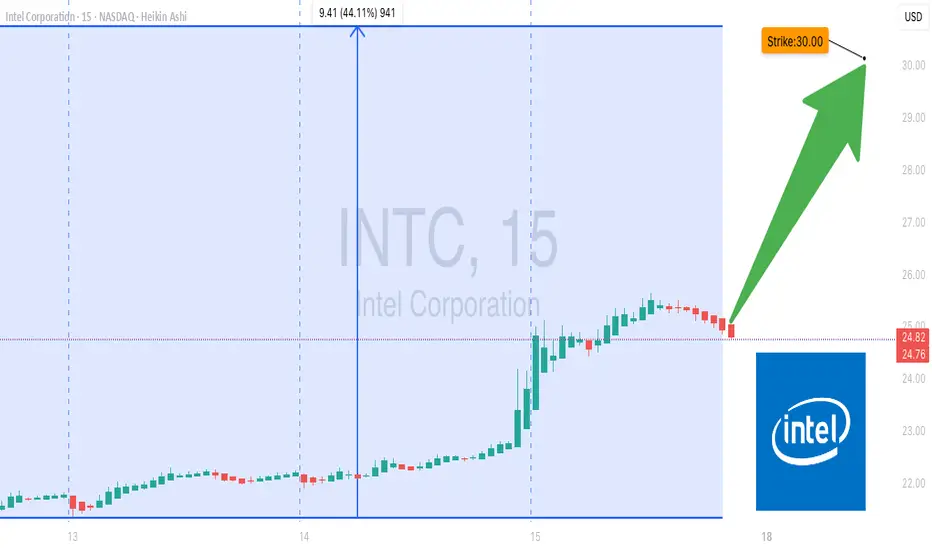
INTC on Fire! Swing Traders, Don’t Miss This Call!
🚀 **INTC SWING TRADE ALERT – 2025-08-15** 🚀
**Moderate Bullish Momentum – Calls in Play!** 📈
**🔍 Market Context:**
* **Daily RSI:** 72.2 (strong overbought thrust)
* **5-Day Gain:** +24.79% 💥
* **Volatility:** Low VIX – great for swing setups
* **Volume:** Weak (⚠️ watch for fakeouts)
* **Options Flow:** Neutral – institutions not leaning heavily yet
**📊 Consensus from 5 Models:**
✅ Bullish momentum across all timeframes
⚠️ Caution on weak volume & neutral sentiment
🏹 Perfect short-term swing environment if monitored closely
---
**💡 Trade Plan:**
* **Instrument:** INTC Aug 29 ’25 26C
* **Entry:** \$0.78 (at open)
* **Stop Loss:** \$0.55 (-30%)
* **Profit Target 1:** \$1.17 (+50%)
* **Profit Target 2:** \$1.56 (+100%) – let runners ride!
* **Confidence:** 75%
---
**⚠️ Risk Notes:**
* RSI > 72 = possible pullback
* Volume weakness could kill breakout
* Options sentiment neutral – watch for big money moves
📆 **Signal Time:** 2025-08-15 11:02 EDT
💎 **Execution:** Buy single-leg naked calls at open
---
💬 If you trade this, keep stops tight & scale out at targets. Momentum is hot, but the tape needs confirming volume.
\#INTC #SwingTrading #OptionsAlert #StockMarket #CallOptions #TradingSignals #NASDAQ #BullishMomentum
Intel (INTC) Stock Price Rises 7% Amid White House RumoursIntel (INTC) Stock Price Rises 7% Amid White House Rumours
Intel (INTC) stock price surged more than 7% yesterday, making it the top performer in the S&P 500 index. The rally came on the back of a report in Barron’s stating that the US government is in talks to acquire a stake in Intel:
→ Intel declined to comment on Barron's report.
→ White House spokesperson Kush Desai stated: “Discussion about hypothetical deals should be regarded as speculation unless officially announced by the Administration.”
Meanwhile, Bloomberg reported that the Trump administration is negotiating with Intel over a potential US government stake in the company – a move aimed at boosting domestic manufacturing and supporting Intel’s plans to build a new facility in Ohio.
The prospect of state backing for the American chipmaker triggered a sharp bullish impulse yesterday, which could extend into today. In pre-market trading, INTC shares are hovering around $25 – their highest level since March.
Technical Analysis of INTC Shares
Previously, when analysing the INTC chart, we highlighted the significance of the $20 level, which appeared to act as strong support from major market participants. This may have reflected expectations that the government would not abandon a strategically important US company during challenging times – particularly in the context of technological rivalry with China.
For months, INTC shares had been in a downtrend (as shown by the 100- and 200-period moving averages). However, yesterday’s sharp rally now appears capable of reversing that trend:
→ Lower highs and lows at points A, B, and C had suggested a lower low at point D. Indeed, the price came close to setting it after a disappointing quarterly earnings report on 24 July, which led to a large bearish gap at the market open on 25 July.
→ Today, we may see the price break above point C’s high, signalling a potential end to the bearish market structure.
Candlestick analysis this week highlights strong bullish momentum:
→ On Monday (indicated by an upward arrow), trading opened with a bullish gap. However, sellers became active near the upper boundary of the aforementioned bearish gap (marked with a rightward arrow), causing the candle to close with a long upper wick – a sign of weakness.
→ The next two sessions demonstrated that buying pressure persisted – on Tuesday, the stock opened with a bullish gap and rose steadily throughout the day, with Wednesday’s strong candle further confirming buyer activity.
→ Yesterday, the price confidently broke through resistance at $22.25, moving towards the $23.75 level, which could be breached today.
→ The RSI indicator is now at its highest level since February.
The INTC share chart may be signalling that the prolonged bearish market, which began in 2021, is undergoing a significant shift in sentiment. This could mark the early stages of a rally – one that would be fundamentally justified if Intel does indeed secure government backing.
This article represents the opinion of the Companies operating under the FXOpen brand only. It is not to be construed as an offer, solicitation, or recommendation with respect to products and services provided by the Companies operating under the FXOpen brand, nor is it to be considered financial advice.

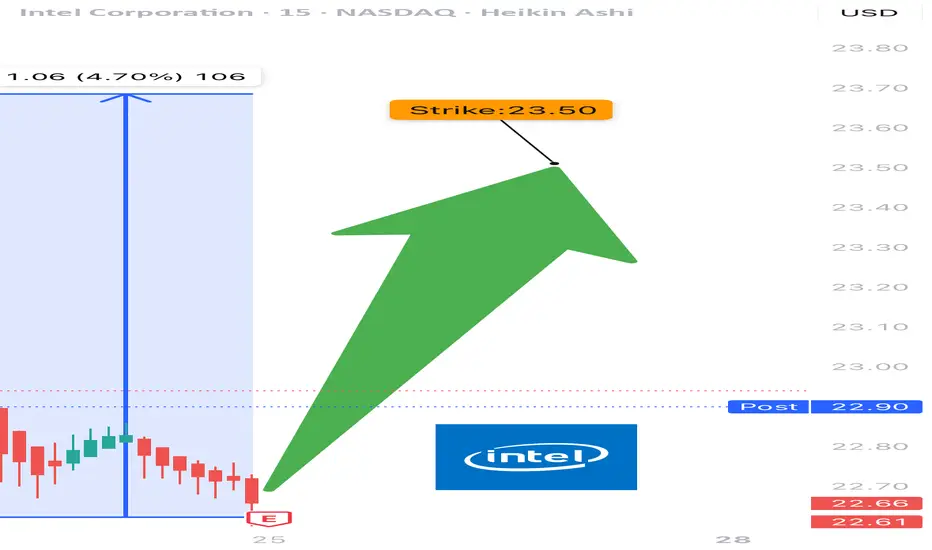
INTC EARNINGS TRADE (07/24)
🚨 INTC EARNINGS TRADE (07/24) 🚨
🎧 Earnings drop after close — here’s the high-conviction setup 📊
🧠 Key Highlights:
• 💥 Surprise Beat Rate: 88%, avg surprise = 419%
• 📉 Margins: Ugly (-36% net margin) but improving sentiment
• 📈 Volume Surge + $24 resistance test = pre-earnings drift 🚀
• 🔎 Mixed options flow → cautious bulls leaning in
• 🎯 Sector: SEMI = 🔀 rotating hard, competition vs AMD/NVDA rising
💥 TRADE SETUP
🟢 Buy INTC $23.50 Call exp 7/25
💰 Entry: $0.59
🎯 Target: $1.18
🛑 Stop: $0.29
📈 Confidence: 75%
⏰ Entry: Before Earnings (Close 07/24)
📆 Earnings: Today After Market (AMC)
📊 Expected Move: 5%
⚠️ Play the earnings drift → gap up = profit. Miss = cut fast. Risk = defined. Reward = explosive.
#INTC #EarningsPlay #OptionsTrading #IntelEarnings #UnusualOptionsActivity #TechStocks #Semiconductors #TradingView #EarningsSeason #DayTrading #CallOptions
Intel Share Price Hits 3-Month High Without Clear CatalystIntel (INTC) Share Price Hits 3-Month High Without Clear Catalyst
Intel Corporation (INTC) stocks rose by over 7% yesterday, making them one of the top performers in the S&P 500 index (US SPX 500 mini on FXOpen). As a result, the stock price reached its highest level in three months.
What’s notable is the apparent lack of clear drivers behind the rally. According to Barron’s, the increase in INTC shares could have been triggered by a rating upgrade from Wall Street analysts or a corporate announcement – yet no such developments have occurred. "Nothing new or fundamental," says Mizuho managing director and technology specialist Jordan Klein.
At the same time, from a technical analysis perspective, the INTC price chart is showing significant developments. Examining these price movements may provide clues as to what’s fuelling the recent rise.
Technical analysis of INTC stocks
For many months, the share price had been confined within a downward channel. However, the psychological level of $20 acted as a strong support – repeated attempts by bears to push the price lower ultimately failed.
Bearish patterns in INTC’s chart may have led to a supply squeeze, as holders were given repeated reasons to sell (particularly against the backdrop of Nvidia’s success). Yet the bullish reversals near the $20 mark suggest that institutional interest was accumulating the stock at what was perceived to be a deeply discounted level – a characteristic sign of the Accumulation Phase in Wyckoff methodology.
It is this lack of available supply that could explain the sudden price rise in the absence of obvious news catalysts.
Since early summer, INTC shares have been making higher highs and higher lows, breaking upwards through the descending channel and beginning to form the early stages of a new bullish trend (highlighted in blue). Should fundamental catalysts emerge in the near term, they may serve as the spark to accelerate this nascent rally.
This article represents the opinion of the Companies operating under the FXOpen brand only. It is not to be construed as an offer, solicitation, or recommendation with respect to products and services provided by the Companies operating under the FXOpen brand, nor is it to be considered financial advice.

Intel - The rally starts!Intel - NASDAQ:INTC - creates a major bottom:
(click chart above to see the in depth analysis👆🏻)
For approximately a full year, Intel has not been moving anywhere. Furthermore Intel now trades at the exact same level as it was a decade ago. However price is forming a solid bottom formation at a key support level. Thus we can expect a significant move higher.
Levels to watch: $25.0
Keep your long term vision!
Philip (BasicTrading)

Intel (INTC) Shares Drop Over 6% in a DayIntel (INTC) Shares Drop Over 6% in a Day
As shown on the Intel (INTC) chart, after Tuesday’s candle closed above $21, the price dropped sharply on Wednesday. INTC was the worst-performing stock of the day among the components of the S&P 500 index (US SPX 500 mini on FXOpen).
Why Did INTC Shares Fall?
The decline is linked to growing competitive pressure. According to media reports:
→ On one hand, AMD continues to rapidly expand its share of the server CPU market. A report by Mercury shows that the company already controls 40% of the segment and could match Intel as early as next year.
→ On the other hand, Nvidia is preparing to launch two accelerated processing units (APUs) for the consumer market, which will combine CPU and GPU capabilities in a single product.
Technical Analysis of the INTC Chart
In 2025, the price remains:
→ within a broad downward trend (marked in red);
→ supported by the $18.50–$20 zone.
Meanwhile, price fluctuations in May and June are forming a narrowing triangle (marked in black). Following the recent negative news, it is possible that INTC shares could fall towards the lower boundary of the triangle — or even retest the psychologically important $20 level.
This article represents the opinion of the Companies operating under the FXOpen brand only. It is not to be construed as an offer, solicitation, or recommendation with respect to products and services provided by the Companies operating under the FXOpen brand, nor is it to be considered financial advice.

Intel (INTC): Bullish Signs Emerging, Eyes on $75 ATHIntel (INTC) has started to show strong bullish signals, confirming a reversal after refusing to drop below $18. The stock has since climbed to $27, signaling renewed investor confidence and a potential breakout in the coming months.
Key Resistance Levels: The Path to $75
$30: The first critical resistance level that Intel must break to continue its bullish momentum.
$37: A key milestone that, if surpassed, would strengthen the uptrend.
$75 (All-Time High): The ultimate long-term target.
If Intel successfully breaks above $37, it could trigger a sustained rally toward its ATH of $75, potentially supported by industry advancements and stronger financial performance.
Risk Scenario: Consolidation and Potential Drop to $12
If Intel fails to break $30, it could enter a multi-year consolidation phase.
A prolonged range between $12 and $30 could play out if bullish momentum fades.
In a worst-case scenario, Intel could hunt the $12 level, creating a long-term accumulation zone before attempting another breakout.
Summary: Bullish Structure with Key Levels to Watch
Intel’s refusal to drop below $18 and its climb to $27 signal growing bullish momentum.
Break Above $30: Signals continuation to $37, then a long-term push toward $75.
Failure at $30: Could lead to a multi-year consolidation, ranging between $12 and $30.
The next few months will be crucial in determining whether Intel resumes a strong uptrend or enters a long accumulation phase before the next major breakout.

Intel ($INTC) at a Crossroads: Breakup Talks, Market PressuresIntel Corporation (NASDAQ: NASDAQ:INTC ) finds itself at a critical juncture as reports emerge about Broadcom and Taiwan Semiconductor Manufacturing Co. (TSMC) exploring potential deals that could split the storied chipmaker into two entities. This revelation comes amidst Intel’s ongoing struggles in maintaining its dominance in the semiconductor industry, intensified by leadership changes, manufacturing setbacks, and increasing market competition.
Broadcom & TSMC’s Interest in Intel
The Wall Street Journal recently reported that Intel rivals Broadcom and TSMC are each considering deals that would divide the company. Broadcom is reportedly analyzing Intel’s chip design and marketing business, with discussions about a potential bid, though any move would depend on securing a partner for Intel’s manufacturing division. Meanwhile, TSMC has expressed interest in taking control of Intel’s chip plants, potentially through an investor consortium.
The U.S. government is closely monitoring these developments, as Intel is viewed as a company of national security significance. Reports indicate that the Trump administration is unlikely to support a foreign entity operating Intel’s U.S. factories, adding an additional layer of complexity to any potential deal.
Intel was a major beneficiary of the Biden administration’s push to onshore semiconductor manufacturing, securing a $7.86 billion government subsidy. However, the company has struggled to execute its ambitious plans. Former CEO Pat Gelsinger set high expectations for Intel’s manufacturing and AI capabilities, but his failure to deliver led to lost contracts, a 60% drop in the company’s stock value in 2023, and layoffs affecting 15% of its workforce.
Technical Outlook
Intel’s stock (NASDAQ: NASDAQ:INTC ) closed last Friday’s session down 2.2%, but premarket trading on Monday shows signs of recovery with a 0.06% uptick. The technical indicators suggest that NASDAQ:INTC could be on the cusp of a bullish reversal, contingent on broader market sentiment.
The Relative Strength Index (RSI) for Intel stood at 68 on Friday. This reading positions the stock near the overbought threshold but also signals that momentum is building towards a potential breakout. Also, Intel is currently trading above key moving averages, reinforcing a bullish sentiment in the near term.
Should a pullback occur, immediate support is found at the 38.2% Fibonacci retracement level, which may serve as a demand zone for NASDAQ:INTC shares. In the event of extreme selling pressure, a drop to the one-month low of $18.50 could materialize, though such a scenario would require a significant bearish catalyst.
If bullish momentum takes hold, a breakout above resistance levels could push Intel’s stock higher, aligning with analyst expectations. The 12-month price forecast for NASDAQ:INTC stands at $25.69—an 8.86% increase from its current price.
Conclusion
Intel’s potential breakup remains speculative, but the fundamental challenges it faces underscore why such discussions are taking place. While concerns about cash flow, leadership changes, and market competition weigh on the stock, technical indicators suggest that NASDAQ:INTC may be approaching a bullish reversal.
With a critical trading week ahead, investors should monitor key support and resistance levels while staying informed about any further developments in the Broadcom and TSMC discussions. If Intel successfully capitalizes on government support and restructures its strategy, a resurgence in investor confidence could follow, pushing NASDAQ:INTC back into bullish territory.

INTC - Will they be Acquired? 30% UpsideNASDAQ:INTC - CHARTURDAY 📈
WOW! Intel has been on a tear as of late due to acquisition talks...
- Double Bottom in play here
- Volume Shelf with GAP to $30 🎯
DB Breakout = 🎯 $34.50
I personally don't like trading acquisition names.
Not financial advice


Intel: Go for it! 💪 Since the low of wave x in orange, Intel has already shown strong upwards movement and should soon conquer the resistance at $37.11, heading for the compound consisting of the turquoise zone between $41.59 and $43.13 and the orange zone between $42.32 and $43.63. There, the share should complete wave 4 in turquoise and return below $37.11 afterward. However, there is a 34% chance that Intel could shift southwards earlier already and drop below the support at $26.86, triggering further descent below $24.55. In that case, we would consider wave alt.4 to be finished by now.
