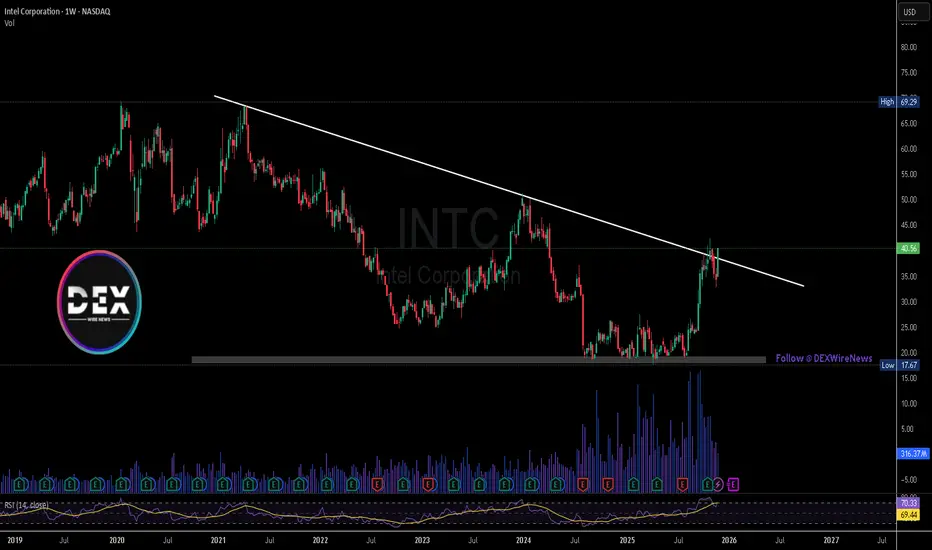
Intel - Starting 2026 with a +50% rally!💰Intel ( NASDAQ:INTC ) just remains completely bullish:
🔎Analysis summary:
Over the course of the past three weeks, Intel has been rallying an incredible +50%. Following this very bullish momentum, there is a high chance of new all time highs soon. Just give Intel some time and don't get caught up in all of this short term volatility.
📝Levels to watch:
$70
SwingTraderPhil
SwingTrading.Simplified. | Investing.Simplified. | #LONGTERMVISION
Intelcorporation

Intel Corporation | INTC | Long at $44.26Entered Intel NASDAQ:INTC after-hours at $44.26. The US government is too heavily invested in this one to let it truely slide. The earnings / EPS projections show a likely major turnaround. Any dips are purely programmatic for entry (watch insiders and politicians . I may sound like a conspiracy theorist here, but a $8.9 billion investment from the US government is absolutely going to lead to major returns by 2028/2029. There is a major price gap a lot of people aren't seeing all the way back to the year 2000 between $71.38 and $73.44. That's my main target. And, like dot-com crash, it may go further until.... So, in the near-term, there could be weakness and a dip to retouch the historical average band ($30's - another entry). But my outlook is longer. And, given the need for chips and the government wanting a major return on their investment, I suspect this one is going to lead to a solid return.
Targets into 2029
$60.00 (+35.6%)
$73.00 (+64.9%)

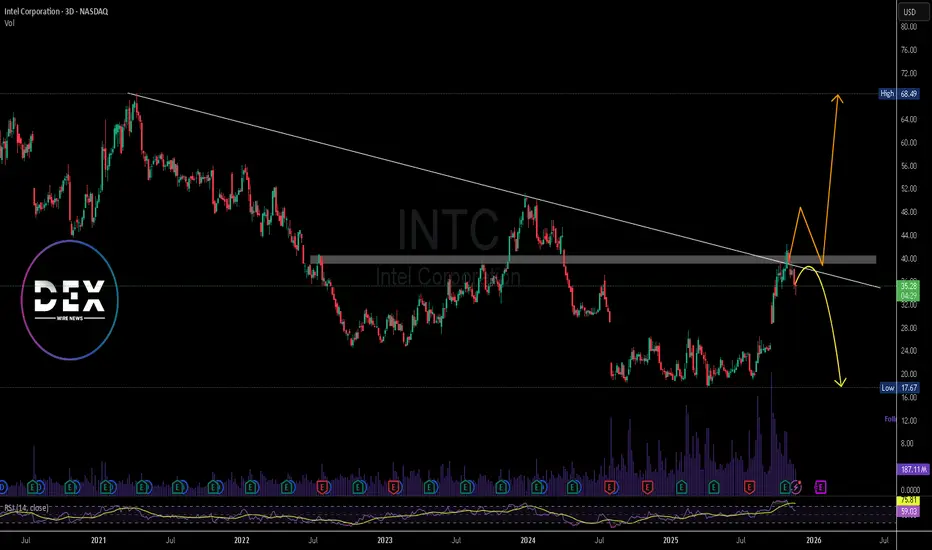
Intel - Here comes the bullish breakout!💾Intel ( NASDAQ:INTC ) will soon break out:
🔎Analysis summary:
During 2025, Intel has over and over again been retesting major support. That was exactly the reason why I told everyone to enter longs here on Intel. Just a couple months later we witnessed a +150% rally and Intel is about to create another bullish breakout soon.
📝Levels to watch:
$45 and $70
SwingTraderPhil
SwingTrading.Simplified. | Investing.Simplified. | #LONGTERMVISION

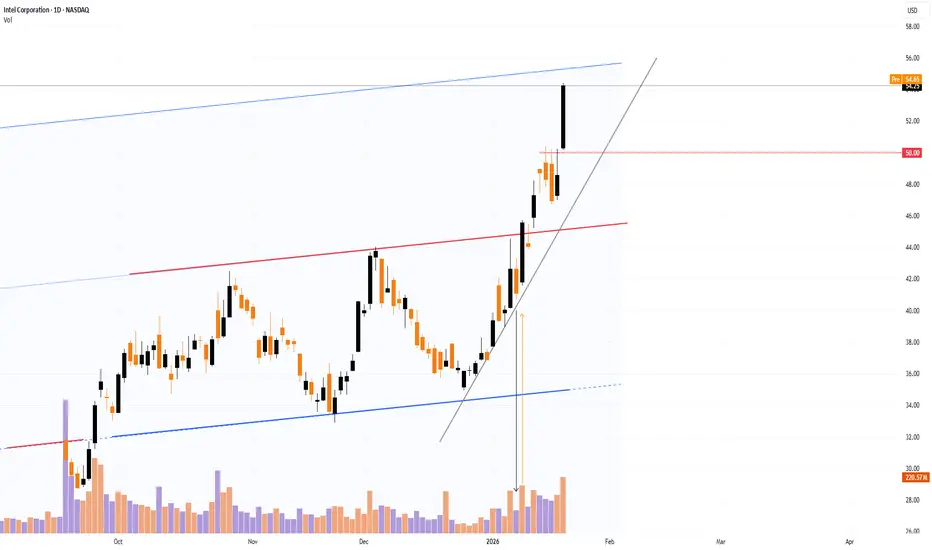
Intel (INTC) Shares Surge Ahead of Earnings ReleaseIntel (INTC) Shares Surge Ahead of Earnings Release
Yesterday, Intel (INTC) shares jumped by 11% in a single session, climbing above $54.00 — a level last seen in early 2022.
The sharp rally reflects several factors:
→ the psychological impact of breaking above the $50 threshold;
→ a short squeeze effect;
→ prevailing bullish sentiment ahead of Intel’s earnings report, due to be released after the close of the main trading session today.
Optimism is being driven by:
→ Analyst commentary (notably from HSBC), suggesting that the evolution of AI from simple chatbots to autonomous agents requires massive CPU capacity, not just GPUs. This implies a potential shift in demand away from Nvidia’s products towards Intel’s server chips.
→ Successful implementation of the 18A process technology and strong prospects for Panther Lake processors. Market participants may be expecting Intel to unveil ambitious plans for 2026, signalling the company’s emergence from its recent difficulties.
Technical Analysis of INTC Shares
On the morning of 8 January, when analysing the INTC chart, we:
→ confirmed that the broad long-term channel remains valid;
→ noted that the line dividing the upper half of the channel into two quarters was showing signs of resistance, based on volume analysis;
→ considered the likelihood of a pullback.
As the chart illustrates:
→ a pullback did occur, but it was limited in scope and accompanied by below-average volumes, indicating weak selling pressure;
→ as early as 9 January, bulls viewed the stock as attractive near the trendline (shown in grey) and launched a renewed advance. This move proved successful, with the formation of a wide bullish candle closing at the highs on rising volume. Declining volume during pullbacks and increasing volume on advances is a classic hallmark of a bullish market.
As a result, INTC shares have risen by more than 130% over the past six months. However, it cannot be ruled out that the earnings release may mark a culmination of the uptrend near the upper boundary of the long-term channel.
This article represents the opinion of the Companies operating under the FXOpen brand only. It is not to be construed as an offer, solicitation, or recommendation with respect to products and services provided by the Companies operating under the FXOpen brand, nor is it to be considered financial advice.
Intel (INTC) shares surge following chip unveilingIntel (INTC) shares surge following chip unveiling
Intel (INTC) shares jumped above $44.30 yesterday, marking a 21-month high. The rally was driven by news from CES 2026, where the company unveiled its new Core Ultra Series 3 processors (codenamed Panther Lake). These are Intel’s first consumer chips manufactured using the advanced Intel 18A process technology.
Market participants interpreted the announcement as evidence that Intel’s ambitious turnaround strategy to restore its technological leadership is gaining traction. The launch of the 18A node suggests that Intel is once again capable of competing with TSMC on the leading edge of semiconductor manufacturing.
According to media reports, several analysts have raised their price targets for INTC shares, as the new technology opens up the prospect for Intel to secure contract manufacturing orders from major players such as Nvidia and Apple.
Technical analysis of INTC shares
On 3 December, when analysing the INTC chart, we:
→ identified a broad long-term price channel;
→ highlighted the importance of the $20 level, which appeared to act as support from institutional investors;
→ noted that the line dividing the upper half of the channel into two quarters could function as resistance.
As indicated by the red arrow, this line has indeed acted as a reliable barrier to further upside. Volume analysis is particularly noteworthy: on two occasions when INTC shares rallied towards this level, we observed:
→ a surge in trading volumes;
→ followed by a subsequent pullback.
It is possible that the move above the psychological $40 level, combined with positive news flow, generated FOMO-driven demand. Institutional traders may be using this demand to lock in profits on long positions accumulated around the $20 zone.
Given the long upper wick on yesterday’s candlestick, we could assume that the identified resistance line may hold, and that a third attempt to break above it could once again result in a pullback.
This article represents the opinion of the Companies operating under the FXOpen brand only. It is not to be construed as an offer, solicitation, or recommendation with respect to products and services provided by the Companies operating under the FXOpen brand, nor is it to be considered financial advice.
INTC Weakness Exposed — Are Sellers Still In Control?🔥 INTC Bearish Profit Play — Smart Money Thief Mode Activated?
📌 Asset
INTC — Intel Corporation
NASDAQ Exchange | Stock Market Profit Playbook
🕒 Swing Trade / Day Trade Setup
🧠 Market Bias
📉 Primary Bias: Bearish
Price structure shows weak momentum, failed bullish continuation, and distribution behavior near resistance. This setup favors controlled downside continuation rather than aggressive longs.
🎯 Trade Plan (Bearish Thief Setup)
🔑 Entry
📍 Flexible Entry Zone
➡️ Any favorable price level aligned with bearish confirmation
(Structure break, rejection, or weak bounce)
🛑 Stop Loss
⚠️ Thief-Style SL: 38.00
Dear Ladies & Gentlemen (Thief OGs),
This stop-loss level is NOT a recommendation.
Risk management is your own responsibility — trade at your own risk and adjust according to your strategy.
🎯 Take Profit Zones
Primary Target 🎯
✅ TP-1: 34.00
Extended Target (Escape With Profits) 💰
🚀 TP-2: 31.00
📌 Why TP-2 matters:
Strong historical support zone
Oversold conditions likely to appear
Potential trap & reaction bounce
Broader market correlation suggests profit-taking is wise here
Dear Ladies & Gentlemen (Thief OGs),
These targets are NOT mandatory.
Secure profits based on your own plan and risk tolerance.
🔍 Technical Breakdown (Clean & Professional)
📉 Lower-High Structure intact
❌ Failed bullish continuation
📊 Weak volume on pullbacks
🧠 Distribution near resistance
🔄 Correlation with tech sector weakness
This supports a sell-the-rally / continuation downside approach rather than bottom-fishing.
🔗 Related Pairs & Correlation Watchlist
Keep an eye on these correlated instruments 👇
NASDAQ:NDX (Nasdaq-100)
➝ Tech weakness usually accelerates downside in INTC
NASDAQ:SOXX (Semiconductor ETF)
➝ Sector confirmation strengthens bearish conviction
NASDAQ:NVDA / NASDAQ:AMD
➝ Relative strength comparison — INTC underperformance adds pressure
TVC:DXY (US Dollar Index)
➝ Strong USD often pressures equities, especially tech
📌 If these pairs remain weak, INTC downside probability increases.
🧠 Master Trader Notes
This is NOT financial advice
No prediction — only reaction
Capital preservation > hero trades
Take profits when market offers them
If anything here feels aggressive, scale down — the market will always give another setup.
✨ “If you find value in my analysis, a 👍 and 🚀 boost is much appreciated — it helps me share more setups with the community!”
⚠️ Disclaimer
This is a thief-style trading strategy just for fun.
Educational & entertainment purposes only.

$INTC Is Extremely Oversold ... and frustrating
- Every time that Intel is oversold on Williams indicator, meaning -80 to -100 (current is -91.62 - extremely oversold), it bounces hard
- I have highlighted every instance since November 2024, where the momentum indicator was at oversold levels - and every single time came a massive bounce / rally
- It has been a frustrating downtrend, but every single indicator is showing bullish momentum
-- In fact, the 100 and 200 day moving averages are still rising, and has maintained the golden cross since late September
-RSI-based MA is going to converge with RSI levels over the next 2 weeks, as RSI rises - looking for volume buyers
The market is great at convincing you that "it's over". Until it isn't. Price moves sentiment.
Inevitable that Intel will bounce on this uptrend I have highlighted.
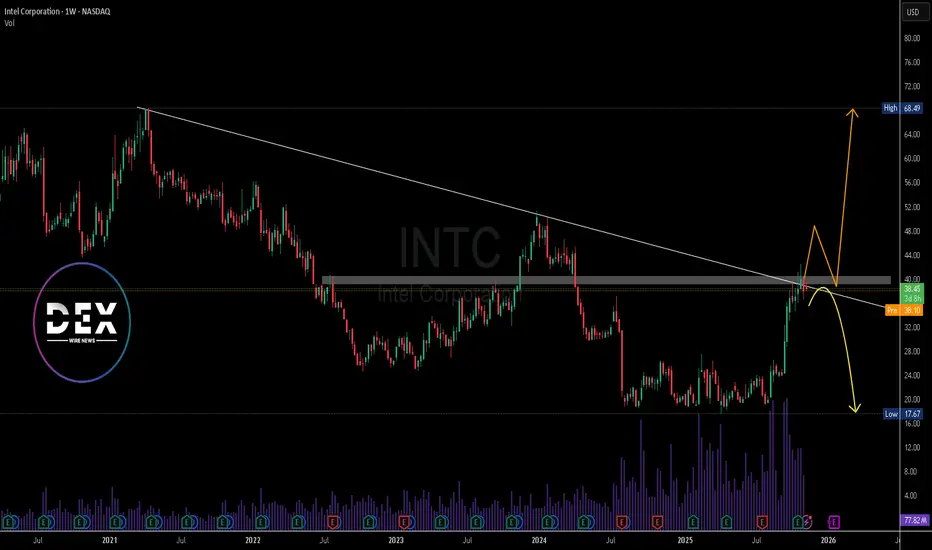
Intel - This behavior is wonderful!🎉Intel ( NASDAQ:INTC ) respects all structure:
🔎Analysis summary:
Just in the end of 2024, Intel perfectly retested a major long term horizontal support. After we then witnessed bullish confirmation, it was so obvious, that Intel will create a move higher. Now, Intel rallied +120% and is ready for a shorter term correction now.
📝Levels to watch:
$45
SwingTraderPhil
SwingTrading.Simplified. | Investing.Simplified. | #LONGTERMVISION

Intel (NASDAQ: $INTC) Eyes SambaNova AI AcquisitionIntel Corporation (NASDAQ: INTC) is reportedly in advanced discussions to acquire AI chip startup SambaNova Systems, a move that could reshape the competitive dynamics of the enterprise AI hardware market. SambaNova provides full-stack AI solutions, including AI appliances, data-center servers, and software, that compete directly with Nvidia’s DGX systems and other AI-accelerated computing platforms.
Rumors about the deal began circulating in October, but recent reports suggest the acquisition is becoming increasingly likely. The two companies already share deep ties: Intel CEO Lip Bu-Tan currently serves as SambaNova’s executive chairman, while Intel Capital has invested in the startup. SoftBank, which took a stake in Intel earlier this year, is also a SambaNova investor, further tightening strategic alignment.
If Intel proceeds with the acquisition, it would gain immediate access to an AI computing segment where it has fallen behind. Currently, Intel lacks a product equivalent to Nvidia’s DGX racks or emerging competitors like GroqRack. SambaNova’s AI racks are already deployed across finance, healthcare, defense, and government sectors, giving Intel a direct entry point into high-performance enterprise AI markets.
Beyond hardware, SambaNova’s software stack and model-training solutions would enhance Intel’s push toward end-to-end AI platforms, supporting its turnaround strategy in both data-center and edge computing. However, the acquisition would still require regulatory approvals and feasibility studies before moving forward.
Technical Analysis
The INTC chart shows a major breakout above a long-term descending trendline, a bullish structural shift after years of compression. Price currently trades around $38–$40, retesting the trendline from above, which now acts as support. A successful retest could trigger continuation toward the $45–$50 zone, with a broader target near the next major resistance at $65–$70.
Volume expansion during the breakout supports bullish momentum, while RSI remains elevated but not overbought, indicating healthy trend strength. Failure to hold above the trendline could send price back to the mid-$20s, but the technical bias remains bullish as long as it stays above $34.c

Intel (INTC) Shares Trade Above $40Intel (INTC) Shares Trade Above $40
Earlier, we highlighted the factors that helped Intel (INTC) shares recover strongly in 2025, including support from the U.S. government, leadership changes, investment from Japanese conglomerate SoftBank Group, and more.
According to recent reports, Intel could gain a major new client in Apple (AAPL). Yahoo Finance cites analyst Ming-Chi Kuo, who stated on X that Intel’s prospects have “improved significantly.” Intel may begin producing chips for Apple as early as 2027, potentially reducing reliance on Taiwan’s TSMC.
Although there are no official confirmations, sentiment on the market is positive. Since the start of last week, INTC shares have risen by over 20%, reaching their highest level since spring 2024, breaking past the psychological $40 mark.
Technical Analysis of INTC
Six months ago, INTC’s chart showed $20 as a key support level, backed by major investors. Since then, the stock has formed an ascending channel (shown in blue), which was extended upwards in September.
Bulls have steadily asserted control, pushing the price to higher levels, with support at $30 and later the channel’s median. After a brief consolidation in late November, the $40 level was breached.
Currently, the price sits near a line dividing the upper half of the channel into quarters, which may act as resistance, especially given signs of overbought conditions on key technical indicators.
If Intel’s strategic collaboration with Apple is officially confirmed, it could generate around $1 billion in revenue, leaving the current technical levels on the chart far below the potential upside.
This article represents the opinion of the Companies operating under the FXOpen brand only. It is not to be construed as an offer, solicitation, or recommendation with respect to products and services provided by the Companies operating under the FXOpen brand, nor is it to be considered financial advice.
Intel Corporation and Apple Rumors Ignite a Bullish SurgeIntel Corporation (NASDAQ: NASDAQ:INTC ) jumped more than 10% on Friday as fresh speculation pointed to Apple potentially becoming a major new customer. The rally followed a social media post by TF International Securities analyst Ming-Chi Kuo, who suggested industry surveys indicate Apple could begin sourcing processors from Intel as early as 2027. The possibility marks one of the most meaningful shifts in Intel’s long-term manufacturing prospects in several years.
Investors reacted quickly because a deal with Apple would strengthen confidence in Intel’s turnaround strategy. Despite a strong year—where shares have doubled in value—Intel continues to face questions about its ability to secure durable, high-volume contracts. Apple, known for its vertically integrated chip ecosystem, would represent a major validation of Intel’s foundry ambitions. While neither company has publicly commented, the speculation alone has reinforced bullish sentiment surrounding Intel’s expanding customer pipeline.
Intel’s recent performance is underpinned by several high-profile partnerships, including collaborations with Nvidia (NVDA) in advanced chip manufacturing. These deals, combined with ongoing restructuring efforts, have pushed investor confidence higher. Yet the company remains far from its historical highs, and long-term execution remains the central focus for the market.
Technical Analysis
Intel trades in a strong bullish structure, now pressing against a key descending trendline that has acted as resistance for months. Price is breaking above this level with clear momentum, signaling a possible shift into a broader upward continuation. The next resistance sits at $50, followed by a major level at $68 if bullish pressure sustains. On the downside, support rests at $32, with deeper support at $25 if the trend cools. Current momentum favors the bulls as long as price holds above the breakout zone.
Intel (NASDAQ: $INTC) Rises After CEO’s Chinese SpeechIntel (NASDAQ: NASDAQ:INTC ) gained momentum in Wednesday’s trading session after CEO Lip-Bu Tan delivered a speech in Chinese during Intel’s 40th-anniversary celebration in the Chinese market. While the content of the speech was important, the fact that Tan used Chinese for the address made the biggest impact. Investors viewed the gesture as a strategic cultural connection and a positive signal for Intel’s presence in China, helping push shares higher by more than 2%.
Tan used the anniversary event to highlight Intel’s long-term commitment to the Chinese market, emphasizing collaboration, innovation, and partnership during the current surge in artificial intelligence technologies. He called on partners to continue working with Intel to seize new opportunities created by rapid AI growth and evolving semiconductor demand.
The CEO reinforced Intel’s core mission, saying his priority is to create products that solve customers’ most pressing challenges and restore confidence in the broader market. Chinese analysts interpreted the speech as a smart move to appeal directly to local consumers and business partners. While trade restrictions still limit which technologies can be imported into China, the landscape continues to shift along with negotiations and global demand.
Technical Outlook
Intel’s chart currently leans bearish. Price faced rejection at a strong double resistance zone around $39, formed by horizontal resistance and a descending trendline. Bears maintain short-term control unless price breaks above this confluence. If bulls manage a breakout, the next target becomes the previous high near $51. If rejection continues, the next major support sits far lower around $17, making it an important level for long-term buyers.
$INTC is set to go to $50I shared this when Intel was sitting at $23 and I am still bullish.
We pulled back to last quarterly opening price which is $34. I wouldnt be surprised if we bounce from here.
Anyway, sentiment is very positive on Intel so good luck.
First $50 then $100 in a long run.
Intel CEO Takes Charge of AI Division After CTO Joins OpenAiIntel Corporation announced that Chief Executive Officer Lip-Bu Tan will now directly oversee the company’s artificial intelligence operations following the departure of Chief Technology Officer Sachin Katti, who has joined OpenAI. Katti will reportedly lead OpenAI’s compute infrastructure development — a vital role in powering artificial general intelligence (AGI) research and large-scale applications.
The move underscores the fierce competition for top AI talent as chipmakers and AI labs race to develop next-generation computing systems. Intel said in a statement that AI remains a top strategic priority, and the company is doubling down on executing its product roadmap for emerging workloads under Tan’s leadership. However, the transition adds pressure on Intel, which continues to struggle in its foundry business and faces tough competition from Nvidia and AMD in the AI chip segment.
Tan, who became CEO earlier this year, has been reshaping Intel’s leadership structure to accelerate innovation and streamline operations. Analysts view his direct involvement in AI as a signal that Intel aims to close the gap in high-performance computing and reposition itself as a key player in the AI hardware space.
Technical Outlook:
Intel shares are currently trading around $38 after a sharp rally that broke a long-term downtrend line. The chart indicates the stock is now testing major resistance near the $40 level. A breakout and retest above this zone could pave the way for a move toward $68–$70, aligning with the bullish scenario shown. However, if the price fails to hold above the trendline, a correction back toward $28 or even $20 remains possible.
Investors are watching closely as Intel’s leadership changes and AI strategy could determine whether this breakout sustains or fades.
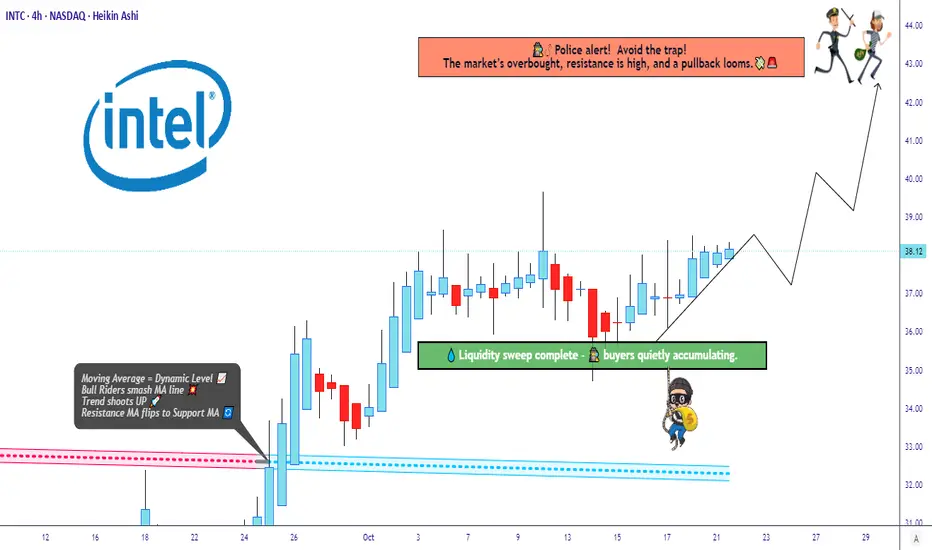
“Intel’s Bullish Structure Building Power for a Breakout Move!”🔥 INTC “Intel Corporation” – The Thief’s Profit Playbook 🕶️💰 (Swing/Day Trade Setup)
⚔️ Plan Overview – Bullish Setup with Thief Precision
The Thief Strategy is in play here — a smart layering entry method designed to steal optimal positions from impatient traders. 🕵️♂️
Our mission: Load, Layer, Loot, and Leave with Profits.
🎯 Entry Plan (Layering Method)
We’re layering multiple buy limits (thief-style) to catch value dips:
Buy Limit Layers: 35.00 💵 → 36.00 💵 → 37.00 💵
(⚙️ You can expand your layers based on your risk tolerance and style — thieves adapt fast.)
💡 Why Layer? Because a pro thief never rushes a vault — we break in step-by-step. This builds position strength while keeping entry efficiency.
🛡️ Stop Loss (Thief’s Escape Hatch)
📉 Stop Loss @34.00
💬 “Dear Ladies & Gentlemen (Thief OG’s) — I’m not recommending you set my SL. You’re the boss of your vault. Manage your own risk, grab the bag, and disappear in profits like a shadow.” 🌑💼
🚀 Target Zone (Profit Extraction Level)
🎯 Main Target: @43.00
📛 Police Barricade @44.00 — strong resistance zone + overbought region + potential bull trap.
🧠 Play it smart — escape clean with gains at 43.00 before the blue lights flash. 🚨
💬 “Dear Ladies & Gentlemen (Thief OG’s) — not recommending you follow my TP blindly. Make your own move, take your profit, and vanish like a ghost.” 👻💸
🧩 Technical Breakdown
Intel (INTC) forming a strong base accumulation near the $35–37 range.
Volume Profile shows liquidity pockets aligning with the layering zones.
RSI hovering mid-levels → room for upside before overbought conditions hit near $43–44.
EMA Confluence: Price reclaiming short-term EMA — early trend reversal signals in motion.
Fundamental Boost: Intel’s AI chip roadmap and cost-optimization headlines add bullish narrative momentum. ⚙️📈
🌍 Related Pairs to Watch (Correlation & Market Sync)
💠 NASDAQ:NVDA – Leader in AI semis; momentum correlation ~0.78 with INTC.
💠 NASDAQ:AMD – Similar sector swing potential; can mirror INTC lag-moves.
💠 NASDAQ:SMH (VanEck Semiconductor ETF) – Sector strength indicator. A breakout above resistance supports INTC’s upside.
💠 NASDAQ:QQQ / NASDAQ:NDX – Tech-heavy indices; bullish bias strengthens chip sector sentiment.
🧭 Correlation Tip: If NVDA or QQQ rallies strongly while INTC consolidates — that’s your thief’s golden signal to layer your entries quietly before the breakout sparks. ⚡
⚙️ Risk Management Wisdom
Never go all-in; layer your risk like a pro.
Keep your SL tight but mind flexible.
Respect zones — police don’t like thieves hanging around too long. 😎
✨ “If you find value in my analysis, a 👍 and 🚀 boost is much appreciated — it helps me share more setups with the community!”
📜 Disclaimer: This is a Thief-Style Trading Strategy shared for educational & fun purposes only. Not financial advice. Trade wisely — stay stealthy. 🕶️
#INTC #Intel #StockMarket #SwingTrade #DayTrading #ThiefStrategy #LayeredEntries #TechnicalAnalysis #NASDAQ #StocksToWatch #AIStocks #TradingViewCommunity #TradingViewEditorsPick #Semiconductors #NVDA #AMD #QQQ #ProfitPlaybook
Intel - The parabolic bullrun!💸Intel ( NASDAQ:INTC ) rallies significantly:
🔎Analysis summary:
After Intel retested a major support a couple of months ago, we already witnessed an expected rally of about +100%. Considering that the next horizontal resistance is about +25% higher, a bullrun continuation remains totally likely. Intel just perfectly plays out.
📝Levels to watch:
$45
SwingTraderPhil
SwingTrading.Simplified. | Investing.Simplified. | #LONGTERMVISION

Intel - The breakout happens now!💰Intel ( NASDAQ:INTC ) will break out quite soon:
🔎Analysis summary:
For the past two decades, Intel has overall been moving sideways. While we witnessed significant swings during this period of time, Intel recently retested another strong support area. If Intel now breaks the short term resistance, we will officially see the bottom formation.
📝Levels to watch:
$25
SwingTraderPhil
SwingTrading.Simplified. | Investing.Simplified. | #LONGTERMVISION

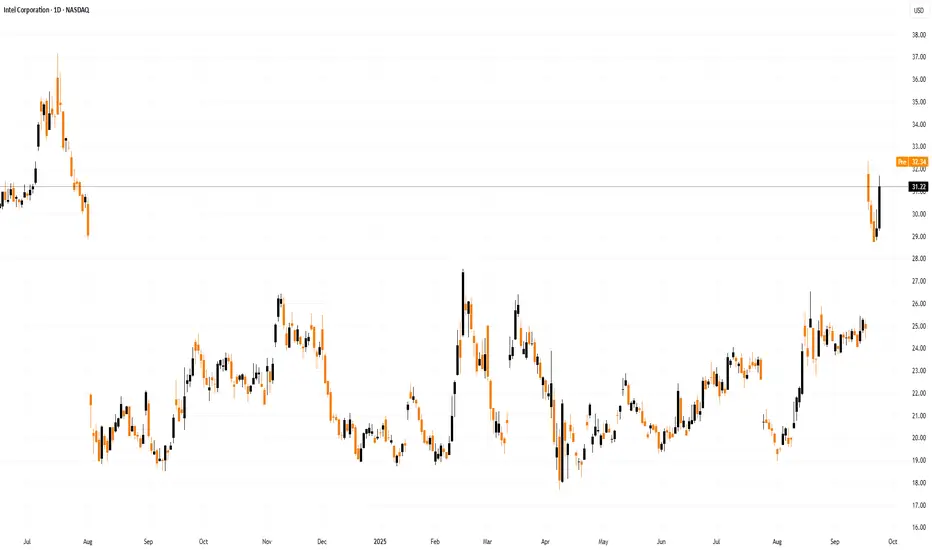
Intel (INTC) Shares Trade Around $30Intel (INTC) Shares Trade Around $30
In August, we noted that:
→ Intel (INTC) shares gained strong bullish momentum following reports that the US government was in talks to acquire a stake in the company;
→ the INTC chart was signalling that the depressed market, in place since 2021, was undergoing a fundamental shift in sentiment, with a potential rally foundation being formed.
Last month also brought the official announcement that Japanese conglomerate SoftBank Group would invest $2 billion in Intel. September, in turn, delivered further reasons for price gains:
→ On 18 September 2025, Nvidia officially announced a $5 billion investment in Intel and the launch of a multi-year strategic partnership. This came as a shock to the market: instead of competing, the two giants decided to join forces in developing new products. INTC shares gapped strongly higher, surpassing the psychological $30 mark for the first time this year.
→ More recently, Bloomberg reported that Apple is also considering investing in Intel. Although this remains at the level of speculation (with no official confirmation from either side), INTC shares rose by more than 6% yesterday.
Technical Analysis of INTC Shares
In earlier chart analysis, we highlighted the importance of the $20 level, which appeared to act as support from large players. This may have reflected confidence that the government would not allow a strategically important US company to be left behind in difficult times, particularly in the context of technological competition with China.
For many months, INTC shares had been in decline (shown by the red line). However, the price action in August–September has broken this pattern, confirming earlier assumptions. Higher lows and higher highs in 2025 have established an ascending channel (shown in blue), with key features as follows:
→ in early September, the price consolidated near the median, signalling a balance between supply and demand around $25;
→ September’s bullish news shifted the balance in favour of buyers, with INTC stock jumping towards the upper boundary of the channel.
From a bearish standpoint, potential obstacles to further growth include:
→ the psychological $30 level (which acted as support in May);
→ the upper boundary of the blue channel.
Although the market looks overbought, it is possible that:
→ buyers may refrain from taking profits in anticipation of longer-term gains;
→ and if positive rumours of further investment in Intel continue to be confirmed, this could drive an extension of the upward trend — potentially along a steeper trajectory (shown in orange).
This article represents the opinion of the Companies operating under the FXOpen brand only. It is not to be construed as an offer, solicitation, or recommendation with respect to products and services provided by the Companies operating under the FXOpen brand, nor is it to be considered financial advice.
Intel | INTC | Long at $20This is going to be purely about technical analysis since Intel NASDAQ:INTC has a 90x P/E and has not proven themselves to be a viable challenger in the semiconductor market (yet...). Bad news could continue to destroy this ticker, but without that news, there could be some recovery in the near term.
The NASDAQ:INTC chart is in an overall downward trend. However, based on a few of my selected simply moving averages (SMAs), there is some predictability around support/resistance areas. Some of my favorite setups are a nice bounce on the lowest (green) selected SMA, occurring in October 2022 for a "rip then dip" to the second lowest (blue) - which it hit now. Often, but not always (I can't stress this enough), this green to blue SMA bounce represents a very strong support area during a downward trend. The other move is a further dip to retest the green SMA, but I suspect that would come with tremendously bad news for Intel... let's hope not, though.
Currently, NASDAQ:INTC is in a personal buy zone at $20.00 based on technical analysis only. A stop has been set if it drops below the blue SMA (which is may further test).
Target #1 = $28.00
Target #2 = $32.00
Target #3 = $60.00+ (very long-term, but high-risk unless fundamentals change)

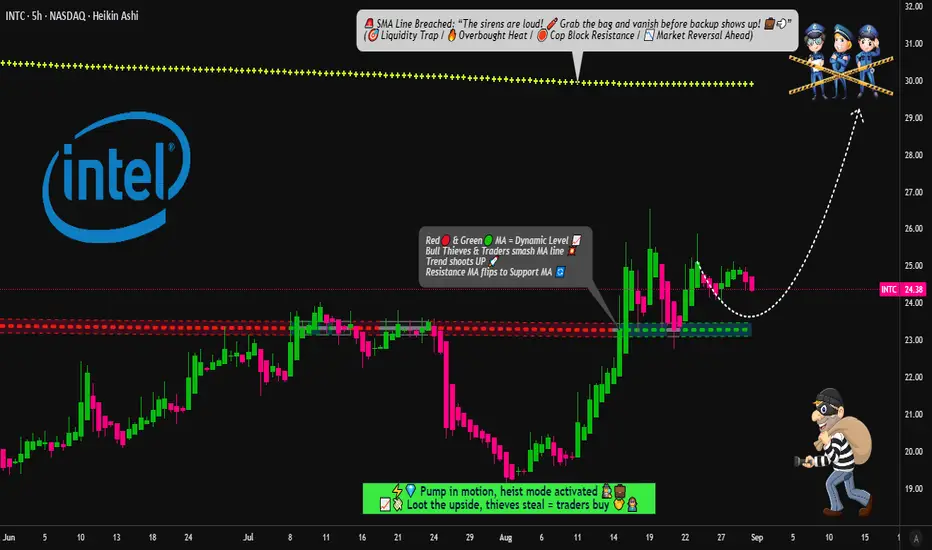
INTEL Heist Playbook: Buy the Dips, Escape Before the Sirens🔓💻 INTEL CORPORATION "Chip Heist" Stock Raid 💻🔓
🎯 Plan: Bullish Robbery | Targeting $30.00 | Stop Loss: $21.00
💰 Layered Limit Entries | Silicon Valley Loot | Calculated Takedown
🚨⚠️ Attention TRADERS, Tech Pirates & Market Mercenaries! ⚠️🚨
The INTC data vault is cracked, and the Thief Trader squad is executing a multi-layer LIMIT ENTRY HEIST – stacking shares like we're loading the getaway van. 🚐💾⚡
👀 We ain't chasing price – we're ambushing it with precision. Every discount? A planned acquisition.
💥 ENTRY: Any Price Level is a Gift 💥
"Bullish on Silicon" – we're collecting shares on any dip into value town!
Deploy buy limits at key psychological support layers: $25.00, $24.00, $23.00 (Add more layers based on your own capital).
Thief-style: We don't buy the hype; we steal the undervalued chips.
🛑 STOP LOSS: This is a Thief SL @ $21.00 🔐
Dear Ladies & Gentleman (Thief OG's), this is set at the breakdown panic zone – where the weak hands get shaken out.
Adjust your final SL based on your own risk appetite and strategy. Size wisely.
🎯 TARGET: $30.00 💸
The police barricade is there, so kindly escape with your stolen money before arrival.
We're targeting the next major resistance vault. Take profits and live to trade another day.
🧠 Swing Traders? Load the boat. Day Traders? Snatch the quick flips. Investors? Stack and hold. 💵☕
Use a trailing stop loss to protect your capital as the trend accelerates.
🕵️♂️ THIEF TRADER INSIGHTS:
📊 Backed by tech sector momentum, oversold bounces, and order block analysis.
🗞️ Earnings? Chip news? = increased volatility = adjust your layers accordingly.
⚠️ HEIST PROTOCOL:
✅ Avoid over-leveraging – this is a layering strategy, not a casino bet. 📉
✅ Use risk-adjusted position sizing on every limit order.
✅ Discipline is key. The market will deliver the discounts; you just need to be patient.
❤️🔥 Hit that 💥 LIKE & FOLLOW 💥 if you're riding with the Thief Squad!
Support the strategy. Respect the plan. Stack your gains like a true Market Outlaw.
🔔 Follow for the next HEIST. Big bags only. 💼🚀📈
“The market is a river of money—flowing from the impatient to the patient.” – Thief Trader
#INTC #Intel #StocksToWatch #TradingPlan #SwingTrading #StockMarket #Investing #LayeredEntries #ThiefTrader #ChipHeist
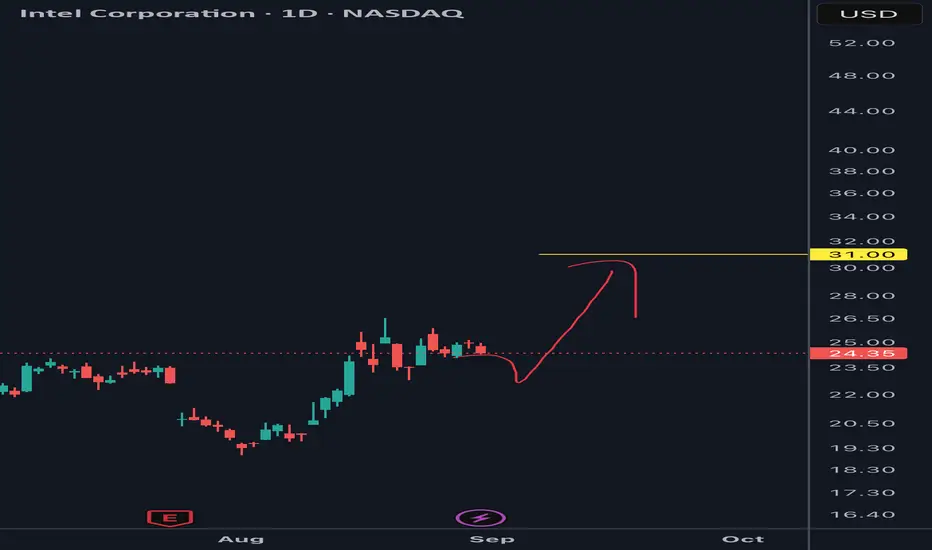
$INTC the next leg to $34-44I took a trade last month that ended up going 500%, now I think it's time for the next leg of the move to play out.
The chart shows a recent breakout of a bull flag and price now testing a key resistance level.
I think once price breaks resistance here and can make it above that $26 resistance level, we'll see a large move higher start.
I think the move has the potential to reach $34-37, but can potentially make it all the way up to $44-45 level.
Let's see how it plays out.

Is Intel about to blow?NASDAQ:INTC
What I expect from Intel in coming weeks
First drop just a little then $30
Intel - The bottom is in!🔮Intel ( NASDAQ:INTC ) forms a clear bottom:
🔎Analysis summary:
After a consolidation of about three decades, Intel is now creating a strong bottom formation. With the retest of a major horizontal support area, Intel is respecting clear market structure. Quite likely therefore that Intel will soon start its next major higher timeframe bullrun.
📝Levels to watch:
$25
SwingTraderPhil
SwingTrading.Simplified. | Investing.Simplified. | #LONGTERMVISION
