bank nifty @its major support..... dont short as we can see both nifty and banknifty both are @ major support levels. 99.9% bias i will keep of buying. i wont will be only looking for buying opportunities tommorrow. otherwise no trading.
Intradaytrader

NOT 100% sure but 99% i will be bullish bias..... what about u.these days u can't be sure cuz bank nifty is changing colours faster than my Chinese lights. still I'm more of a bullish bias than bearish. but will see what happens tomorrow.

POTENTIAL SHORT THE YELLOW STONE!!!We have a strong bullish trend that broke the trendline, and we can see that gold made a head and shoulder pattern after breaking the trendline...
The break of the last low created, confirms our potential down move.
Price will either retrace deeper, go straight to 1830.
Lets wait and see!!

TITAN (SWING + INTRADAY)As we can see TITAN is on important support.so we can short after breaking that imp support and we can go long after breaking 200ema on 30min frame. Targets and other imp information are mentioned in the chart itself.

Titan short for intraday - Almost ready for a breakout !# Titan is forming a flag pattern on an hourly timeframe!
# Also, forming a double top and double bottom on 15 mins timeframe!
# Getting ready for a breakout!
# Rsi is decreasing and stock is losing its momentum!

A Intraday set-up for COTI!!!!A inverse head and shouder and price near a swing-term resistance!
A breakout on the upside will show some good momentum just like CELR!

For Intraday in 15 min Chart.Just for Educational Purpose .
Before Your Investment Do Your own Research .
Keep Profit.

GBPUSD REVISEGBPUSD moving up as expected but H4 shown that its already break dominan candle. My target will be on 161 which is also SBR zone. Hapoy trading!

NIFTY TRADE SETUP FOR MONDAYNIFTY TRADE SETUP FOR MONDAY
NIFTY Is closing below 14600 is weak sign
for Intraday. This is perfect trade setup
for option selling . Just follow the trend lines.
Thanks .

AMJLAND Analysis For Swing Traders Breakout After 2 YearsWeekly Swing Trade this isn't any type of tips or calls this is purely my views on the stock and my prediction is for a long bullish movement in the stock trade in with your own analysis I just wanted to share some of it

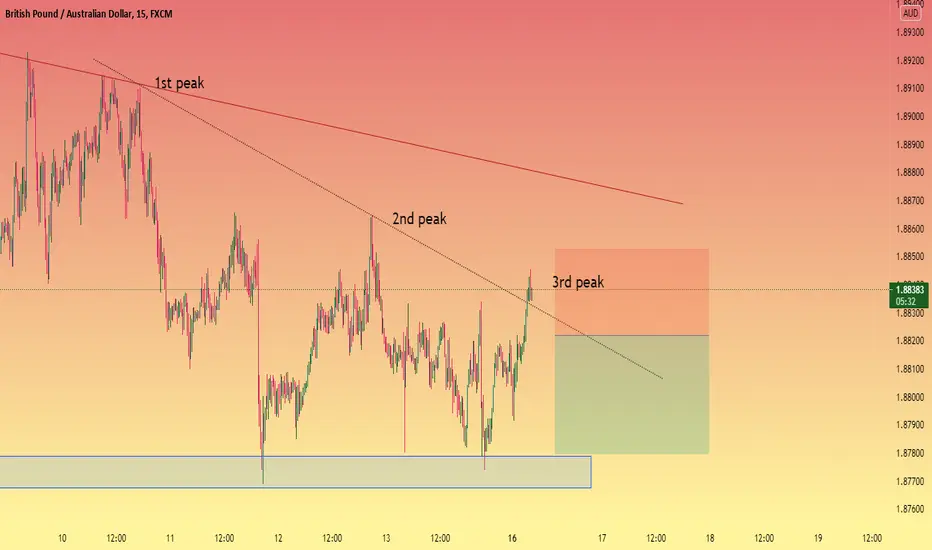
GBPAUD intraday 15 minute, get ready for sell entrythe price move below the minor trendline and now make a third peaks, watch if the price make an impulse bearish and fall down bellow 1.18217 then the next target will be on 1.87800 with the SL 1.18526 FX:GBPAUD

BITCOIN INTRADAY (1-HOUR TF) Update BTCHello guys.
A small update - now we are trying to catch a small short, where we will look for a support level from the 34100 and 34420 marks to open a long position.
Yesterday's review brought us another +3 take profit to our wallet.
I will not describe much, everything is indicated on the graph.
Position statistics:
25 profits
3 stop loss
I can provide each position and confirmations.
Since there are those who want to check the statistics, write to me in personal messages.
We are looking at the level of 38850 - at the moment it is one of the key levels
May the profit come with us.

PROG looks strongI like what PROG is doing here.
A lot of buying volume on June,11, consolidation, forming bullish flag.
Now breaking out above 3.00 level
Strong close yesterday means possible continuation today
Possible jump to 3.60 area, next target 5.00

NIFTY TRADE SETUP FOR TUESDAY
Nifty is buy on dip till sustain above 15600 and buy above 15815.OR we can sell CE option at top and put option on lower side with 15820 and 15590 SL.

GSPLSl-250
#CLEANANDCLEARCHARTS
There are 2 major resistance and stock have made a doji on one and consolidating on the upper resistance.(Which is a positive sign)
Shoot your queries in comment section.

INDIA CEMENT: LIFE LONG TRIANGLE PATTERN (18 YEARS)SL-145
The most profitable pattern is HERE. Do not just buy it in a day, start accumulating and average it at lower levels as market is weak for now(Best time to buy).
(Similar patterns in link below)
Shoot up your queries in comment section.

XAUEUR SHORT - INTRADAY/SWING POSITIONPOSSIBLE HEAD & SHOULDER FORMATION OR MORE LIKELY A DOUBLE TOP
NEW SHORT TREND IS FORMING on 1HR TF. LH & HL

ICICIPRULI LONG INTRADAY 10 MAR,2021Dear trader,
If u look at the chart of ICICIPRULI (analysis based intraday only) the ICICIPRULI support at 486 and target 1 at 500 and target 2 at 495 and stop loss at 480
The chart clearly indicates Bullish Trend you can also see the candle stick patters for more indepth analysis.
In Intraday most important thing is to enter and exit points.
Our signals are based on analytics, algorithms, mathematical derivatives.
Always be a responsible trader, kindly trade only when you have maximum opportunity in the market with minimum risk and with keynotes like data, analysis and proper strategies.
Kindly message us for strategies and analysis.

Pidilte { 15 M Long }Broke resistance in D frame & following RETEST THEORY in 15m tf.Rest is as per chart
Note :-
Entry - At the break of mentioned candle's low/high
Stop Loss -
In a Short Trade, I always use Previous Candle High ( PCH ) as a stop loss while entering the trade. Sometime I might use 15 M tf SL & trade in 30M tf which I'll mention. Vice Versa for long trades
Trailing Stop Loss ( TSL ) - Mostly I trail stop loss by PCH as price falls . I exit as PCH breaks & vice versa
Use of PSAR as TSL :- TSL get's hit in trend following due to noise, In such cases I use PSAR to be in trend & exit if PSAR direction change
You can use any one of above mentioned or your own way to manage risk
Time Frame :- I take ~ 90% of my intraday trades in 15m tf. Where my analysis might come from higher frames like W , D or 1hr chart pattern which will be mentioned.
Target :- I do set target line based on support / resistance slightly above/ below it . Please pay attention to it

Banknifty trade at support.we can take a long position above 30500 level for intraday beacause this is a important level of support and also a 30500 is a psychological level.

GBP/USD Short trade based off patterns from price actionPotentially a large swing trade setup coming next week.
Daily Chart -
Price has been in this ascending channel since march of this year and after the second touch of the pattern, we have the double top with another ascending channel leading up to the double top area.
4HR Chart -
Here is the price pattern in more detail. The first profit target is the start of the ascending pattern.
1HR Chart -
Im looking for simple flag continuation in order for an entry but enter the trade according to your plan.

EXIT AT COST PNC INFRADue to Time lapse of more than 5 days the stocks perform near the buy point and traded below the level
