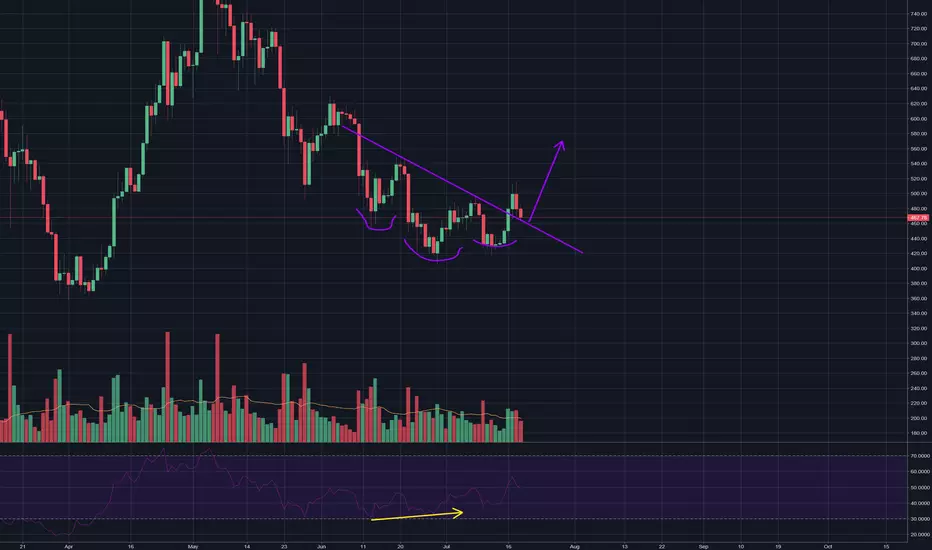
Bitcoin's inverse cup and handle possibility [BTFD]with some solid buys currently we might be forming a handle here for the inverse cup and handle pattern to form
lower red trend line is target if it breaks the purple neckline after a rebound from fib levels at 6800 supply zone down towards 5800-5600 being the final destination
after the buys/bids at NY open taking bitcoin up over 6400 we need to see good momentum in volume to break 6800 and get above 7k before any bull ideas again
will be shorting at 6800/700 area if it fails to get above 6900/6800
Inverse

An update on the inverse relationship between BNB and BTCHello, I recently posted a theoretical idea about how the relationship between BTC and BNB is inversely correlated. Today I am providing a zoomed in point of view for the upcoming BTC movements.
Please see original post here:
And the corresponding BTC path here:
Clearly, the theory is working out as anticipated. Today, I'd like to go zoomed in and understand on a lower time frame what'g going on.
In the above chart, we see that BNB is doing a low volume B wave, exactly what the B wave looks like. But it means that we have a C wave yet to build....So how does it get there, if BTC goes down and BNB goes up? And vice versa?
To hit our mark of 18544, which is a natural support and a fib retracement zone we need to see if BTC is going to go up during that period. I anticipate that it will:
So to boil it down a bit, we anticipate BNB dropping by 6.4% and if we do a 1:1 inverse ratio, that means that BTC is expected to rise by 6.4% as well. That would put BTC at around the 6300 Zone where it catches some decent resistance and also the territory of the (3) Wave down (which it can't penetrate with force). BNB is running a wave (4) Expanding Symmetrical bearish retracement presently. When it hits the 7300 mark, we should see a continuation wave (5) that terminates around 6700.
BNB acts as a tether when BTC drops sharply. So presently I am in BTC but as that limit approaches I will be rebuying BNB for the satoshical gain and also the fiat protection. When BTC bottoms out, moving back into BTC at 6700.

Bitcoins 1hr chart poss inverse H&STrading under 8000 again, we may see another push on the recent highs to finish the week off
US open shoqwed quick sell off followed by some solid bids going in
gotta break the neckline to be valid
these three tests of the support/resistance line show a strong bullish signal for intraday
targeting 8250-8300 and then expecting a bounce back down if volume is low towards 6800 area, but lets see, one step at a time...

Look like pumpy pumpers at it again. Potential payout for bulls.This crazy breakout lead into a head and shoulders, then faked me out and i realized it was an inverse head and shoulders! The MFI, CCI, MF, TTM SQUEEZE, and STOCASTIC RSI all came together to potentially make this push happen! I am trying to publish fast as I think its coming soon
: )
This is not financial advice. I would highly advise taking any of my trades ; )

Ethereum Showing WeaknessRight now, Ethereum is not showing the best signs of strength.
1.) Its current head and shoulder bottom has a downward slope, however, while Bitcoin has a horizontal slope proving how much more bullish bitcoin is comparatively.
2.) The bottom of the inverted head and shoulder did have less volume and it did show a bullish divergence which gives this inverted head and shoulder more robustness.
3.) The breakout was much weaker than I expected, especially for Ethereum, it barely made it past the neckline.
Currently:
4.) Ethereum is at the neckline, retesting it, but that is okay, so long as it does not pass the neckline it will not compromise the inverse head and shoulder. This means it would need some independence from bitcoin. A successful repulsion of the movement down would place the price objective of the inverse head and shoulders around 570.
Possible inverse H&S ETH/BTCNeckline sits at about 0.055 and at the moment, it looks like the right shoulder probably won't start to form until late August. Target-wise I think we'll see 0.1 again before the end of the year.


Inverse BYOC chart shows breakout nearInverse charts are useful for finding breakouts as I find it easier to judge support rather than resistance

BTC inverse perspectiveJust some food for thought. Seems like the bottom is near or already behind us. Correction is rapidly running out of steam.

AE Aeternity Inverse H&S w/ nested Cup and Handle Rocketship?Hi. I'm back. Missed you all.
We have a good scenario brewing with our old friend AE right now.
Multiple bullish formations nested within a giant bull flag. This is a rarity and does not get much better than this.
8 hour chart shows we are above the 100 ema, which is providing strong support (coincidentally the bottom of the flag).
Entry should be placed upon a breakout of the indicated cup and handle neckline.
Stop loss along the green support line.
Macd has crossed and rsi provides room for growth.
First and second targets noted.
Good luck and happy trading.

Happy Birthday from BTC, the king himself.drew it, figured i'd post it
Ez 100% winrate month
Trail stops behind previous 60m resistance op btw
BTC directional market btw
BTC ded btw
5k btw huehue

HUGE bear flag on Inverse monthly on bitstamprejected off the .236 didn't even wick to touch the .382
RSI making lower highs and lower lows following the price
short this sh*tcoin
oh wait.


UA Inverse Head & Shoulders Breaking out Now!See chart. Note: PRICE MUST BREAK RESISTANCE AT $17.47, IF IT DOES NOT the stock may consolidate in that small range or fall.
If a breakout is confirmed, at the very least I would expect UA to fill the gap between $21.4 and $24.97.

OMG - Small Dip then MoonOversold on the RSI, Stoch RSI has bearish cross. Forming an inverse head and shoulders pattern. Hold off on buying for a couple weeks and watch for the shoulder to form. I'm hoping for a dip of about 10%. Remember, with another crypto bull market beginning to form, pumps can happen very quick, so watch closely! Or, buy now and stay on the safe side, we will see some serious gains soon. :)
OMG has been on a lot of peoples watch list since its release. 2018 will be a big year for OMG, with the wallet and staking going live during Q2 this year. When it first released, the hype for OMG was huge, but it slowly died down. With the live product coming closer and closer, expect that hype to build back up, as well as staking to remove portion of the token supply being traded.

XMRUSD MONERO LONG!!!Inverse head and shoulders forming on the 4h time frame with a break and retest of neckline occurring.
4h also reveals the formation of a higher high
On the Daily, there is bearish convergence on the RSI, signalling a trend reversal to the upside.
Price on the Daily has also rejected the 61% fibonacci previously and has done so again. This is also reinforced by the lower bound of the wedge formation, creating strong support.
Price is expected to test the higher bound of this wedge formation at which our TP will be set
Entry:$214
TP: $320
SL:$178


We officially have gone above the neckline!We are officially above the neckline on the 4hr chart!! And with only 4 minutes left to go before this 4 hour candle closes...we may actually close this candle above the neckline! Very exciting time to be invested in btc! Now remember folks we still even if it closes above the neckline on the 4 hr chart are going to need the next 4 hr candle to close above it as well...we also want to see a huge swell in bullish volume to help confirm it. Also always good to double check indicators such as mac d and rsi to be safe....the biggest confirmation won't be until we have closed to 1day candles above the neckline...however 2 4hr candles closing above is a really good sign...I would even tread lightly and wait for a 3rd 4 hr candle if I was being super conservative. We may very well see the price dip back udner the neckline as a false breakout initially though so be prepared if that happens I imagine it will only take another day or 2 max before we get a legitimate breakout. Of course, this could be the legitimate breakout and we might not even ahve to worry about any fake outs. Best to be patient and see just to be safe though.

NEXT UP: BITCOIN In Major Fight Against Reigning Champion! SIGH.Hello Friends & Family, Ladies and Gentleman
Tomorrow... we are going to witness, the most anticipated match in the history of crypto trading for the heavy weight championship of the Woooorld! In the blue corner, we have BITCOIN, up and coming super star with a record of 10 wins and only 3 losses. In the red corner we have THE reigning, undisputed champion of the World, Mister 11,8K, with 25 wins and only 1 loss!
Are you ready?? Cryyypto-faans, aaaaare youuuuu reeeeady?? For the millions of people watching around the world, live directly from TradingView, ladies and gentleman, aaaare you reaaady to ruuuuuuuuuuuuuuumblee??
We are now taking a look at the 4h BTCUSD Chart. D4rkEnergYs 55 % scenario has been spot on so far. We are finally in an uptrend with the EMA50 way under us. The EMA100 are almost crossing the EMA200. Life IS indeed wonderful!
As you can see, we are still on the 3rd subwave on the 5th Elliot Wave. That means we are still cruising up, up, up. I want to you take notice of the RSI. If we don't manage to make 3 higher highs, we will very soon have a smaller correction, before we reach our first target at 11,8k, due to the ascending wedge on the RSI. But don't it let scare you. I also want you to pay attention to the MACD, how the bulls 2 times managed to reject a bearish MACD-Cross.
Last but not least. Many people have mentioned the lack of volume lately. And you guys are right. But there is a reason. In other markets when you shift into an uptrend we usually see more volume. The reason why that's not the case here is because the crypto market is still new, and we don't have big institutional buyers yet. But don't let it fool you.
So D4 is still super bullish on BTC, and it will only be a matter of time before we will stand face to face with the reigning champion of the World, Mister 11,8k! This will indeed be a tough match, but as I already predicted many weeks ago: Bitcoin WILL WIN in the end due to the inverse HS pattern and the new trust in the market.
I will follow up, and give you guys updates. Please hit that LIKE BUTTON and FOLLOW. Thank you so much <3
D4 is everywhere
D4 predicts everything

DGD vs BTC through December Peak and January/February CrashesWhen BTC spikes and drops in value many coins suffer and never recover. DigixDAO's purchasing power continues at a steady rate regardless of December's BTC peak and responded inversely to BTC's crash in early january and late February.

Hold on tight friends...This is how BTC messes your with your head...
Something tells me some whales will push the price to the limit of the bottom of the uptrend channel. Making the last weaker hands let got of their precious BTC before the bullrun of our life...
