IOTA's bull runThe IOTA bull run will begin soon
Long entry: 0,087 usd
Take profit: between 1000 / 2000 usd
In my opinion 1900 USD could be a likely target.
This is my personal opinion and this is not a financial advice! Good trading!
IOTA

IOTAUSDT Forming Falling WedgeIOTAUSDT is forming a clear falling wedge pattern, a classic bullish reversal signal that often indicates an upcoming breakout. The price has been consolidating within a narrowing range after recent weakness, suggesting that selling pressure is fading while buyers are starting to step in more actively. With steady volume supporting this phase—often a sign of accumulation happening quietly at these lower levels—the setup points toward a potential bullish breakout in the near term. If the price breaks decisively above the upper wedge resistance, we could see a strong move, potentially delivering gains in the range of 140% to 150% from the breakout point.
This falling wedge pattern commonly appears at the end of downtrends or during corrective pullbacks, and it's a solid indicator that market sentiment could be shifting from bearish to bullish. Traders keeping an eye on PORTOUSDT are seeing similar strengthening momentum as it approaches a key breakout zone. The solid trading volume here builds extra confidence in the setup, showing that participants are getting positioned ahead of a possible reversal.
The increasing attention on PORTOUSDT stems from growing optimism about its project fundamentals combined with this promising technical structure. A confirmed breakout with continued volume support could signal the beginning of a new bullish phase. This presents a solid opportunity for medium-term gains, particularly as the wedge pattern wraps up and buying pressure builds momentum.
✅ Show your support by hitting the like button and
✅ Leaving a comment below! (What is your opinion about this Coin)
Your feedback and engagement keep me inspired to share more insightful market analysis with you!

Is #IOTA Ready For a Major Bullish Wave or Will it Fall Further?Yello, Paradiser! Are you ready for what could be a brutal shakeout for bears or a golden entry for bulls on #IOTAUSDT? This falling wedge might not stay quiet for long. Let’s break down the #IOTA Setup:
💎#IOTAUSD is currently trading around $0.084 on the 4H timeframe and has just broken out of a textbook falling wedge pattern. This pattern typically signals a bullish reversal, but only when confirmed by proper retest and strength.
💎We’ve already seen a breakout followed by a retest of the descending resistance, which is a key early sign that momentum might be shifting. Adding to that, the 50 EMA is now attempting to turn into support, and if it holds, it significantly increases the probability of a strong bullish follow-through.
💎The demand zone between $0.080 and $0.084 is now acting as the make-or-break level for bulls. Holding above this zone keeps the bullish setup alive. If price continues to build structure above this area, we could see acceleration toward the first major resistance at $0.100, followed by a strong resistance near $0.120, where we expect sellers to become more aggressive.
💎However, as always, risk management comes first. The bullish thesis is invalidated if price breaks below the key support at $0.0717, where the structure would be compromised, and a bearish continuation toward lower liquidity zones could begin.
Trade smart, Paradisers. This setup will reward only the disciplined.
MyCryptoParadise
iFeel the success🌴

IOTA at Decision Point Near Falling Wedge SupportIOTA is forming a clear falling wedge after a prolonged bearish move. Price action shows lower highs and lower lows, but the range is contracting as both trendlines converge, indicating a slowdown in bearish momentum rather than strong continuation.
Price is currently reacting near the lower boundary of the wedge, where selling pressure has started to weaken. This zone represents a critical decision area. If IOTA manages to hold this base and break above the falling wedge resistance, a relief move toward the nearby resistance cluster around zero point zero nine to zero point one zero four becomes possible. Acceptance above that zone would signal the first meaningful short-term structure shift.
On the downside, failure to hold the wedge base would invalidate the reversal structure. In that case, price may continue lower toward deeper demand zones, keeping the broader bearish trend intact.
This setup is driven by falling wedge compression, momentum exhaustion, and support interaction at structural lows. Confirmation through breakout and acceptance is essential before expecting upside continuation.

Why i'm bullish on #IOTAI'm bullish on FWB:IOTA 📈
10+ Years of building finally paying off! 🔥
Recent News:
🔸"IOTA is now connected to 150+ blockchains and 550+ assets, joining the global infrastructure that moves value across the internet."
🔸US expansion with @UpholdInc & @BitGo adding IOTA
The combination of identity solutions, custody integrations, and cross-chain connectivity shows FWB:IOTA evolving from a concept into real-world infrastructure 🔥
Building infrastructure for mass adoption requires time, and we are getting close to seeing something huge 🚀
Technical outlook:
✅ Weekly support holding nicely - no break confirmation yet
⏳H4 falling wedge structure?
Currently neutral on H4 - consolidating under the main downtrend.
If bulls manage to break above, we could see a quick 30%+ move 📈
This should be an interesting play for whales. Wen moon? Soon™ 🌙
Not financial advice - DYOR & always manage your risk.

#IOTA/USDT on the Brink of a Massive Surge in the Next Bull Ru#IOTA
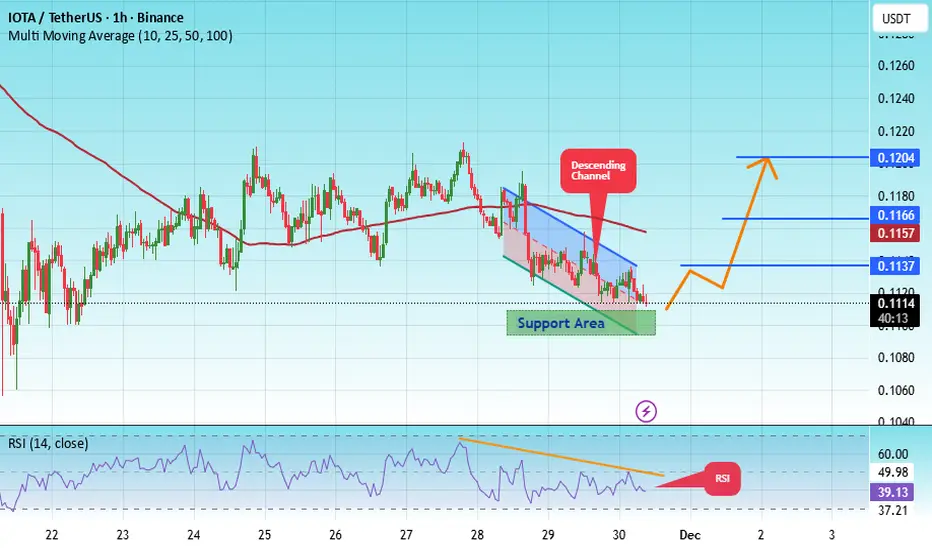
The price is moving in a descending channel on the 1-hour timeframe. It has reached the lower boundary and is heading towards breaking above it, with a retest of the upper boundary expected.
We have a downtrend on the RSI indicator, which has reached near the lower boundary, and an upward rebound is expected.
There is a key support zone in green at 0.1100. The price has bounced from this level multiple times and is expected to bounce again.
We have a trend towards consolidation above the 100-period moving average, as we are moving close to it, which supports the upward movement.
Entry price: 0.1113
First target: 0.1137
Second target: 0.1166
Third target: 0.1204
Don't forget a simple principle: money management.
Place your stop-loss below the support zone in green.
For any questions, please leave a comment.
Thank you.
IOTAUSDT UPDATE#IOTA
UPDATE
IOTA Technical Setup
Pattern: Falling Wedge Pattern
Current Price: $0.1272
Target Price: $0.1612
Target % Gain: 26.77%
Technical Analysis: IOTA is breaking out of a falling wedge pattern on the 4H chart, signaling bullish potential. The price has moved above the wedge’s resistance trendline, showing early signs of momentum shifting upward. With the breakout confirmed, the price is positioned to move toward the projected target area if bullish pressure continues.
Time Frame: 4H
Risk Management Tip: Always use proper risk management.

IOTA/USDT — Major Accumulation or the Beginning of a BreakdownThe IOTA/USDT (1W) chart is now entering a critical phase, potentially defining the major market direction heading into 2026.
Price is currently hovering right above the key demand zone between $0.15 and $0.12 — a level that has acted as a multi-year support floor since 2022.
Interestingly, the chart shows a long wick below the yellow box, followed by a strong recovery back inside the zone — a classic sign of liquidity absorption or a liquidity grab. This pattern often signals smart money accumulation and can mark the beginning of a macro reversal if confirmed by strong bullish weekly candles and increasing volume.
However, on the broader structure, the market still maintains a series of lower highs since its 2021 peak — meaning that sellers continue to dominate the long-term structure. Therefore, a confirmed breakout remains essential before assuming any sustainable trend reversal.
---
Technical Structure & Key Levels
Major Support (Demand Zone): $0.15 – $0.12
→ A historically strong area that has been tested multiple times over the past three years. How price reacts here will decide whether this is another accumulation phase or a breakdown setup.
Immediate Resistance: $0.245
Mid-Term Resistances: $0.349 → $0.475 → $0.629
High-Value Targets: $0.898 → $1.491 → $2.39
Historical Low: $0.0534 (extreme capitulation level if breakdown occurs).
---
Bullish Scenario — Potential Rebound from the Accumulation Zone
If the weekly candle closes above $0.15 and shows a continuation pattern with increasing volume, a major rebound phase could begin.
Step-by-step targets:
1. $0.245 → initial confirmation of reversal
2. $0.35 – $0.47 → mid-term swing targets
3. $0.63 – $0.89 → broader recovery range
A decisive breakout above $0.245 would mark a shift from bearish to neutral-bullish structure, opening the door for a sustained recovery phase into 2026.
---
Bearish Scenario — Breakdown Toward Historical Lows
If the price closes below $0.12 on a weekly timeframe, the bearish scenario becomes dominant.
Next potential downside targets:
$0.08 → psychological support
$0.0534 → historical capitulation zone
Failure to defend this range would indicate that buyers have lost control, likely triggering a new macro downtrend that revisits multi-year lows.
---
Conclusion
The $0.15–$0.12 zone remains the key battlefield between long-term buyers and sellers.
A successful rebound could mark the start of a new accumulation phase, while a clear breakdown would confirm another leg of the bearish cycle.
The upcoming weekly close will be crucial to determine which side gains dominance.
---
#IOTA #IOTAUSDT #CryptoAnalysis #TechnicalAnalysis #Altcoin #CryptoTrading #SupportResistance #CryptoBullish #CryptoBearish #MarketStructure #PriceAction #SwingTrade
IOTA/USDT — the Crossroads: Major Breakout or Deeper Breakdown?
📌 Overview
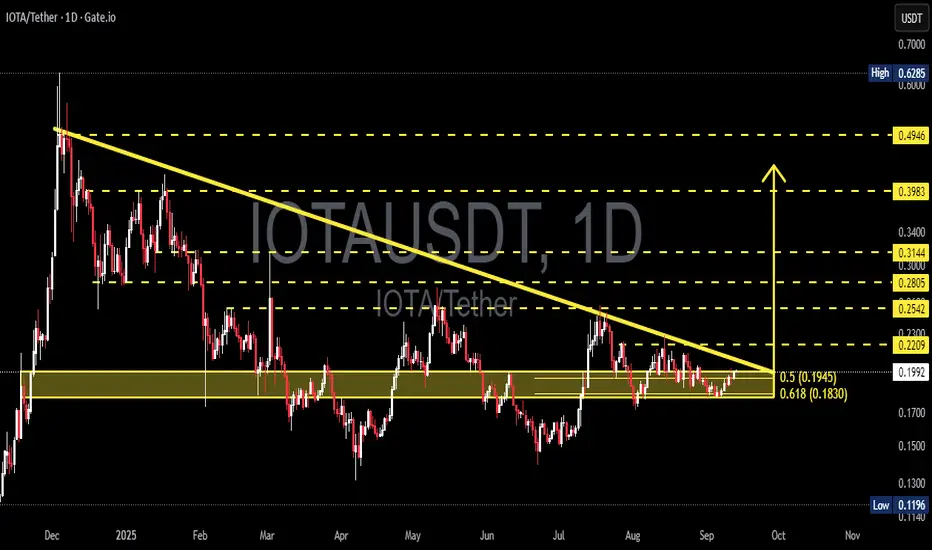
The daily chart of IOTA is reaching a critical decision point. After months of being pressured by a long-term descending trendline, the price still manages to hold above the demand zone at 0.183 – 0.195 USDT (a confluence of the 0.618 & 0.5 Fibonacci retracements).
This structure has formed a descending triangle / falling wedge, which tells us:
Buyers are consistently defending the demand zone.
Sellers are pushing with lower highs, squeezing the price tighter and tighter.
This creates a classic “make or break” setup — either IOTA breaks out with momentum or breaks down into lower levels.
---
📊 Technical Structure & Pattern
Main Pattern: Descending triangle / falling wedge.
Dynamic Resistance: Downtrend line (~0.22–0.225).
Key Support / Demand Zone: 0.183 – 0.195 USDT (Fibo 0.618 & 0.5).
Upside Targets if Breakout: 0.254 → 0.280 → 0.314 → 0.398 → 0.495.
Downside Targets if Breakdown: 0.15 → 0.13 → 0.1196 (historical low).
---
🚀 Bullish Scenario
1. Confirmation: Daily close above 0.22–0.225 (trendline breakout).
2. Why it matters: A breakout would signal the end of the multi-month downtrend and attract new buying momentum.
3. Targets:
First target: 0.2542 USDT.
Next zones: 0.2805 – 0.3144.
Strong breakout momentum could extend toward 0.398 – 0.495.
4. Stop-loss: Below 0.183 support cluster.
Bullish narrative: If buyers manage to break the descending wall, IOTA could enter a new trend reversal phase, pulling fresh interest from sidelined investors.
---
📉 Bearish Scenario
1. Confirmation: Daily close below 0.183 with strong volume.
2. Why it matters: This would signal that demand has collapsed, giving sellers full control.
3. Targets:
First target: 0.15 – 0.13 USDT.
Extended target: 0.1196 USDT (historical low).
4. Stop-loss: Above 0.195–0.22 depending on entry.
Bearish narrative: A breakdown here could trigger a capitulation phase, sending IOTA into deeper lows before a new base is found.
---
🔑 Why This Chart is Important
Confluence Zone: Trendline resistance + Fibonacci retracement + demand zone converge at the same area.
High Probability Setup: Either direction, the move is likely to be strong.
Clear Risk/Reward: Levels are well defined, giving traders precise setups.
Daily Close + Volume = Key: No confirmation means high risk of false breakouts.
---
📌 Conclusion
IOTA is at a technical crossroads:
Bullish case: Breakout >0.22 could lead to 0.254 → 0.314+.
Bearish case: Breakdown <0.183 could lead to 0.15 → 0.1196.
👉 Traders should wait for daily close confirmation with volume before committing to big positions.
👉 Investors should watch closely — this zone will determine whether IOTA starts a reversal or extends its downtrend.
---
#IOTA #IOTAUSDT #Crypto #TechnicalAnalysis #ChartAnalysis #PriceAction #Breakout #SupportResistance #Fibonacci #CryptoTrading #Altcoins
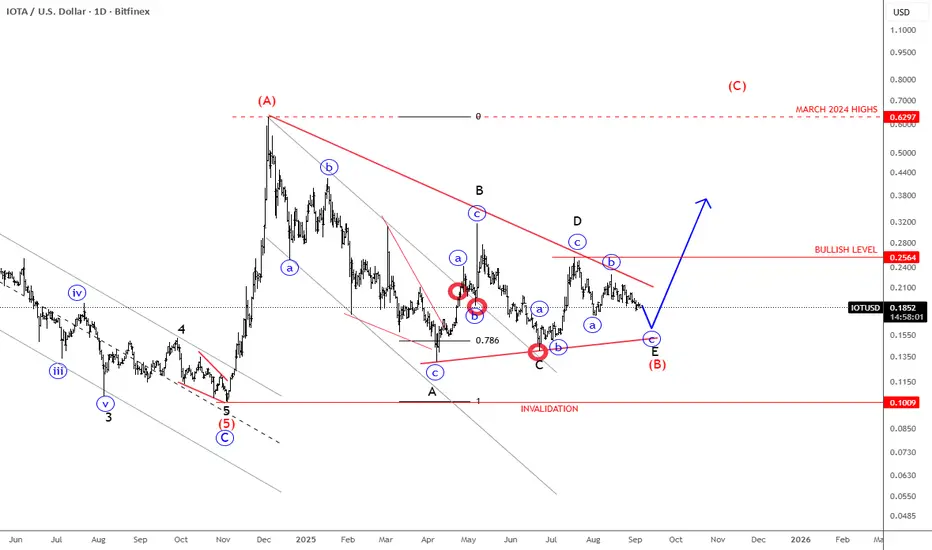
IOTA Finishing A Bullish Triangle?IOTA can be finishing a bullish triangle pattern that can send the price higher from technical point of view and by Elliott wave theory.
Cryptocurrency IOTA with ticker IOTUSD remains in sideways consolidation, and it more and more looks like a bullish ABCDE triangle pattern in wave (B) that can be coming to an end soon. We are actually tracking final subwave “c” of E of (B), so soon watch out for a strong bullish breakout into wave (C), which can send the price back to March 2024 highs. Keep in mind that bullish confirmation is only above upper triangle line and 0.25 level.
IOTA is a cryptocurrency designed for the Internet of Things (IoT). Unlike traditional blockchains, it uses a unique technology called the Tangle—a directed acyclic graph (DAG) that allows transactions to be feeless, scalable, and lightweight. This makes it well-suited for machine-to-machine payments, microtransactions, and secure data transfer. IOTA’s goal is to be the backbone of a machine economy, enabling devices to transact and share data autonomously.
IOTA Market Update📉 FWB:IOTA Market Update
FWB:IOTA has broken the blue support level 🔵❌
This signals further downside risk, with price potentially moving toward the green support zone 🟢
The potential play:
🔹 If price reaches the green support zone, watch closely — this is where buyers previously accumulated strongly.
🔹 A bounce from this level could offer a potential long entry opportunity with confirmation.
⚠️ Patience is key — let the setup confirm before entering.

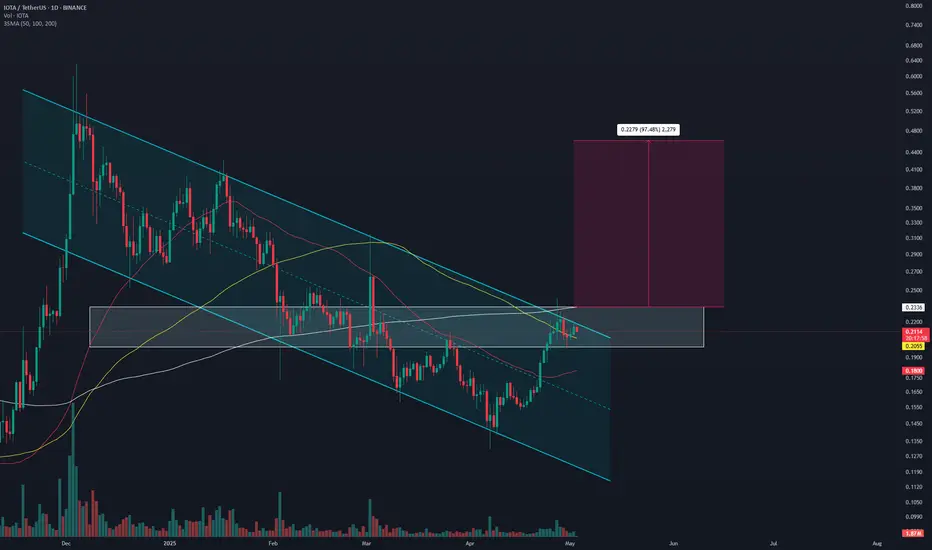
IOTA/USDT – Major Breakout from Long-Term Downtrend!📊 Chart Overview
After spending several months under pressure within a long-term descending trendline since December 2024, IOTA has finally shown a highly promising technical signal. The recent breakout didn’t just pierce the trendline — it was confirmed by a successful retest of the golden Fibonacci zone, a classic reversal trigger in technical analysis.
> This is a classic early sign of a potential trend reversal, often followed by strong momentum plays.
---
🧠 Structure & Pattern: Signs of a Macro Reversal
✅ Descending Trendline Breakout
Price has broken through a major downtrend line that had held for over 7 months, signaling a shift in market dynamics from sellers to buyers.
✅ Fibonacci Golden Pocket Retest (0.5–0.618)
The pullback landed perfectly at the golden pocket (0.2054–0.1931), a highly watched confluence area for reversals. Price bounced right from this support, showing buy-side strength.
✅ Demand Zone Activation
The yellow box highlights a previous accumulation zone that now acts as strong demand, reinforcing the potential for an upward continuation.
---
🟢 Bullish Scenario (Structured Upside Potential)
If the price holds above 0.2054:
Short-Term Targets:
📈 0.2542 → Minor resistance & previous breakout area
📈 0.2805 → Key psychological zone and past rejection area
Mid–Long-Term Targets:
💰 0.3144 → Historical resistance
💰 0.3983 → Fibonacci extension zone
💰 0.4946 → Final major resistance before the previous macro downtrend
Confirmation:
A daily candle close above 0.2542 with increasing volume would strongly validate the bullish continuation.
---
🔴 Bearish Scenario (Potential Fakeout Risk)
If the price fails to hold above the 0.1931 zone:
⚠️ It may turn into a fake breakout, indicating that buyers weren’t strong enough to sustain the breakout.
Downside targets to watch:
🧱 0.1700 → Minor psychological support
🧱 0.1308 → Previous macro low and critical support
---
🎯 Conclusion & Trading Strategy
IOTA is currently at a critical decision point, balancing between a confirmed macro reversal and a possible fakeout. However, the technical breakout above a long-standing trendline — combined with a retest of the golden pocket zone — puts bulls in a favorable position for a potential rally.
🔍 What to watch next:
Price action above 0.2200–0.2540
Volume confirmation on breakout levels
This setup is ideal for early trend traders, swing traders, or position traders looking to ride a larger bullish wave with well-defined risk.
#IOTAUSDT #CryptoBreakout #MacroReversal #FibonacciSupport #BullishSetup #AltcoinAnalysis #CryptoTechnicalAnalysis #TrendlineBreak #BuyTheDip

#IOTA/USDT T looking good to buy #IOTA
The price is moving within a descending channel on the 1-hour frame and is expected to break and continue upward.
We have a trend to stabilize above the 100 moving average once again.
We have a downtrend on the RSI indicator that supports the upward break.
We have a support area at the lower boundary of the channel at 0.1847, acting as strong support from which the price can rebound.
We have a major support area in green that pushed the price upward at 0.1880.
Entry price: 0.2054
First target: 0.2119
Second target: 0.2244
Third target: 0.2376
To manage risk, don't forget stop loss and capital management.
When you reach the first target, save some profits and then change the stop order to an entry order.
For inquiries, please comment.
Thank you.

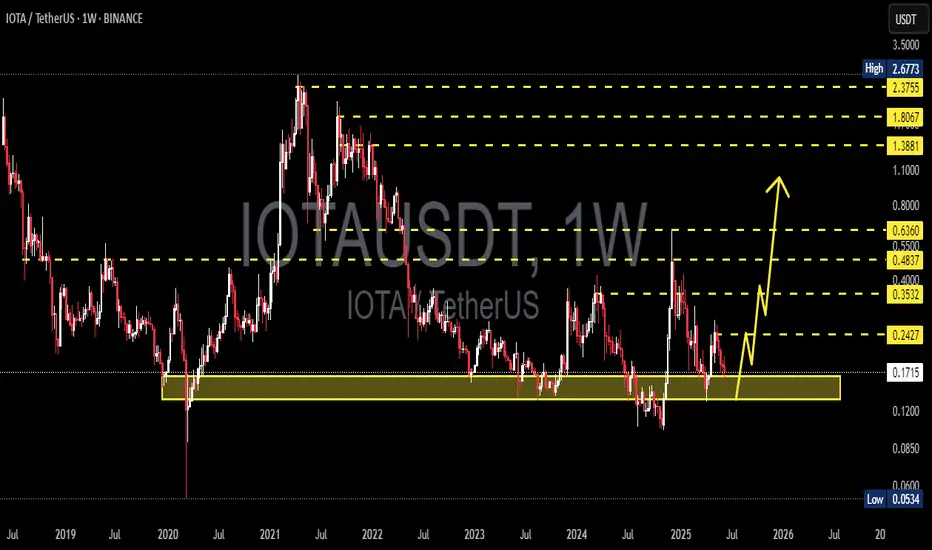
IOTA/USDT Weekly Analysis – Critical Support Retest
📊 Pattern & Price Structure:
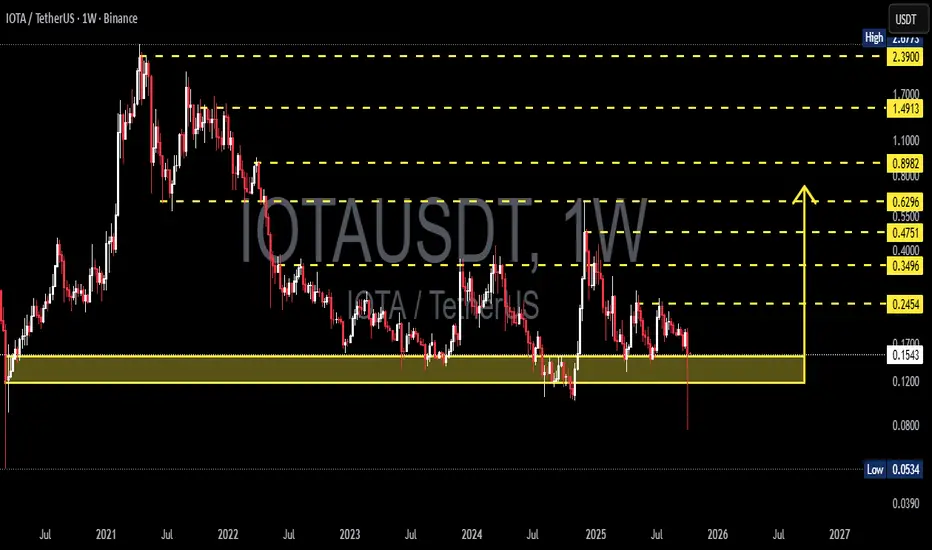
The chart indicates that IOTA is currently retesting a major historical demand zone in the range of $0.110 – $0.160, which has served as a strong support since 2020. The price has bounced off this area multiple times in the past, reinforcing it as a solid accumulation zone.
There is also a potential formation of a double bottom or accumulation range around this level, which often acts as the foundation for a major reversal if accompanied by volume and momentum.
🟢 Bullish Scenario:
If this support holds and buyers show strength:
1. The price could rebound and test key resistance levels:
$0.2454 (initial resistance)
$0.3496
$0.4000
$0.4751
2. A breakout beyond those levels may trigger further upside targets at:
$0.8982 (weekly key resistance)
$1.4913
$2.000
$2.390 and potentially even $2.677
3. Bullish catalysts such as positive fundamental news, rising market sentiment, or visible accumulation volume could spark an explosive move.
🔴 Bearish Scenario:
If the price fails to hold the $0.110 – $0.160 support zone:
1. A breakdown could lead to a decline toward previous extreme lows around:
$0.0700 – $0.0534
2. This would signal a loss of long-term buyer interest and open the door to deeper bearish continuation.
⚠️ Technical Conclusion:
The yellow zone is a make-or-break level — bulls must defend this to maintain any bullish structure.
As long as IOTA stays above $0.110, the risk-reward favors a bullish reversal.
A confirmed bullish weekly candle and volume spike would strengthen the bullish outlook.
📌 Key Levels:
Major Support Zone: $0.110 – $0.160
Resistance Levels to Watch:
$0.2454 → $0.3496 → $0.4000 → $0.4751 → $0.8982 → $1.4913 → $2.000 → $2.390 → $2.677
#IOTA #IOTAUSDT #CryptoAnalysis #AltcoinBreakout #TechnicalAnalysis #BullishReversal #CryptoSetup #SupportAndResistance

IOTA Is Showing a Dangerous Pattern! Don't Ignore This SignalYello, Paradisers! Are you watching what’s forming beneath the surface of #IOTA’s slow drift? While the market sleeps on this coin, a dangerous structure is developing, and if this key support breaks, we could see a fast and painful selloff few are prepared for.
💎After months of low momentum, IOTA is now beginning to show signs of a head and shoulders pattern, a classic bearish reversal formation. This is a structure which cant be ignored, especially not at this stage of the market.
💎#IOTAUSDT neckline support lies between $0.1600 and $0.1500, a range that bulls have barely managed to defend over the past several weeks. If this zone breaks, the confirmation will be triggered and sellers will likely dominate, pushing price lower in a decisive move.
💎The first downside target sits at $0.1350, where moderate support exists. However, this level may not be strong enough to absorb selling pressure if the market sentiment remains weak.
💎If sellers manage to breach $0.1350, expect an accelerated move toward $0.1130–$0.1030. This deeper zone represents major structural support, where a stronger bullish reaction could finally take place.
Paradisers, strive for consistency, not quick profits. Treat the market as a businessman, not as a gambler.
MyCryptoParadise
iFeel the success🌴

IOTAUSDT 1W AnalysisIOTA ~ 1W Analysis
#IOTA Buy back gradually from here if you still have confidence in this coin with a short term target of at least 20%+ from here.
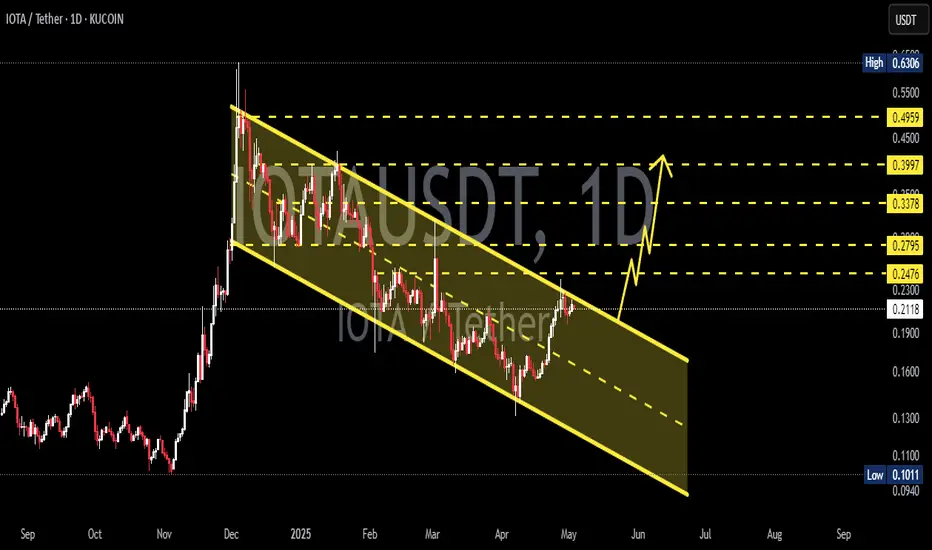
IOTAUSD Channel Up eyes +45% bullish leg.IOTAUSD is trading inside a Channel Up, which is the bullish pattern that took it above its 5 month Falling Resistance, essentially the trade war correction.
The 1day MA50 is providing support and the 1day MA200 is already broken, which signals bullish extension.
The Channel's previous bullish leg recorded +45%, so go long and target 0.31000.
Follow us, like the idea and leave a comment below!!

TradeCityPro | IOTA: Testing Key Resistance in RWA-DePIN Rally👋 Welcome to TradeCity Pro!
In this analysis, I’m going to review the IOTA coin for you. This project is one of the RWA and DePIN-based initiatives and is among the older projects in this category.
✔️ The coin has a market cap of $822 million and ranks 85th on CoinMarketCap.
📅 Daily Timeframe
As you can see on the daily timeframe, after finding support at 0.1547, the price initiated a bullish leg and moved up to the resistance zone I’ve marked.
💥 This area is a very significant resistance zone, and in this bullish leg, the price has reached it for the first time and got rejected.
🔍 In my view, as long as the price hasn’t confirmed a breakout above 0.1960, the chance of starting a downtrend is higher than continuing the current uptrend. If this resistance zone is broken, we can consider it strong confirmation of buyer strength.
📈 For a long position, we can enter on the breakout of this same zone. For spot buying, this trigger can also be used, but the main long-term triggers are 0.3774 and 0.4918.
⚡️ On the RSI oscillator, there's an important zone at the 50 level. If this level is broken, the probability of breaking 0.1960 increases. If that happens, the next support zone will be 0.1547.
📊 Make sure to pay close attention to volume. If any of our triggers are activated without volume confirmation, the likelihood of a fake breakout increases.
❌ Disclaimer ❌
Trading futures is highly risky and dangerous. If you're not an expert, these triggers may not be suitable for you. You should first learn risk and capital management. You can also use the educational content from this channel.
Finally, these triggers reflect my personal opinions on price action, and the market may move completely against this analysis. So, do your own research before opening any position.

IOTA Could Be On The Way Back To December 2024 HighsIOTA with ticker IOTUSD made sharp and impulsive rally at the end of 2024, which we see it as a first leg (A)(1) of a bigger recovery in minimum three waves (A)(1)-(B)(2)-(C)(3). Since the beginning of 2025, Crypto market slowed down and IOTA made a deep retracement, but in three legs ABC with an ending diagonal/wedge pattern into wave C, which indicates for a correction in wave (B)(2).
Well, it nicely bounced recently, making a clean five-wave impulse away from projected 78,6% Fibonacci support and back above channel resistance line, so it can be wave 1 of a new five-wave bullish cycle within higher degree wave (C) or (3). That said, after current pullback in wave 2, be aware of more gains for wave 3 of a five-wave bullish cycle that can send the price back to December 2024 highs this year.

IOTAUSDT Analysis D1IOTAUSDT Seems Like Ready For Strong Bullish Rally, Breakout And Retest Has Already Confirmed, Expecting 2x In Coming Days .
IOTAUSDT 1D AnalysisIOTA ~ 1D Analysis
#IOTA Buy after successfully penetrating this resistant line with a short -term target of at least 10%+ from here.
#IOTA/USDT#IOTA
The price is moving within a descending channel on the 1-hour frame, adhering well to it, and is on its way to breaking it strongly upwards and retesting it.
We are seeing a bounce from the lower boundary of the descending channel, which is support at 0.2125.
We have a downtrend on the RSI indicator that is about to break and retest, supporting the upward trend.
We are looking for stability above the 100 moving average.
Entry price: 0.2135
First target: 0.2261
Second target: 0.2364
Third target: 0.2483

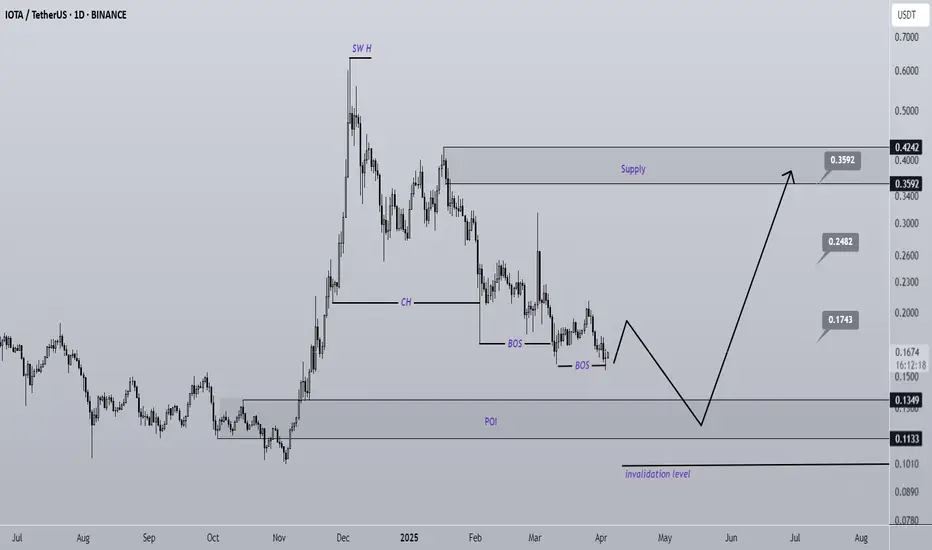
IOTA Analysis (1D)IOTA has a bullish structure on the higher timeframes. It is currently approaching a support zone through a time-based correction.
We are looking for buy/long positions around the POI (Point of Interest) zone.
Targets are marked on the chart.
A daily candle closing below the invalidation level will invalidate this analysis.
Do not enter the position without capital management and stop setting
Comment if you have any questions
thank you