IOTA
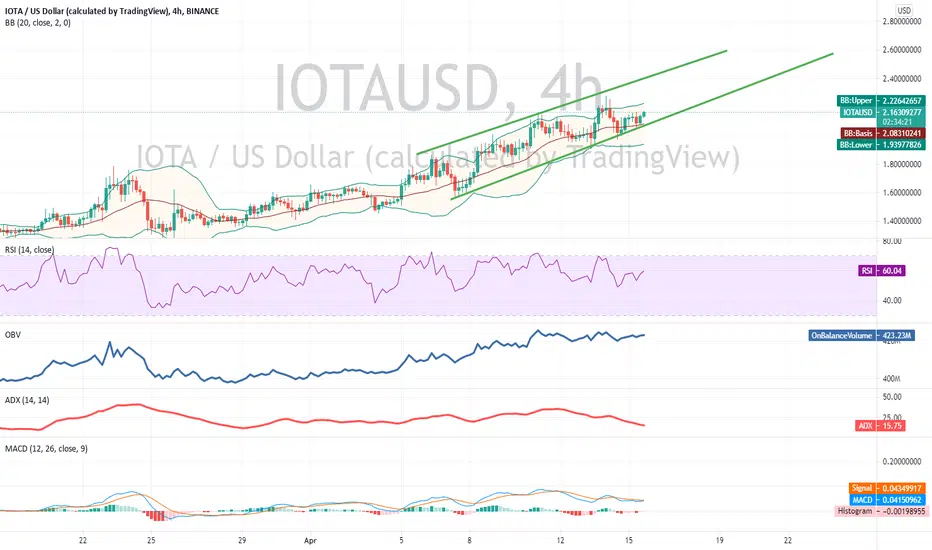
MIOTA Breaks Above $1.50 After Chrysalis UpgradeIOTA Price traded at $2.12 with a loss of 0.34% in the last 24-hour and 25.07% up in the weekly time-frame. Furthermore, IOTA bounced from the support of $1.50. In contrast, the market capitalization stands at $5 billion. Technically, investors can perceive a positive crossover in the EMA, and the price is sustaining above all the EMA. RSI index showcases an upward slope. Moreover, the price movement can be towards the resistance of $2.50 in future trading sessions.
Resistance: $2.50
Support: $1.85


👀🧐If one or 2 candle close above resistance ,after poolback on it u can buy it,i think with the news of update it have a good move ,lets see what happen🍻

IOTAUSDT [FUTURES] [30M] BREAKOUT OF MINI TREND 🔥🔥IOTAUSDT BREAKOUT OF MINI TREND 🔥🔥
NOW IOTA IS BREAKING OUT OF TRENDELINE LOOKING FOR UNTILL PULLDOWN HITTING OUTSIDE OLD TRENDLINE ZONE THAT IS LOKKING FOR BUY POSITION
Looking more forcast every week on my youtube find on my profile
GOODLUCK
TON TRADER
🔥🔥🔥🔥🔥🔥🙏🙏🙏🙏🙏🙏

IOTA 140 $ LONG TERMIs IOTA 140 dollar price target crazy to call ?
No , just by reading the chart it's easy what it did at the bottom; a 10 x and it will be more epic when it will be forming the U-form and do back a 10 x.
Do you think I am crazy or just realistic view ?
I would like to read your comments and to hear from you.
Peace


IOTAUSD WYCKOFF Analysis - Bullish - #IOTAA combination of Wyckoff Analysis and 'off-chart' Upcoming IOTA updates/upgrades/news
We noticed IOTA going through an Accumulation phase from August 2018 until February 2021 when it then exited to enter the 'Re-accumulation/Preliminary Supply (PSY)' phase.
There is still no sign that IOTA has reached Phase A of Distribution so this shows that IOTA still has alot of room to grow.
IOTA is also corralated with BTC and BTC is also Rising. You can check my Idea on BTC/USD here
SUMMARY:
1) According to the WYCKOFF Analysis IOTA exited the accumulation phase and is headed towards Phase A of the Distribution, which means it will grow rapidly from here
2) IOTA is corralated with BTC and BTC is also rising
3) There are many upcoming upgrades/updates on IOTA in the following weeks/months that will create hype and also assist in pushing the price up
Overall, I believe IOTA will grow massively in the coming weeks/months
Please let me know your comments, Ideas - any feedback will be appreciated
----------
Not a financial advise, this IDEA is only for educational purposes

IOTA - BIG breakdown is on the way!This resistance is huge. If IOTA can break this, it will go to the moon!

IOTA: Another movement coming soonPrice is accumulating between 1.1 and 1.7 for a while. In 3D timeframe we can see clear wedge pattern and also RSI is close to the support on uptrend line.
So all in all:
- Any daily close between $1.8- $1.9 will confirm that another strong bull run is around the corner
- There can be one last downward leg to $1.4 level before we see green candles on 3D timeframe. You can tell this with checking how price reacts when it touches to the upper - lower trend line inside the wedge.
When the price breaks $1.8-$1.9 zone, there is no reason to not hit $5 in a very short term.

IOTA La Pump de ChrysalisChrysalis is a big upcoming update happening on the 24th of April for IOTA. Likely, the price will push up because of the event and might dump after it goes live, but we'll see about that later.
The current formation is known as a leading diagonal, which is a short-term bearish pattern, with a longer-term bullish outlay. This means that price dips 5 - 30% first, before initiating wave 3 of the 5-wave cycle from Elliot waves.
The dip may have already happened or not, just don't set your stop loss too tight or you get left out (my stop loss is at 1.10).
Targets
1. the first target is the first resistance formed around 2018 when IOTA started a huge dump, which is around 2.75 USD. check the BFX chart for IOTUSD to see this data.
2. the second target is the 1.618 extension of the current leg, which is somewhere around 3.
3. the last target is the ATH that IOTA reached somewhere around 2018, which is around 6. Also, check this on Bitfinex data.
Good luck traders and please don't over-leverage like I just did.

IOTA (MIOTA) - April 8 Hello?
Dear traders, nice to meet you.
By "following" you can always get new information quickly.
Please also ask for the "Like" clock.
Have a nice day.
----------------------------------
You should watch for any movement that deviates from the 1.4942213-1.84039802 section.
In particular, it remains to be seen if it can gain support at 1.55251884 and climb along the uptrend line.
We have to see if we can get support by climbing to the 1.84039802-1.95578998 range.
If you fall from the 1.49422213 point, you need a short stop loss.
However, you need to trade carefully as you can touch the 1.29319710 point or the uptrend line and move up.
If it falls in the 1.03265428-1.14804624 interval, a Stop Loss is required to preserve profit and loss.
If the CCI line falls below 100 on the CCI-RC indicator, there may be volatility and you need to trade carefully.
It remains to be seen if the CCI line can break above the EMA line and continue the uptrend.
-------------------------------------
(IOTABTC 1D chart)
2889 Satoshi-3555 We must watch for any movement that deviates from the Satoshi section.
If it falls, we need to make sure we get support in the 2667 Satoshi-2889 Satoshi section.
If you fall at 2566 Satoshi, you need a short stop loss.
If it falls at 2222 Satoshi, Stop Loss is needed to preserve profit and loss.
-------------------------------------------------- -------------------------------------------
** All indicators are lagging indicators.
So, it's important to be aware that the indicator moves accordingly with the movement of price and volume.
Just for the sake of convenience, we are talking upside down for interpretation of the indicators.
** The wRSI_SR indicator is an indicator created by adding settings and options from the existing Stochastic RSI indicator.
Therefore, the interpretation is the same as the conventional stochastic RSI indicator. (K, D line -> R, S line)
** The OBV indicator was re-created by applying a formula to the DepthHouse Trading indicator, an indicator published by oh92. (Thank you for this.)
** Check support, resistance, and abbreviation points.
** Support or resistance is based on the closing price of the 1D chart.
** All explanations are for reference only and do not guarantee profit or loss on investment.
Explanation of abbreviations displayed on the chart
R: A point or section of resistance that requires a response to preserve profits
S-L: Stop Loss point or section
S: A point or segment that can be bought for profit generation as a support point or segment
(Short-term Stop Loss can be said to be a point where profits and losses can be preserved or additionally entered through installment transactions. It is a short-term investment perspective.)
GAP refers to the difference in prices that occurred when the stock market, CME, and BAKKT exchanges were closed because they are not trading 24 hours a day.
G1: Closing price when closed
G2: Cigar at the time of opening
(Example) Gap (G1-G2)


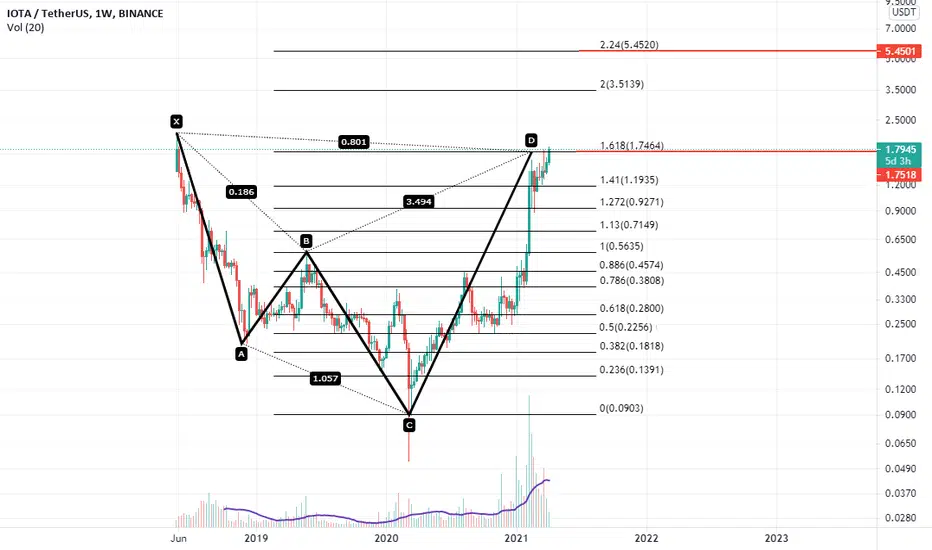
Can it go up to 2.24 level of Fibo or is 1.6 enough?shark harmonic pattern:
AB=0.38 XA
BC=1.6 AB
CD=1.6 BC
or
CD=2.24 BC

I oughta row, row, row IOTA here.... Break through... PLEASEMaybe the latest news will spurn some life into this floating boat and push us out of this boring little boat we are trending in. There is a small MACD confluence accompanied by a minor uptick in volume and a stochastic uptrend. Does that mean I can jump ship or ride her to paradise island. Look for a little pop... just a wee bit more confirmation and maybe she's heading on up to the EAST side. Probably to join a street gang.
Here's a quote from IOTA about nine hours ago.
#IOTAQuicktakes - Let's start the week with the latest #IOTA news? The IOTA #token officially on #BinanceSmartChain, the new #Pollen upgrade with #mana being used by #FPC #autopeering, the IOTA #CaWEndar and more. youtu.be

💎 IOTA To the 🌙 ?hi guys !
IOTA will have a good future and back to market again .
one week moving averages shows 14 buy and zero sell !
🚨🚨 its not a financial advice and go with your own risk !! 🚨🚨
don't miss this great opportunity .
share your ideas in the comment

Still trending stronglyDespite the last correction, price is still trending solidly upward. Still expecting a nice pump to 2$

IOTA: Ascending Triangles everywhere! – 1HAnother Ascending triangje, this time on the 1H. Target $1.75

IOTA: A new Dawn - I'm calling it!What do you think guys, am I too bullishin this idea? Anyhow soon (TM) we will see!
For outsiders, check out IOTA's biggest update so far: blog.iota.org

IOTA Next Moves (Long term)If we broke the red resistance area, most likely will see the 2017 bull run moves playing out

IOTA can be one of best altcoins during this bullrun. BIG PROFITIOTA is very very good project. This coin have solid foundations. This coin is on our golden list of altcoins and it will give use huge profit in this bullrun. Holders will be rewarded.
If you want to know our golden list of altcoins for this bullrun and play with us on short term signals feel free to join us on our website!
