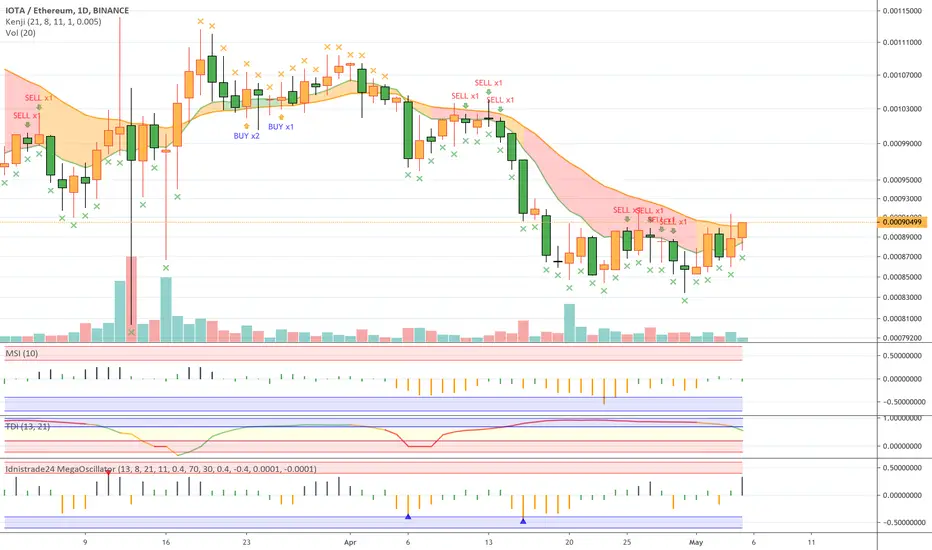
IOTA on life supportCan't breath on it's own, put on a fed bailout respirator,regardless the patient's prognosis is dire: Bear flagging into major support now turned resistance and accumulating bearish divergences. Classic stairway up elevator down. By January 2021, IOTA will be delisted.
I have extremely neutral view on iota and don't hold any position, I just read what the chart is telling me and this is one of the worst Alts chart.
IOTA

IOTA/USD - the upward channelIt's moving in the channel.
Now we're standing in the middle of the channel.
We're also standing at $0.20.
I'm gonna try the log to the upper edge of the channel.
Cancel long position: breakout of the zone 0.20$.
Push ❤️ if you think this is a useful idea!
Before to trade my ideas make your own analysis.
Thanks for your support!

Afunilamento iota pre AltsseasonDepois de muito tempo criando pequenas ondas descendentes o ativo começou a afunilar e lateralizou, isso aconteceu com a maioria das altcoins antes dos pullbacks de 2017, melhor hora para holdar o ativo , a relação de tempo necessária pode variar dependendo de quanto tempo leve a acumulação.( apesar do alto risco então tenha noção )
Entradas: ( de preferencia fracionadas )
2000
1850
1600
Alvos formação de elliot:
8.400
17.000
22.500

Iota long position - updateMonitoring closely Iota, still holding our position
Entry = 0.1770
TP = 0.2295
SL = 0.1505

Cup and handle pattern1 hour chart is forming a cup and handle.
Will we have an upward movement soon?
Cheers.

IOTA/USD is about to pumpIOTA/USD volume exhausted. Need less buy pressure to push price higher.
IOTA price increase faster than other coin in the last 24H.
It will move up soon.

IOTA DOLLAR - STRONG 50% GAINS ON THE DAILYDAILY CROSS
ROOM TO GROW 50% TO TREND LINE
TRADE ACTIVE BITFINEX:IOTUSD

A sign!--- Please if you find this informative and/or agree with the idea don't forget to give a like. Thank you! ---
This is an update from my previous idea, plz here you can find attached.
It is an important event in nature as it is the intersection with the MA200.
We don't know for sure the outcome of this action, although at least we expect some interesting movement here. Nice, isn't it?
From a 4h view we've been above the moving average for few hours already, but jut starting.
How far do you see Iota performing this summer? Please feel free to leave any comment.
Thanks again!

IOTA Bullish SignsHey Guys:
BINANCE:IOTAUSD is our next coin of discussion. I'm a big fan of their work.
Not only am I a big fan of their work, but I'm also a big fan of their W and 1D charts. Most of my ideas will be with a long-term mindset.
Please remember that these are just my opinions. I'm always open to discussion on the ideas and what I'm talking about.
Entry Point:
I'm slowly accumulating more and I'll be keeping that strategy. Just looking for good opportunities.
I think we're safe to buy until the ~$.80 b/c it'll face some resistance at $1.
I make this statement with two assumptions:
that the resistance faced September of 2018, which is marked with the red arrow, will not be an issue for us, and
The breakthrough of the 1 Fib level on the 1D chart will give us some challenges but we'll eventually overtake it.
If it can cleanly pass the $1 - $1.10, we're safe until around $1.35 - $1.40. It'll face some resistance at the 0.236 Fib level. Then we can just rinse and repeat those steps for each Fib ( How to use the Trend-Based Fib Extension ). I'll be updating the comments as this unfolds. It should be fun.
Target Points:
(1) 1.7
(2) 2.67
(3) 3.44
(4) 4.20 (nice)
(5) 5.28
Stop-Loss:
We'll have to wait to see if $0.20 can hold. If not, we'll turn this into a selling game.
Indicators:
Weekly
FIbonacci
The Trend-Based Fib Extension is used to guage potential support/resistance levels after we've gone through a correction of the previous trend. This is where the Price Points are taken from.
Moving Averages
Our 50-MA (blue) has had enough data to take its trend into consideration when making a purchase order. It's starting to smooth out its downtrend which could indicate a change of direction. We'll have to watch as this develops.
If the 20-EMA (orange) can hold above the 50-MA for a bit, we'd be in a good spot.
Sniper T3-CCI
Waiting for this to move above the line could be the conservative play here.
Volume
The sell volume seems to be getting smaller. Let's look for a spike one of these weeks to indicate some direction.
Candlesticks
I like using the Heikin Ashi candle to gauge trends.
Summary
There's a bunch of information here. But the most important thing is that we're thinking long-term. Well into and past next year. We'll update price points as this unfolds but for now, we're looking to lock in some profits between now and the ~$1.4 mark.
Good Luck!
-Matt

IOTA - Minimal View (Breaking the triangle)Another educational chart. Just an image,
an instant of time captured in a chart..
Could be beautiful, isn't it?
What are your thoughts? Is it going to break it or not?
You know the rules.
Thanks!

JSW - 10X, LONG TERM VIEWFurther updates upon more significant development. For now instrument on a watch list.

Trend direction for now clear. #long #iotaWe're out of the triangle - tested, confirmed. Let's see if this continues to go up - a little bit of uncertainty in this area can cause volatility what in turn might push this one significantly above 200EMA.
Long.

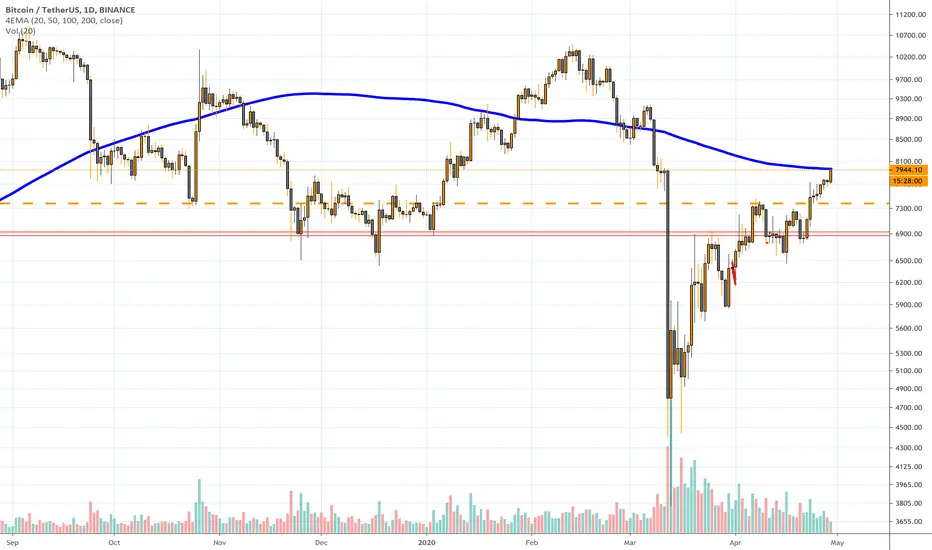
First attempt to break 200 Daily EMA since March - ShortWith halving in mind, I'm a little bearish at the moment and aiming to say that top is here...

IOTA's Stairway to HeavenIota like a little chad broke out from its bullish pennant and is now travelling towards the moon in this ascending channel. I am not trading this but it will be a fun watch. Iota never stays too far behind XRP and I guess now is the time to make some gains before BTC decides what it wants.

IOTA simple Long trade set upIOTA is done through the accumulation period and probably is going for a spring and breakout. Watchout all the alts aswell. Its happening all over.

IOTA / BITCOIN (IOTABTC) WeeklyDates in the future with the greatest probability for a price high or price low.
The Djinn Predictive Indicators are simple mathematical equations. Once an equation is given to Siri the algorithm provides the future price swing date. Djinn Indicators work on all charts, for any asset category and in all time frames. Occasionally a Djinn Predictive Indicator will miss its prediction date by one candlestick. If multiple Djinn prediction dates are missed and are plowed through by same color Henikin Ashi candles the asset is being "reset". The "reset" is complete when Henikin Ashi candles are back in sync with Djinn price high or low prediction dates.
One way the Djinn Indicator is used to enter and exit trades:
For best results trade in the direction of the trend.
The Linear Regression channel is used to determine trend direction. The Linear Regression is set at 2 -2 30.
When a green Henikin Ashi candle intersects with the linear regression upper deviation line (green line) and both indicators intersect with a Djinn prediction date a sell is triggered.
When a red Henikin Ashi candle intersects with the linear regression lower deviation line (red line) and both indicators intersect with a Djinn prediction date a buy is triggered.
This trading strategy works on daily, weekly and Monthly Djinn Predictive charts.
This is not trading advice. Trade at your own risk.

IOTAUSD_SHORTfriends All indicators are against IOTA _short
if you like my signals please support me by fallowing like and comments. thank you


Decay coinsSome speculative theory regarding the decaying nature of major altcoins, It can be seen that in the outer 1.618 fib ring in the ealy days of IOTA decay was present before lift off. Is this happening on a larger scale? Two pumps to .5 fibonacci retracement level support this theory that the next fib transition will produce a bullish outcome.

iOTA/BTC - intention to break intention to break the level of 0.00002387 on the daily typhoon
candlestick analysis shows a great pin bar to buy.
There may be one more rollback from the level, and only after the breakdown.
It will be more reliable to buy after the break-down and fixation.
Dear followers, the best "Thank you" will be your likes and comments!

