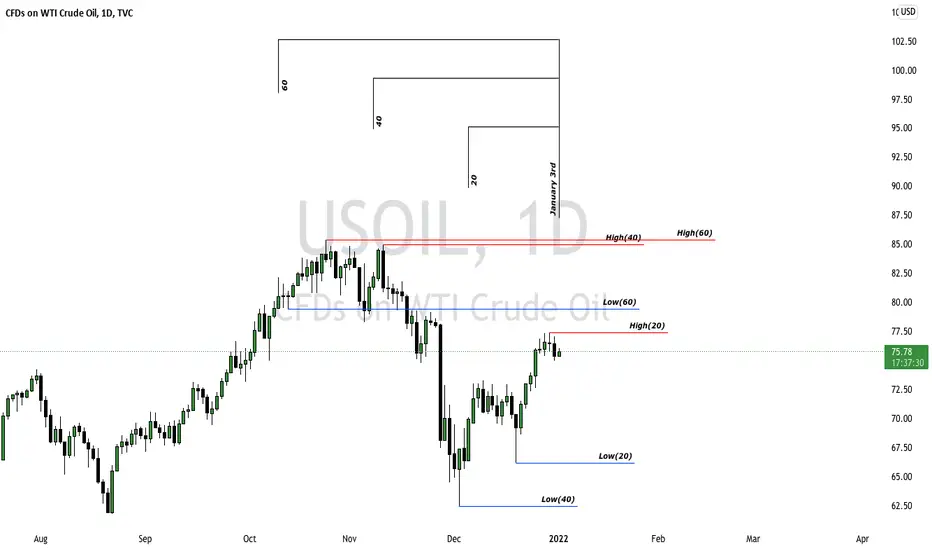
IPDA Data Range February Update Hello Traders!
Here I look at the my IPDA Chart.
As you can see there are many ways to utilize the ranges IPDA provides.
There is much more context on my chart and those highs and lows can present trading opportunities.
Like the GU trade around the old 60 day high.
Below I linked the original IPDA Markups for DXY, UJ and GU
Safe Trading
-D'onte
Ipda

USD/JPY February IPDA DATA RANGES I.P.D.A Look Back Data Ranges
What does I.P.D.A mean?
Interbank Price Delivery Algorithm is what I.P.D.A stands for.
Who uses I.P.D.A?
I.P.D.A is used by central bank traders because it is how the market is programmed.
When should a trader use I.P.D.A?
It should be used on the first trading day of every month.
Where should a trader use I.P.D.A look back data ranges?
Traders should be using it on the Daily Time frame (1 candle = 1 trading day)
Why should a trader be using I.P.D.A?
IPDA gives a better reference point as to where the markets might reach throughout the new trading month.
Rules
Look back 20, 40, and 60 days on the first trading day of the month (do not include weekends when counting back).
Mark out the highest high and lowest for within 20 day look back period (Find the 20, 40, and 60 Highs; Find the 20, 40, 60 day Lows)
Find the highest high and lowest low within the last 60 days and cut that range in half.
Locate all obvious premium and discount arrays within the respected trading range you cut in half.
Main idea of the concept:
The markets will make a quarterly shift every 3, 4, or 6 months. This sets traders up to anticipate if we get a higher time frame market structure shift. Finding these highs and lows and PD arrays allow us to have more trading context without any indicators.
Disclosure:
I.P.D.A look back data ranges alone does not tell you where to buy and sell. There needs to be a blend of concepts, mainly time and price.

XAU/USD February IPDA DATA RANGES I.P.D.A Look Back Data Ranges
What does I.P.D.A mean?
Interbank Price Delivery Algorithm is what I.P.D.A stands for.
Who uses I.P.D.A?
I.P.D.A is used by central bank traders because it is how the market is programmed.
When should a trader use I.P.D.A?
It should be used on the first trading day of every month.
Where should a trader use I.P.D.A look back data ranges?
Traders should be using it on the Daily Time frame (1 candle = 1 trading day)
Why should a trader be using I.P.D.A?
IPDA gives a better reference point as to where the markets might reach throughout the new trading month.
Rules
Look back 20, 40, and 60 days on the first trading day of the month (do not include weekends when counting back).
Mark out the highest high and lowest for within 20 day look back period (Find the 20, 40, and 60 Highs; Find the 20, 40, 60 day Lows)
Find the highest high and lowest low within the last 60 days and cut that range in half.
Locate all obvious premium and discount arrays within the respected trading range you cut in half.
Main idea of the concept:
The markets will make a quarterly shift every 3, 4, or 6 months. This sets traders up to anticipate if we get a higher time frame market structure shift. Finding these highs and lows and PD arrays allow us to have more trading context without any indicators.
Disclosure:
I.P.D.A look back data ranges alone does not tell you where to buy and sell. There needs to be a blend of concepts, mainly time and price.

NZD/USD February IPDA DATA RANGES I.P.D.A Look Back Data Ranges
What does I.P.D.A mean?
Interbank Price Delivery Algorithm is what I.P.D.A stands for.
Who uses I.P.D.A?
I.P.D.A is used by central bank traders because it is how the market is programmed.
When should a trader use I.P.D.A?
It should be used on the first trading day of every month.
Where should a trader use I.P.D.A look back data ranges?
Traders should be using it on the Daily Time frame (1 candle = 1 trading day)
Why should a trader be using I.P.D.A?
IPDA gives a better reference point as to where the markets might reach throughout the new trading month.
Rules
Look back 20, 40, and 60 days on the first trading day of the month (do not include weekends when counting back).
Mark out the highest high and lowest for within 20 day look back period (Find the 20, 40, and 60 Highs; Find the 20, 40, 60 day Lows)
Find the highest high and lowest low within the last 60 days and cut that range in half.
Locate all obvious premium and discount arrays within the respected trading range you cut in half.
Main idea of the concept:
The markets will make a quarterly shift every 3, 4, or 6 months. This sets traders up to anticipate if we get a higher time frame market structure shift. Finding these highs and lows and PD arrays allow us to have more trading context without any indicators.
Disclosure:
I.P.D.A look back data ranges alone does not tell you where to buy and sell. There needs to be a blend of concepts, mainly time and price.

GBP/USD February IPDA DATA RANGES I.P.D.A Look Back Data Ranges
What does I.P.D.A mean?
Interbank Price Delivery Algorithm is what I.P.D.A stands for.
Who uses I.P.D.A?
I.P.D.A is used by central bank traders because it is how the market is programmed.
When should a trader use I.P.D.A?
It should be used on the first trading day of every month.
Where should a trader use I.P.D.A look back data ranges?
Traders should be using it on the Daily Time frame (1 candle = 1 trading day)
Why should a trader be using I.P.D.A?
IPDA gives a better reference point as to where the markets might reach throughout the new trading month.
Rules
Look back 20, 40, and 60 days on the first trading day of the month (do not include weekends when counting back).
Mark out the highest high and lowest for within 20 day look back period (Find the 20, 40, and 60 Highs; Find the 20, 40, 60 day Lows)
Find the highest high and lowest low within the last 60 days and cut that range in half.
Locate all obvious premium and discount arrays within the respected trading range you cut in half.
Main idea of the concept:
The markets will make a quarterly shift every 3, 4, or 6 months. This sets traders up to anticipate if we get a higher time frame market structure shift. Finding these highs and lows and PD arrays allow us to have more trading context without any indicators.
Disclosure:
I.P.D.A look back data ranges alone does not tell you where to buy and sell. There needs to be a blend of concepts, mainly time and price.

DXY February IPDA DATA RANGES Hello Traders!
I.P.D.A Look Back Data Ranges
What does I.P.D.A mean?
Interbank Price Delivery Algorithm is what I.P.D.A stands for.
Who uses I.P.D.A?
I.P.D.A is used by central bank traders because it is how the market is programmed.
When should a trader use I.P.D.A?
It should be used on the first trading day of every month.
Where should a trader use I.P.D.A look back data ranges?
Traders should be using it on the Daily Time frame (1 candle = 1 trading day)
Why should a trader be using I.P.D.A?
IPDA gives a better reference point as to where the markets might reach throughout the new trading month.
Rules
Look back 20, 40, and 60 days on the first trading day of the month (do not include weekends when counting back).
Mark out the highest high and lowest for within 20 day look back period (Find the 20, 40, and 60 Highs; Find the 20, 40, 60 day Lows)
Find the highest high and lowest low within the last 60 days and cut that range in half.
Locate all obvious premium and discount arrays within the respected trading range you cut in half.
Main idea of the concept:
The markets will make a quarterly shift every 3, 4, or 6 months. This sets traders up to anticipate if we get a higher time frame market structure shift. Finding these highs and lows and PD arrays allow us to have more trading context without any indicators.
Disclosure:
I.P.D.A look back data ranges alone does not tell you where to buy and sell. There needs to be a blend of concepts, mainly time and price.

NZD/USD IPDA February IPDA PrepHello Traders!
This is our NZD/USD February Ipda look back data ranges.
Do understand you are not looking to force trades in unprobable areas.
We are building a outline to see how we should move around these levels.

GBP/USD Feb IPDAHeres the Feburary IPDA for GBP/USD
20 day is January 4th
40 day is December 7th
60 day is November 9th

GBP/USD IPDA Prep for Feb 1st.Hello Traders!
Here is our IPDA Data Ranges,
I apologize I had an emergency to take care of.
I will make a finish a PT 2. tho this video.

IPDA on CryptoFirst off I want to state that I'm an ICT YouTube Student and have studied at least a quarter of his videos and am now keeping up and studying his new 2022 Mentorship as well. I'm not going to sit here and pretend to be some know it all professional because I'm not. But I do have a clearer understanding to the market now than I ever have before and can not trade anything with a retail mindset anymore. With that said if you don"t agree with Smart Money Concepts or the Interbank Price Delivery Algorithm please keep your comments to yourself. Now this is my Analysis thus far using the knowledge I have shuffled through over and over till I finally found stability in Cryptocurrency. Enjoy!

DXY IPDA Prep for Feb 1st.Hello Traders!
Here is a full walk through on me using IPDA.
As you can see there are much more things you things to consider when trading.
This is how I go about marking all other pairs each first of the month.

Descending widening wedge for ETH? I think YESLearned about IPDA recently and I think it's pretty interesting and makes a lot of sense. Interbank price delivery algorithm is what it stands for and it's not my idea but someone recommended it to me and I did my research. It only further confirms what I already suspected, we've entered an accumulation zone and the fear and manipulation is real lol. Don't let them get your bags and or wait for confirmation if you're more risk adverse
Not financial advice, just what I believe is going on


Additional IDPA TeachingHello Traders!
This is how I go about trading the monthly swing.
I use those websites to give me my macro analysis.
Indicators lie but macro numbers tell the truth.
Main Idea:
seasonality
Interest rate differentials
Ipda

XAU/USD IPDA Data ranges December Hello Traders!
Here was a quick break down on gold currently.
Someone had asked me to do a video on it, so here you go.

EURJPY Bullish swingEURJPY has been in a bearish correction as we can see on the WEEKLY time frame, breaking the the previous LL, where liquidity was located.
Price is close getting closer to our POI (Point of Interest) 126.300 where is the bullish institutional candle that concord with the weekly HL support zone.
If the bullish rally take place I would look to take Profit on TP1_136.700 or TP2_132.00
