AAPL Short: Wave 1=Wave 5Well, based on my EW counts and Fibonacci extension, we have reached the target of the move up and it's time for it to go down.
Also note that the new high is NOT accompanied by an equivalent RSI(7) high. A divergence.
Also, this is all-time high. You need any reason for a better risk reward?
Iphone

APPLE This rally isn't done yetApple (AAPL) is on an enormous +12.5% rally since the October 26 bottom on the 1W MA50 (red trend-line). Last week, the price even broke above the top (Lower Highs trend-line) of the Falling Wedge pattern and then the 1D MA100 (green trend-line).
Despite the successive break-outs, this rally may not be technically over as the very same Falling Wedge break-out fractal in March 2022 extended as high as the 0.9 Fibonacci retracement level. As a result, we can see an extension to $195.00 before any short/ medium-term pull-back to the 1D MA50 (blue trend-line) again.
-------------------------------------------------------------------------------
** Please LIKE 👍, FOLLOW ✅, SHARE 🙌 and COMMENT ✍ if you enjoy this idea! Also share your ideas and charts in the comments section below! This is best way to keep it relevant, support us, keep the content here free and allow the idea to reach as many people as possible. **
-------------------------------------------------------------------------------
💸💸💸💸💸💸
👇 👇 👇 👇 👇 👇

Could Huawei device sales overtake Apple's iPhone 15 in China?Apple's (AAPL) iPhone 15 sales are reportedly slumping among Chinese consumers, down 4.5% compared to the first few weeks of the iPhone 14's sales. Huawei's Mate 60 line of foldable phones has been making waves over its new hardware features, but is it enough to overturn Apple's dominance in the Chinese market?
IDC Worldwide Tracker Team Research Director Nabila Popal comments on whether the domestic developer could truly capture Apple's market share if geopolitical tensions in the U.S.-China semiconductor race open up new opportunities for Huawei.
"It will take a lot of time for Huawei to gain back that lost share, especially... if you zone in on just the premium segment within China, Huawei at its peak had about 58% share," Popal says.

Apple’s IPhones Off to Disappointing Start in ChinaApple Inc.’s new iPhone 15 is selling far worse in China than its predecessor, according to separate analyses, reflecting stubbornly weak consumption as well as the rise of rivals like Huawei Technologies Co.
Sales of Apple’s flagship device are down 4.5% compared with the iPhone 14 over their first 17 days after release, market tracker Counterpoint Research estimated in previously unreported figures provided to Bloomberg News. Jefferies analysts led by Edison Lee reckoned sales of the iPhone 15 were down by an even sharper double-digit percentage from its predecessor after Huawei outsold Apple overall, powered by the surprising debut of the Mate 60 Pro.
The twin reports mark a potential blow to Apple at a time it’s grappling with the weakest smartphone demand in a decade and a backlash from overheating models. If the initial estimates are accurate, they represent one of the iPhone’s worst debuts in China since around 2018, when local names like Oppo and Vivo began to captivate Asian consumers.
Counterpoint blamed the iPhone’s slump in China mainly on an economy struggling to rebound from its Covid trough. And it stressed that in the US, the iPhone 15 likely posted a double-digit rise over 2022 in the first nine days of sales.
But the iPhone’s debut in China came weeks after the launch of the Mate 60 Pro, celebrated as a triumph over US sanctions because of its advanced made-in-China processor. It also coincided with a government mandate to expand a ban on iPhone use to government agencies and state companies, underscoring Apple’s growing challenges there.

Apple #Apple stock is at 178.30-180.
In 2021 this price range - act as support
In my opinion it's a good deal to invest in #Apple right now, Christmas is coming, a lot of guys will buy new #iPhone15 and #iPhone15Pro
Pushing the price down from 197.07 to current price of 178 is a corrective action that will push the price higher as long as 171 -172 will act a serious support area
#stockmarkets #StocksToBuy #StocksInFocus #StockToWatch

APPLE and the NEW IPHONE 15 seriesIn two days, the unveiling of the new series of best-selling and popular products of the Apple company will take place. iPhone series 15
According to the history, we can expect the growth of Apple shares
According to the presented chart, a growth potential of 7% can be considered.
Don't forget capital management
Adhere to the appropriate risk-to-reward ratio
Good luck and profitable

APPLE Next stop 200 after a pull-backLast time we bought APPLE (AAPL) on the short-term was on June 05 (see chart below), after a technical pull-back, and easily hit our 190 target:
The stock has maintained the Channel Up since late March with the 1D MA50 (blue trend-line) in Support since January 25. Based on the 1D RSI, which has been within a Rectangle pattern while the stock is on the Channel Up, we are about to see a technical pull-back towards the Higher Lows (bottom) trend-line and then rebound for a Higher High. That is a short-term opportunity for buyers to target $200.
-------------------------------------------------------------------------------
** Please LIKE 👍, FOLLOW ✅, SHARE 🙌 and COMMENT ✍ if you enjoy this idea! Also share your ideas and charts in the comments section below! **
-------------------------------------------------------------------------------
💸💸💸💸💸💸
👇 👇 👇 👇 👇 👇

AAPL - BULLISH SCENARIOKeyBanc raised its price target for Apple (NASDAQ:AAPL) to $200 from $180 and maintained an Overweight rating on the stock. However, analysts expressed neutrality in the near term despite their positive long-term outlook.
They reiterated their below-consensus revenue estimates for Apple's hardware in the third quarter of 2023. The analysts highlighted two concerns. First, Key first look data (Apple direct channel) showed strong spending in June compared to historical averages, but a quarter-on-quarter decline worse than historical averages. Second, KeyBanc expected softness in Apple's indirect channel (U.S. Carriers) due to historically low upgrade rates in the United States.
The analysts concluded by stating that for Apple to achieve favorable results, international sales must compensate for underperforming U.S. sales. Their price target is set at $200, based on a multiple of 20.8x their 2024 adjusted EBITDA estimates.
Risk Disclosure: Trading Foreign Exchange (Forex) and Contracts of Difference (CFD's) carries a high level of risk. By registering and signing up, any client affirms their understanding of their own personal accountability for all transactions performed within their account and recognizes the risks associated with trading on such markets and on such sites. Furthermore, one understands that the company carries zero influence over transactions, markets, and trading signals, therefore, cannot be held liable nor guarantee any profits or losses.

$AAPL Tops out in August This chart of NASDAQ:AAPL shows that it makes a monthly high in the month of August, is it going to be the same this year?

$AAPL head and shoulders? 👁🗨️*This is not financial advice, so trade at your own risks*
*My team digs deep and finds stocks that are expected to perform well based off multiple confluences*
*Experienced traders understand the uphill battle in timing the market, so instead my team focuses mainly on risk management
!! This chart analysis is for reference purposes only !!
If you want to see more, please like and follow us @SimplyShowMeTheMoney

APPLE Inverse Head and Shoulders give a new All Time HighApple Inc. (AAPL) has just completed an Inverse Head and Shoulders pattern, with its Head being the January 03 market Bottom. The Bear Cycle isn't technically over for Apple as the Channel Down that started back on the October 04 2021 Low hasn't yet been broken. In fact since the last two Lower Highs sequences have been +31.11% and +36.78%, the current rally is limited within the red Triangle Zone. As a result we have a short-term target at $165.00.
With the Inverse Head and Shoulders though technically aiming much higher, supported also by a 1W MACD Bullish Cross, if Apple closes a 1W candle above the Channel Down, we will re-buy and target $190.00 on the long-term, which is just below the 2.0 Fibonacci extension level.
-------------------------------------------------------------------------------
** Please LIKE 👍, FOLLOW ✅, SHARE 🙌 and COMMENT ✍ if you enjoy this idea! Also share your ideas and charts in the comments section below! **
-------------------------------------------------------------------------------
💸💸💸💸💸💸
👇 👇 👇 👇 👇 👇n

bearish on aaple short termwe are still not out of inflation, feds have predicted that this year will turn and we will be at a reasonable point, but we aren't there yet. that causes consumers to be on the savings side rather than buying for now. apple has a huge following, understood, but coming out with higher end phones at higher prices doesn't seem to make the most sense in the situation. people are getting less features for a higher price, with a better camera sure... i know im going to be ridiculed for being a green bubble on their phones but at least for the short term, doesn't seem like they have many "innovative" ideas that aren't already in other phones on the market. this is just my two cents. we're getting into folding screens, Samsung has DeX which allows users to have a desktop environment when plugged into a tv or monitor, or stream it over the air...
i will say, the processors that apple have been dishing out have been nothing but extraordinary, and the universal chips through iphone/ipad/macbook make the absolute most sense since they can massively cut down on cost and waste. all while on good silicon and providing very good battery life (as long as software doesnt bog it down)
short term... looking down, but i've always respected apple to keep in line with their audience and probably release some good numbers in the quarter coming with the M2 pro chip coming out

Apple misses earnings...now what?Apple has seen a massive reversal on earnings. A clear rejection off the 50 Weekly Moving Average has been observed.
The sin Curve of the major moving average is starting to slope down with force and looks poised to start the next down leg with this rejection.

What happens next for AAPL?As you can clearly see on the chart, the AAPL price has been bouncing back-and-forth between 2 lines (“support” & “resistance”) dating all the way back to 1981!
However, with these 2 lines quickly approaching a point of convergence as the AAPL price approaches a new ATH, something’s gotta give.
And so I ask - what happens next?

AAPL The Market doesn`t Bottom until Apple Bottoms !After another potential rally to $150, i expect that AAPL Will bottom this year at $107 on slower demand for their iPhones in the gift season.
iPhone is still responsible for 50% of Apple`s revenue.
Looking forward to read your opinion about it.

APPLE confirmed a bullish extension. Potential for $167.Apple Inc. (AAPL) broke on Friday above the 1D MA50 (blue trend-line) following the strong rebound after Wednesday's big drop on the monthly inflation (down -0.5% to 7.7%), fueled by hopes of a future monetary easing by the Fed. Even though technically the last rejection was made on the 1D MA200 (orange trend-line), it is the 1D MA50 that confirmed the bullish extension during both July 07 but mostly March 22, which is the fractal that resembles the price action since mid-August the most.
With the RSI sequences between the two quite similar, it appears that we are in that final phase that will form the new Lower High on the Lower Highs trend-line since January 03, which has been basically the Resistance of this whole Bear Cycle. The March 2022 rally topped above the 0.786 Fibonacci retracement level. That is now on $167.45, with the January Lower Highs trend-line extending even above $170.00. Solid medium-term buy opportunity for Apple.
-------------------------------------------------------------------------------
** Please LIKE 👍, SUBSCRIBE ✅, SHARE 🙌 and COMMENT ✍ if you enjoy this idea! Also share your ideas and charts in the comments section below! This is best way to keep it relevant, support me, keep the content here free and allow the idea to reach as many people as possible. **
-------------------------------------------------------------------------------
You may also TELL ME 🙋♀️🙋♂️ in the comments section which symbol you want me to analyze next and on which time-frame. The one with the most posts will be published tomorrow! 👏🎁
-------------------------------------------------------------------------------
👇 👇 👇 👇 👇 👇
💸💸💸💸💸💸
👇 👇 👇 👇 👇 👇

InvestMate|🍎Apple's time to shine🍎🍎Apple's time to shine🍎
🍎 The week of third quarter financial results is upon us. On 27 October, we will find out how Apple's reports stack up.
🍎 The tech industry is already thundering about the desire to cut jobs. Apple is one of those companies that eschews these rumours, definitely standing out from its Silicon Valley competitors. Instead, there are reports that Apple is reducing production of its flagship smartphones.
🍎 From a technical point of view, things are looking very good for Apple.
🍎 It is one of the few companies that has not broken through the new lows set in June at $129 per share.
🍎 We have seen a big slide in price over the last 2 months. We then fell to a double bottom and last week the massive buying of shares started.
🍎For the last 2 weeks we have seen a rise of 10%
🍎We have broken out of a strong support zone.
🍎 Looking from a technical point of view, the way to the 156-160 level seems open.
🍎 Looking at the Fibonacci measures in the zone between 160-162, we have created an interesting cluster of levels that the price will have to reach if we are talking about growth and good performance of the company. It will be an increase of almost 9%
🍎There are two options for position management here, one risky with a stop at $140 per share and the other safe with a stop at levels of 137.5
🍎 With a take profit level at $160 per share.
🚀If you appreciate my work and effort put into this post I encourage you to leave a like and give a follow on my profile.🚀

APPLE - BULLISH SCENARIONASDAQ:AAPL has a "high" Earnings Quality Ranking for the 36th consecutive week. Earnings quality refers to the extent to which current earnings predict future earnings. NASDAQ:AAPL Introduces Next-Generation iPad Pro, Supercharged by the M2 Chip on the 18th, and the news was reflected in trend reversal formation on the chart.
Risk Disclosure: Trading Foreign Exchange (Forex) and Contracts of Difference (CFD's) carries a high level of risk. By registering and signing up, any client affirms their understanding of their own personal accountability for all transactions performed within their account and recognizes the risks associated with trading on such markets and on such sites. Furthermore, one understands that the company carries zero influence over transactions, markets, and trading signals, therefore, cannot be held liable nor guarantee any profits or losses.

Apple - Will next earnings reinforce the selling pressure?After the 242% run-up from its lows during the 2020 crash to its high in January 2022, Apple gave up almost 20% in regard to the current value. In addition to that, the introduction of the new iPhone 14 has not created much hype among consumers and market participants. Since the release of the new product, the price has continued to be choppy and seemingly returning to its 2022 lows.
Because of that, we will continue to monitor the Apple stock in the coming weeks and provide a more detailed update on the price and its potential future direction. However, at the moment, we abstain from setting a price target for this stock title.
Illustration 1.01
Illustration 1.01 displays the daily chart of Apple stock and two moving averages, 20-day SMA and 50-day SMA. In addition to that, two yellow arrows point to natural retracements toward the price's moving averages, acting as a correction of the downward move. If the price fails to break above the 20-day SMA and then subsequently above the 50-day SMA, then it will add to a bearish consensus.
Illustration 1.02
The picture above shows the weekly chart of Apple stock and two simple moving averages; now, 20-week SMA and 50-week SMA. The yellow arrow pinpoints the similar retracement toward (and even above) these SMAs; in this particular example, the retracement represents a strong correction of the downtrend.
Please feel free to express your ideas and thoughts in the comment section.
DISCLAIMER: This analysis is not intended to encourage any buying or selling of any particular securities. Furthermore, it should not be a basis for taking any trade action by an individual investor. Therefore, your own due diligence is highly advised before entering a trade.

apple is not passing his best moment like all the market apple one of the most influential companies of the last decade doesn't have a good prediction for their next months

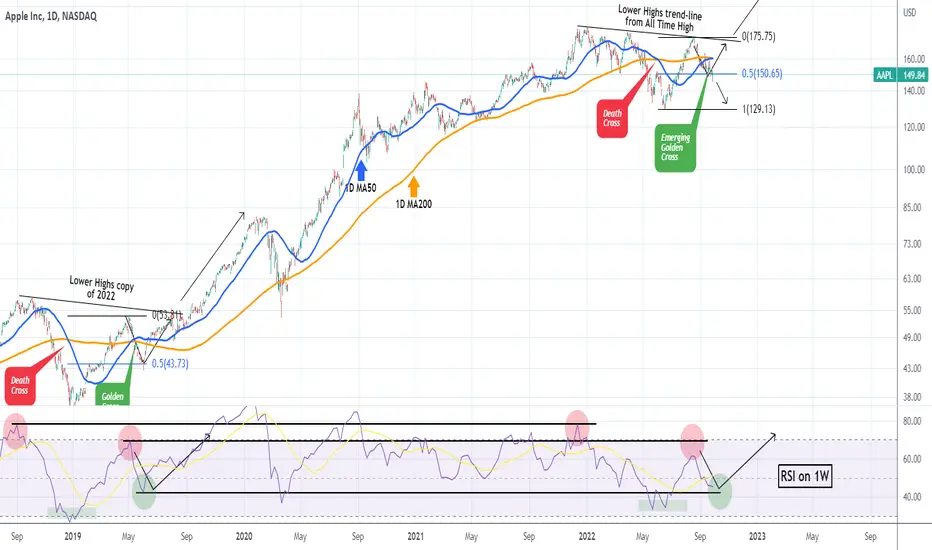
AAPLE -50% of June rally lost. Will it recover on the 2019 fractApple (AAPL) has fallen more than -17% from the mid-August High, losing more than half of the gains made on the June 16 rally. Right now it is exactly on the 0.5 Fibonacci retracement level on that High-Low sequence and on top of that a Golden Cross pattern is emerging (when the 1D MA50 (blue trend-line) crosses above the 1D MA200 (orange trend-line)).
We have explicitly outlined this potential fall to the 0.5 Fib if the price got rejected on the Lower Highs trend-line from the All Time High, on our August 17 idea:
As you see the timing couldn't be better as those where the days that the top was formed and the price got rejected. The last time we saw a similar pattern was on the June 03 2019 test of the 0.5 Fib. That was also caused by a rejection near the 2018 Lower Highs but the Golden Cross was formed a little earlier. After a marginal breach of the 0.5 Fib (such as the one we had yesterday), Apple resumed the uptrend and the recovery path.
See also the similarities on the RSI (1W time-frame), though this time it got rejected slightly below the Resistance level it did back in May 2019. This may possibly mean that we can see a rebound slightly higher than the symmetrical Support level. Another closing below it though can initiate an aggressive sell-off towards June's lows. In our view it is critical to see the Golden Cross forming, which should encourage buyers to accumulate.
-------------------------------------------------------------------------------
** Please LIKE 👍, SUBSCRIBE ✅, SHARE 🙌 and COMMENT ✍ if you enjoy this idea! Also share your ideas and charts in the comments section below! This is best way to keep it relevant, support me, keep the content here free and allow the idea to reach as many people as possible. **
-------------------------------------------------------------------------------
You may also TELL ME 🙋♀️🙋♂️ in the comments section which symbol you want me to analyze next and on which time-frame. The one with the most posts will be published tomorrow! 👏🎁
-------------------------------------------------------------------------------
👇 👇 👇 👇 👇 👇
👇 👇 👇 👇 👇 👇
👇 👇 👇 👇 👇 👇
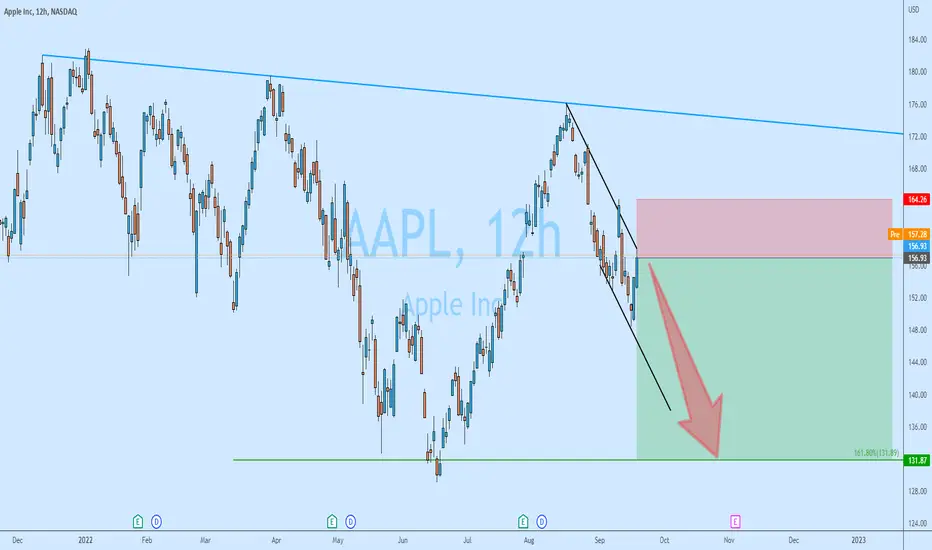
Apple (APPL) is about to crashThere is an established downtrend on Apple, and recent pullback might be just another great selling opportunity.
Apple '20, '21 and maybe in '22?There seems to be a pattern in the chart, in the past two years, months before the launch of a new iPhone, Apple's stock price seems to be influenced by the speculation that the brand creates, and weeks before its announcement there is a new ATH to continue with a drop in price between -15% and -25%, after that drop there seems to be an opportunity to open a position for the next few months until the next announcement (2020 : 50%, 2021 : 25%)
Will this opportunity be repeated this year?
