Amazon CloudAmazon (AMZN) just reached the cloud. The last time this happened was in November 2008. Could be a rare buying opportunity. Does anyone see things differently?
Not financial advice.
Nasdaq Composite Index CFD

Nasdaq 100 - An opening gap, high anxiety and more downsideOvernight, the Nasdaq continuous futures opened 1.6% lower. As a result, NQ1! erased its gains from the prior trading session; this development hints at elevated anxiety among market participants, who are eager to take profits off the table as soon as possible. The opening gap pushes the odds to the downside for the stock market. Additionally, we foresee the same pressure from higher interest rates in the U.S. and economic tightening around the globe. Therefore, we stay adamant in our bearish stance on the Nasdaq 100 index. Accordingly, we would like to set new price targets for NQ1! to 11 750 USD and 11 500 USD.
Illustration 1.01
Illustration 1.01 shows the opening gap on NQ1!.
Technical analysis - daily time frame
RSI, MACD, and Stochastic are bearish. The same applies to DM+ and DM–. The ADX shows no signs of weakening, which suggests that the bearish trend is still present and strong. Overall, the daily time frame remains bearish for NQ1!.
Illustration 1.02
The picture above shows seven weeks of selling in the Nasdaq 100 index, which leaves many traders asking whether the bear market rally will be seen on the horizon soon. We start to notice the first oversold signs on the weekly time frame, which raises caution.
Technical analysis - weekly time frame
RSI reached oversold condition. Stochastic, MACD, DM+, and DM- are all bearish. The ADX continues to increase. Overall, the weekly time frame remains bearish.
Please feel free to express your ideas and thoughts in the comment section.
DISCLAIMER: This analysis is not intended to encourage any buying or selling of any particular securities. Furthermore, it should not serve as a basis for taking any trade action by an individual investor. Therefore, your own due diligence is highly advised before entering a trade.

Daily Market Update for 5/24Summary: Snap Inc. sent an ominous signal to the market by reducing guidance, causing tech and growth stocks to sell off heavily in the morning before recovering some of the losses.
Notes
Ideas always welcome in the comments. Errors will be amended as comments on TradingView or corrected inline in my blog.
-=x=-=x=-=x=-=x=-=x=-=x=-=x=-
Tuesday, May 24, 2022
Facts: -2.35%, Volume lower, Closing Range: 66%, Body: 24% Red
Good: Good closing range over long lower wick
Bad: Lower high, lower low, higher volume on decline
Highs/Lows: Lower high, Lower low
Candle: Thin red body in upper part of candle, longer lower wick
Advance/Decline: 0.3, More than three declining stocks for every advancing stock
Indexes: SPX (-0.81%), DJI (+0.15%), RUT (-1.56%), VIX (+3.41%)
Sector List: Utilities (XLU +2.00%) and Consumer Staples (XLP +1.64%) at the top. Consumer Discretionary (XLY -2.57%) and Communications (XLC -3.55%) at the bottom.
-=x=-=x=-=x=-=x=-=x=-=x=-=x=-
Market Overview
Snap Inc. sent an ominous signal to the market by reducing guidance, causing tech and growth stocks to sell off heavily in the morning before recovering some of the losses.
The Nasdaq fell by -2.35% on higher volume than the previous day. The long lower wick was created at open as key economic metrics missed the forecast. However, the index recovered some of the loss and closed with a 66% closing range. The 24% red body sits at the top of the candle. There were more than three declining stocks for every advancing stock.
The Dow Jones Industrial Average (DJI) was able to finish the day with a gain, advancing +0.15%. The S&P 500 (SPX) declined by -0.81%. The Russell 2000 (RUT) declined by -1.56%. The VIX Volatility Index increased by +3.41%.
Five of the eleven S&P 500 sectors gained, led by defensive sectors. Utilities (XLU +2.00%) and Consumer Staples (XLP +1.64%) were at the top of the list. Consumer Discretionary (XLY -2.57%) and Communications (XLC -3.55%) were at the bottom, with the former being impacted by Snap's news.
Manufacturing PMI data for May met the forecast of 57.5 but the Services PMI fell short, coming in at 53.5 compared to the forecast of 5.2. The PMI data is a signal of economic activity within these two sectors.
New Home Sales for April also came in lower than expected. There were only 591,000 new home sales compared to the forecast of 750,000. The previous month was 709,000. The new number shows a significant slowdown.
API Weekly Crude Oil Stock was higher than expected.
The US Dollar Index (DXY) continued to decline, dropping by -0.32% today. US 30y, 10y, and 2y yields were all lower. High Yield (HYG) and Investment Grade (LQD) Corporate Bond prices were higher, tracking with treasury prices.
The put/call ratio (PCCE) rose to 0.903. The CNN Fear & Greed Index remained in the Extreme Fear range.
All of the big six mega-caps declined, with Facebook (FB) dropping the most, losing -7.62% today. Microsoft (MSFT) held up the best, declining only -0.40%.
Verizon (VZ) was the top mega-cap for the day, gaining +2.03%. Consumer Staples and Health mega-caps dominated the rest of the top ten. Facebook was at the bottom of the list, followed by Tesla (TSLA) which fell by -6.93%.
There was only one gainer in the Daily Update Growth List. Zoom Video (ZM) climbed by +5.61% as its earnings report showed continued growth despite the winding down of the pandemic. After Zoom Video, all the stocks on the growth list fell by more than 2%. Five stocks on the list fell more than 10%, led by Snap Inc (SNAP) which dropped by a huge -43.08%.
-=x=-=x=-=x=-=x=-=x=-=x=-=x=-
Looking ahead
Wednesday will kick off with the Core Durable Goods Orders data for April. After the market opens we will get the Crude Oil Inventories.
The FOMC Meeting Minutes from the early May meeting will be available in the afternoon.
Nvidia (NVDA), Trip.com (TCOM), and Box Inc (BOX) are a few of the earnings reports for Wednesday. I mistakenly
-=x=-=x=-=x=-=x=-=x=-=x=-=x=-
Trends, Support, and Resistance
The Nasdaq continued its downtrend but held above Friday's low.
After the dip in the morning, the index trended higher the rest of the day. If the one-day trend line continues into Wednesday, we can expect a +0.69% gain.
The five-day trend line points to a -1.07% decline.
If the index returns to the trend line from the 3/29 high, that would mean a -2.56% decline.
-=x=-=x=-=x=-=x=-=x=-=x=-=x=-
Wrap-up
Snap's message of lower guidance due to economic disruptions drove even more fear among investors in tech and growth stocks, resulting in today's sell-off. The bleeding continues, and the only question is when will it stop. Perhaps we will continue to bounce around at this level, or maybe we will move lower.
If we can start to see indications of a top to inflation, that will help build more support for gains. Inflation needs to come under control without massive interest rate hikes that will further slow down growth.
Stay healthy and trade safe!

Daily Market Update for 5/23Summary: Stocks rallied on Monday thanks to a stronger Euro after the European Central Bank said rate hikes would come later this year.
Notes
I've been traveling for the past two weeks and have not been able to write the Daily Market Update. I'm back at home and will continue covering the markets as often as I can.
Ideas always welcome in the comments. Errors will be amended as comments on TradingView or corrected inline in my blog.
-=x=-=x=-=x=-=x=-=x=-=x=-=x=-
Monday, May 23, 2022
Facts: +1.59%, Volume lower, Closing Range: 93%, Body: 56% Green
Good: High closing range
Bad: Lower volume on gain, lower high than previous day
Highs/Lows: Lower high, Higher low
Candle: Inside day, upper half green body, lower half wick
Advance/Decline: 1.07, about the same number of advancing and declining stocks
Indexes: SPX (+1.86%), DJI (+1.98%), RUT (+1.10%), VIX (-3.23%)
Sector List: Financials (XLF +3.25%) and Energy (XLE +2.64%) at the top. Health (XLV +0.88%) and Consumer Discretionary (XLY +0.75%) at the bottom.
-=x=-=x=-=x=-=x=-=x=-=x=-=x=-
Market Overview
Stocks rallied on Monday thanks to a stronger Euro after the European Central Bank said rate hikes would come later this year.
The Nasdaq rose by +1.59% for the day, but it was not enough to reach the previous day's high. The inside day came with lower volume, but the closing range of 93% and 56% green body in the upper half of the candle is positive. There was a nearly equal number of advancing and declining stocks.
The Dow Jones Industrial Average (DJI) outperformed the other indexes, gaining by +1.98% while the S&P 500 (SPX) advanced by +1.86%. The Russel 2000 (RUT) climbed by +1.10%. The VIX Volatility Index declined by -3.23% but remained elevated as it has been since the beginning of May.
All eleven S&P 500 sectors gained. Financials (XLF +3.25%) and Energy (XLE +2.64%) were the best two sectors for today. Health (XLV +0.88%) and Consumer Discretionary (XLY +0.75%) were at the bottom of the sector list.
The US Dollar Index (DXY) dropped by -0.91% and is down 2.5% from its peak in early May. US 30y, 10y, and 2y Treasury Yields all rose. High Yield (HYG) Corporate Bond prices moved higher while Investment Grade (LQD) Corporate Bond prices declined. Copper and Aluminum Futures continued to rise.
The put/call ratio (PCCE) dropped to 0.829. The CNN Fear & Greed index is in the Extreme Fear range.
Five of the big six mega-caps advanced. Amazon (AMZN) was the only one to decline but fell just -0.03%. Apple (AAPL) had the biggest gain, advancing +4.01%, followed by Microsoft which moved up by +3.20%. All six have work to do before getting back to their key moving average lines.
Financial stocks topped the broader mega-cap list. JP Morgan (JPM) and Bank of America (BAC) were the top gainers, advancing +6.19% and +5.94% respectively. Broadcom (AVGO) was at the bottom of the list, declining by -3.10%. There were only four mega-caps that declined.
The Daily Update Growth List had some gainers, but overall more than half of the list declined. DoorDash (DASH) topped the list with a +2.39% gain. Peloton (PTON) had the biggest loss, declining by -6.13%.
-=x=-=x=-=x=-=x=-=x=-=x=-=x=-
Looking ahead
Purchasing Manager Index data for May will be available after the market opens tomorrow. That includes Manufacturing, Services, and Composite measurements. We will also get New Home Sales data for April.
Nvidia (NVDA), Trip.com (TCOM), and Box Inc (BOX) are a few of the earnings reports for Tuesday.
-=x=-=x=-=x=-=x=-=x=-=x=-=x=-
Trends, Support, and Resistance
Although the day ended with positive gains, the lower high means the index is still in a down trend.
If the one-day trend continues, that would mean a +1.33% gain for Tuesday.
If the index returns to the five-day trend line and or the trend line from the 3/29 high, that would result in a -3.86% decline.
-=x=-=x=-=x=-=x=-=x=-=x=-=x=-
Wrap-up
It's been a wild few weeks. Part of me is happy I was on break and didn't report daily. Part of me thinks there was much to learn from the market data and could have benefited.
Let's hope for some new highs throughout this week and some gains on higher volume, shared broadly across the market.
Stay healthy and trade safe!

Nasdaq is about to begin outperforming the S&P 500The Nasdaq 100 (QQQ) has reached its support level when compared as a ratio to the S&P 500 (SPY). In the coming weeks to months there is a high probability that the Nasdaq will likely to begin outperforming the S&P 500.
Not financial advice.

Nasdaq Extremely OversoldThis is a side-by-side comparison of the Nasdaq daily chart from March 2009 with today (May 2022). The charts are looking very similar to one another. The heatmap on the daily chart has not been this cold since the bottom of the Great Recession. The daily plot is nearing a record low. While this daily chart cannot make long term predictions, it suggests that we are at a bottom right now and the Nasdaq is about to move back up for the coming weeks to months.

Nasdaq 100 - A potential bull trap in the futures market?The Nasdaq 100 index showed some relief yesterday and made a higher high since its low on 19th May 2022. However, smaller time frames suggest that the willingness of market participants to buy at rising prices diminishes. Therefore, this leaves us to speculate whether the Nasdaq 100 index is getting positioned for another leg down. At the same time, the daily volume continues to increase which is bearish; also because of that, we still remain bearish on the index and expect it to make new lows. Because of that, we would like to set a new short-term price target for NQ1! at 12 000 USD and a medium-term price target at 11 900 USD (due to become short-term after 12 000 USD is taken out).
Our price targets for QQQ remain at 285 USD and 280 USD.
Illustration 1.01
The picture above shows a bull trap we pointed out just a few hours before the market sold off more than 5%. We notice similarities in the prior and the current developments, which prompted us to our speculation about another “bull trap”.
Technical analysis - daily time frame
RSIs bearish structure remains intact. MACD and Stochastic are bearish. The same applies to DM+ and DM-. Meanwhile, ADX increases. Overall, the daily time frame remains bearish.
Illustration 1.02
Simple moving averages are bearish. Additionally, we pay close attention to the area below the lower bound of the channel.
Technical analysis - weekly time frame
RSI, MACD, Stochastic, DM+, and DM- are bearish. ADX increases. Overall, the weekly time frame is bearish.
Illustration 1.03
The picture above shows the intact sloping resistance.
Please feel free to express your ideas and thoughts in the comment section.
DISCLAIMER: This analysis is not intended to encourage any buying or selling of any particular securities. Furthermore, it should not serve as a basis for taking any trade action by an individual investor. Therefore, your own due diligence is highly advised before entering a trade.

Nasdaq - Channel has been broken, a possible downfall to follow!Yesterday, we stated that the rally was due to end and the bearish trend to resume. Then, a few hours later, the Nasdaq 100 index fell more than 5%. In the aftermarket, the selling continued; and in the early hours of futures trading, Nasdaq futures sold off as well. Then, the index (continuous futures - NQ1!) erased some of its losses and turned positive. At the moment, NQ1! trades around 11 920 USD. We expect a little bit of relief ahead of the U.S. market opening; however, our stance remains bearish, and we expect new lows in the Nasdaq 100 index. Therefore, we would like to set a new short-term price target for QQQ at 285 USD and the medium-term price target at 280 USD (it will become the short-term price target after hitting 285 USD).
We think what highlights yesterday's selloff is that no significant headlines were made in the news, and despite that, the stock market fell by an astounding amount. Market participants can observe that anxiety and fear are extremely high, which leads to strong price actions to the upside. However, these bounces tend to last shortly and are quickly followed by massive selloffs. These are particular signs of the bear market.
In addition to that, we would like to note the downward moving channel has been broken yesterday - which we expect to culminate in the acceleration of the selling pressure.
Illustration 1.01
The picture shows NQ1! (Nasdaq continuous futures). It can be observed that buyers did not manage to push the price through the sloping resistance; a breakdown in the price of the index followed.
Technical analysis - daily time frame
RSI, MACD, and Stochastic are all bearish again. DM+ and DM- are bearish too. A move up by the ADX suggests that the bearish trend has resumed. Overall, the daily time frame is very bearish.
Technical analysis - weekly time frame
RSI, MACD, and Stochastic are all bearish. The same applies to DM+ and DM-. ADX increases. Overall, the weekly time frame remains bearish.
Please feel free to express your ideas and thoughts in the comment section.
DISCLAIMER: This analysis is not intended to encourage any buying or selling of any particular securities. Furthermore, it should not serve as a basis for taking any trade action by an individual investor. Therefore, your own due diligence is highly advised before entering a trade.

Nasdaq100 MAKE it or BREAK it After seven weeks of downward movement in the Nasdaq100 losing more than 22% it closed this week at 11835 points, it is now near to test the 200EMA at 11362 points (red line) for the first time since 2020 pandemic sell-off and that’s the last major support on the medium term and historically the 200EMA is the strongest support in the uptrend, so we have two scenarios now first one is to rebound from here like what happened in 2018 and 2020 with aggressive buyers and huge volumes signaling a clear control for the buyers, in this case, investors are advised to wait till the first confirmation and reenter the market and accumulate long positions and to close all short positions.
The second scenario is to penetrate this level to the downside to break the 200EMA for the first time since the financial crisis in 2008 and accordingly that will break the uptrend in the medium term and enter a downtrend market controlled by Bears, in this case, investors are advised to close all the long positions and keep as much cash as they can using maximum 30% of the cash to open short positions till the confirmation of the market direction or any appearance of reversal signs.
NASDAQ:NDX TVC:NDQ NASDAQ:QQQ NASDAQ:SQQQ NASDAQ:TQQQ NASDAQ:QQQ AMEX:PSQ

The curious case of a massive Bull Rally in all marketsThis is not a crypto analysis , I have more holdings in stock market than in crypto so that's what I care about.
But the curious case here is the situation in BTC long contracts.
It's at a historical high , so high that the indicators at the bottom have no place to go anymore and they are all signaling a downturn in these long contracts.
SO why does this matter?
Because since July 2021 the BTC market is almost 1:1 correlated with stock market.
That is because with mining power leaving China the crypto domination now are in the hands of the USA or Wall Street to a certain degree. The biggest investors of crypto are big funds and VCs in the US and they are dictating the price.
And since then, this particular BTC Long contract chart is in a negative correlation with the stock market.
As we have come to an end in this massive rise in long contracts what will happen next is a big upwards move in BTC, SPX and NDX.
At this point no rhetoric about recession, interest rates, war, uncertainty etc. won't matter.
This is like seasons, spring will come no matter what.
And here it is!

NASDAQ Prediction (No Guess) Based on mathematical modelHello traders!
I was analyzing NAS100 by using different mathematical formulas and models recently, then I just tried my favorite mathematical cubic curve model & the prediction is shocking.
NAS100 weekly chart is predicting the price in October aprox. 9000 !!!!!!!!!!!!
Isn't it Shocking ;)
P.S. This is just an analysis based on my personal research & not a financial advise !!!!!

Comparing the Nasdaq, S&P, and the M2 money supplyThe current drawdown in the stock market may not appear like much when looking at a monthly chart, however when comparing to the money supply it tells a different story. From the peak of the dot com bubble the entire market is still down significantly when adjusted for all the money printing the fed has done.

Nasdaq Composite Index divided by M1 and M2 money supply The current drawdown in the Nasdaq may not appear like much when looking at a monthly chart for example, however when comparing to the money supply it tells a different story. Compared to M2 we are at the same level seen in early 2020, however compared to M1 we are at levels not seen since 1991.

Nasdaq 100 - A correction is moving towards its endWe continue to be bearish on QQQ even despite the current bounce in price (correction). Indeed, we think that the current pricing is attractive for (re)entry of short position. Since all our price targets were hit before the rally; therefore, we would like to set a new short-term price target for QQQ at 300 USD. We would also want to set a medium-term price target of 290 USD.
Illustration 1.01
The picture above shows short-term support levels as well as relief from the selling pressure.
Please feel free to express your ideas and thoughts in the comment section.
DISCLAIMER: This analysis is not intended to encourage any buying or selling of any particular securities. Furthermore, it should not serve as a basis for taking any trade action by an individual investor. Therefore, your own due diligence is highly advised before entering a trade.

The worms are eating their fill on AAPLOutperforming all indices to the downside. Bounce probably soon but nothing major if this is a C wave.
Look for that 130 area and under by next week.

Nasdaq 100 - Dip buyers about to get obliterated Yesterday, Nasdaq 100 pushed above the immediate resistance we hinted at in our latest post on QQQ. We think the rally is due to end and the bearish trend to resume. Therefore, we would like to set a new short-term price target for NQ1! at 12 250 USD. We would also like to set a medium-term price target at 12 000 USD.
Illustration 1.01
The picture above shows yesterday's bullish breakout on the hourly chart. In our opinion, this is potentionally a perfect bull trap. Although, we will pay close attention to the price action of NQ1!; if it manages to break above the immediate resistance then it is likely that NQ1! might experience the last push higher before faltering.
Technical analysis - daily time frame
RSI points to the upside, which is bullish; however, we expect it to break down and turn bearish soon (the same applies to other mentioned indicators). MACD strives for a bullish crossover. Stochastic is bullish. DM+ and DM- remain bearish, while ADX signals a pause in selling pressure. Overall, the daily time frame shows less bearish conditions than a week ago; although, we still maintain a notion that the current bounce in price is just a “downtrend” rally.
Illustration 1.02
The picture above shows the daily chart of QQQ.
Technical analysis - weekly time frame
RSI and MACD remain bearish. Stochastic is bullish. DM+ and DM- signal the presence of a bearish trend. ADX grows which suggests that the bearish trend has not peaked. Overall, the weekly time frame is bearish.
Please feel free to express your ideas and thoughts in the comment section.
DISCLAIMER: This analysis is not intended to encourage any buying or selling of any particular securities. Furthermore, it should not serve as a basis for taking any trade action by an individual investor. Therefore, your own due diligence is highly advised before entering a trade.

NASDAQ Corrective WaveNasdaq is currently on corrective WAVE 3 on it's way to finish WAVE 4.
Looks like it's making a Zig Zag ABC correction and if it's true, then we could see a rebound from the "BLUE zone" to close several gap there before continue it's journey to WAVE 5.
Last correction area is the "YELLOW line".
Wave 4 invalid if price's touching the "RED line".

2008 is back.*As a Korean, I do not speak English. I used a translator. I get a lot of ideas from English-speaking countries while doing stocks.
Please send us your detailed comments.
*I need the opinions of great Americans
*History repeats itself.
]
Evidence is the chart pattern and * The US economy is similar.
If my prediction is correct.
After a bit of a rebound, the real hellish bear market begins. I think it will go down to the lowest point during the corona period. March 2020

Nasdaq100 inverse Head and Shoulders Chart PatternNasdaq 100 P/E ratio on May 12, 2022 was 20.71, which is below the Median of 26.59 or the Average of 30.04.
In the past 5 years, the Minimum was 15.74 on MAR 23 2020 and Maximum 86.30 on JUN 28 2017.
I have 2 scenarios:
1. Inverse head and shoulders chart pattern with a price target of $16650 by the end of the year.
2. Worst case scenario: bull trap at $13350 an retracement to the pre-pandemic level of $9750. I tend not to believe this scenario because of the too low price per earnings ratio of NDX.
Looking forward to read your opinion about it.

AAPL - follow the worms!Ideal short entry today. Down to 120 area by early June if I'm right. Panic selling hasn't started just yet.

NQ testy testy lost the channel and now retesting it. I think it's another objective short along with all big tech. This is a correction, not a rally.

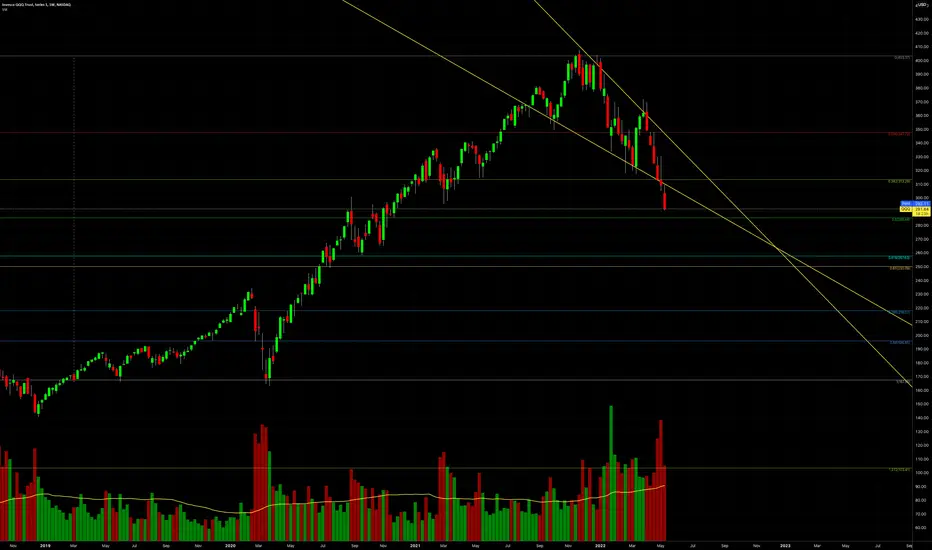
QQQ (Nasdaq ETF) - Weekly - Support, Resistance, TrendlinesQQQ (Nasdaq ETF) - Weekly chart.
Support, Resistance, Trendlines for reference.
05/11/2022.
Nasdaq 100 - The relief rally is in a progressWe continue to be bearish on Nasdaq 100 index. Our view is supported by bearish technical and fundamental factors. The prospect of higher interest rates in the U.S. will continue to put pressure on the economy and drag market indices lower. We expect the rally to be short-lived and Nasdaq to resume its downfall soon. Therefore, we would like to set a new price target for NQ1! to 12 000 USD.
Illustration 1.01
The picture above links our bearish idea on QQQ.
Technical analysis - daily time frame
RSI, MACD, and Stochastic are bearish. The same applies to DM+ and DM-. ADX increases, which signals that the bearish trend is gaining strength. Overall, the daily time frame is bearish.
Illustration 1.02
Illustration 1.02 shows that the weekly volume continues to increase, which is bearish.
Technical analysis - weekly time frame
RSI, MACD, and Stochastic are bearish. The same applies to DM+ and DM-. Overall, the weekly time frame is bearish.
Please feel free to express your ideas and thoughts in the comment section.
DISCLAIMER: This analysis is not intended to encourage any buying or selling of any particular securities. Furthermore, it should not serve as a basis for taking any trade action by an individual investor. Therefore, your own due diligence is highly advised before entering a trade.
