ADAUSDTADAUSDT Signal 📉
📌 Current Price: 0.7161 USDT
📊 Trend: Bearish ⬇️, but testing a descending trendline 📏
🔑 Key Levels:
🔼 Resistance: 0.9209 🛑
🔽 Support: 0.7782–0.8457 🟢
📉 Next Support: 0.6750 ⚠️
📢 Signal:
🔴 Short (Sell): Enter at 0.7161 if price rejects the trendline.
🎯 TP: 0.6750 | 🛑 SL: 0.7500
🟢 Long (Buy): If price breaks above 0.7284, target 0.7782–0.8457.
🎯 TP: 0.7782–0.8457 | 🛑 SL: 0.7000
⚖️ Risk Management: Use 1:2 risk-to-reward ratio. Control risk as highlighted.
🔍 Monitor for a trendline break! 🚨
J-ADA

Can we be optimistic that this will come true?Can we be optimistic that this will come true? If it follows the triangle pattern, the price will rise by $0.80.
Give me some energy !!
✨We spend hours finding potential opportunities and writing useful ideas, we would be happy if you support us.
Best regards CobraVanguard.💚
_ _ _ _ __ _ _ _ _ _ _ _ _ _ _ _ _ _ _ _ _ _ _ _ _ _ _ _ _ _ _ _
✅Thank you, and for more ideas, hit ❤️Like❤️ and 🌟Follow🌟!
⚠️Things can change...
The markets are always changing and even with all these signals, the market changes tend to be strong and fast!!

ADA: Current SituationYou asked, and we delivered:
Cardano (ADA) is currently trading at $0.688, reflecting a volatile yet pivotal moment amid a broader crypto market downturn, with the total market cap down 4.4% over the past 24 hours. Some traders see a falling wedge pattern on the 4-hour chart pointing to a potential breakout, while others note whale activity dumping 100M ADA, suggesting selling pressure. Despite this, ADA’s fundamentals, like its 92M organic transactions and $380M daily DEX volume, hint at underlying strength. The market’s cautious mood, combined with Cardano’s utility-driven ecosystem, sets the stage for a critical juncture.
Technical Indicators and Key Levels
Short-Term (1-Hour and 4-Hour Charts):
Support: $0.65-$0.68 – A key demand zone holding firm so far; $0.53 if selling intensifies.
Resistance: $0.78 – A breakout here could signal bullish momentum; $0.92 as the next target.
Indicators: RSI at ~46 (neutral with upside room), MACD showing bearish momentum. A falling wedge on the 4-hour chart suggests a possible reversal if volume supports a break above $0.78.
Long-Term (Weekly Chart):
Support: $0.60 – A major floor; $0.48 if a deeper correction hits.
Resistance: $1.00 – Psychological and historical barrier; $1.54 as a 2026 target per some forecasts.
Indicators: The 200-day MA is falling, reflecting long-term pressure, but a rising 50-day MA below the price could act as support if tested.
Potential Scenarios
Short-Term:
Bullish Case: If ADA holds $0.68 and breaks $0.78 with strong volume, it could rally to $0.92 or higher. This aligns with the falling wedge breakout narrative from X posts.
Bearish Case: A drop below $0.65 might test $0.53, especially if whale selling persists and volume confirms the move.
Long-Term:
Bullish Case: Holding $0.60 could set up a climb to $1.00 by late 2025, with potential to hit $1.54 in 2026 if adoption grows and market sentiment flips.
Bearish Case: A break below $0.60 risks a slide to $0.48, though fundamentals like network activity could cushion the fall.
Broader Context and Tips
ADA’s strength lies in its research-driven blockchain, scalable PoS consensus, and growing DeFi ecosystem. Long-term, its utility could drive value, but short-term volatility ties to market trends and macro events (e.g., US CPI data). Traders should watch $0.78 for a breakout signal and $0.65 for downside risk, volume will tell the story. Use tight stops (e.g., below $0.65 for longs) and stay alert for news on adoption or whale moves. Investors can lean on Cardano’s fundamentals but should brace for choppiness until the market stabilizes.

USDT.D hinting of a massive cryto market reversal ↑. GET SEEDED!USDT.D an inverse confluence of the crypto market has predicted the major correction before it happened. It has gone parabolic for a few weeks tapping its favorite resistance roof line aT 5.50%.
Now, based on the last weekly close, USDT.D is hinting of a major market reversal to the upside. (USDT.D falling = crypto market rising). It means USDT.D in red means, more cash are being converted to crypto holdings.
The first descending shift line at the upper channel has been registered. First time since September 2024. This is already conveying of a major shift in trend and a weighty series of price growth from here is forthcoming in the next coming weeks.
Best season to get seeded again on the market -- moreso scale in on the bluechip ones, BTC ETH ADA XRP.
It's that season again. A very green one.
Spotted at 5.30%
Mid target at 3.50%.
TAYOR. Trade safely.

ADA Ready for PUMP or what ?The price has formed a Triangle on the daily time frame, and if it breaks out, it can drive the price up to around $1.5 .
Give me some energy !!
✨We spend hours finding potential opportunities and writing useful ideas, we would be happy if you support us.
Best regards CobraVanguard.💚
_ _ _ _ __ _ _ _ _ _ _ _ _ _ _ _ _ _ _ _ _ _ _ _ _ _ _ _ _ _ _ _
✅Thank you, and for more ideas, hit ❤️Like❤️ and 🌟Follow🌟!
⚠️Things can change...
The markets are always changing and even with all these signals, the market changes tend to be strong and fast!!

ADA meets ADAM & EVEBearish outlook for ADA as it has formed an Adam & Eve pattern on the 12 hour view.
If ADA falls below 0.80 for enough time, the retest to below 0.70 will be a likely scenario.
This is a Double Top Adam and Eve trading pattern, potentially showing a trend reversal (its accuracy isn't guaranteed) Usually this is 65% to 75% accurate.

Cardano Update: Short-Term Price Action & Long-Term AnalysisCardano here is revealing a bullish situation. Let's review the basics first.
The correction bottom low came in early February, on the third. Then a higher low happened on the 28th. Good. This higher low was followed by a strong bullish breakout on Trump news. Notice how the retrace remains really strong.
The low 28-Feb reached $0.5803. The low 4-March reached $0.7574. This is 30% higher compared to 28-Feb. Compared to 3-Feb, the most recent low is 51% higher. This reveals a bullish bias.
Even while there is a retrace the action is happening far away from support. This means that buyers are present, bears are weak. Volume. Ok.
Notice the volume. Very low volume on the descent.
Whatever you do, whatever you think will happen next, buy and hold steady, Cryptocurrency will grow. The Altcoins will grow. This chart is bullish and the recent breakout from a falling wedge pattern and current price action proves so.
There is no lower low possible on this chart. There is possibility for a little lower but that is not my guess nor my bet. The best the bears can do is push prices a little bit lower and create a new great entry for us, a great entry because we are going up next.
I think we will see higher prices almost right away. This bearish action is no bearish, I see only a simple retrace, classic reaction after a strong jump. Since this is classic, even more classic is a continuation after a higher low. The continuation will strong because the initial breakout was strong.
One thing to keep in mind though, we are entering a phase of long-term growth. So it will be mixed with some doubts while prices grow.
If in doubt, ever, just zoom-out. The chart is clear. Cardano is set to grow. It will continue growing long-term.
Below is the full long-term analysis including a potential target for a new All-Time High in 2025, this analysis is still valid today:
Thank you for reading.
Namaste.

ADA | UPDATE | Heading for BIG THINGS ??Lace Light Wallet has announced the release of Daedalus 7.1.0 for Cardano, which introduces various security improvements and bug fixes.
This might be particularly important , considering the recent hack on ByBit where billions of dollars worth of ETH was allegedly stolen by the Lazarus group. (More on that, here:)
The price reacted positively briefly to the news, until whales took the opportunity to "sell the news", as we are currently seeing a correction in both the daily and the weekly timeframe:
Ada is likely on par for a further correction, should the current support level not hold. The next zone would be retesting the wick:
It's possible that with these continued improvements, Cardano could be a sleeping giant, waiting for it's moment to shine - in which case, given the functionality is there, the price could easily double from the previous ATH.
_________________ BINANCE:ADAUSDT

Massive Macro Retest: Expecting $1 on ADA, Should Be Bottoming SCRYPTOCAP:ADA has an extremely clean chart, and I think there's a good chance of a move from here after filling the wick and retesting the macro SR flip level.
The current downtrend will expire on March 10th (one of the fastest to expire), so we expect to be a first mover once we see a bounce.
I've bought some here and will continue to add below 60c.
I'm targeting close to $1 and will re-evaluate if it shows greater strength. $CARDANO BINANCE:ADAUSDT

$HOSKY Poised for a 500% Surge Amidst Falling Wedge BreakoutHOSKY Token ($HOSKY) the first dog-themed token built on the Cardano blockchain is poised for a breakout amidst a prolonged steeped falling wedge pattern that has kept the token in suspends for almost 3 months since consolidating on the first week of December last year.
so many patterns hints at a potential bullish reversal one of which is the growing ecosystem of the cardano blockchain. Data from DefiLlama shows a growing volume in the Total Value Locked (TVL) on the Cardano ecosystem with about $442.41 Million locked so far in TVL.
Further validating the bullish thesis is the RSI which is currently at 52 giving $HOSKY more space to capitalize on the 500%. The daily chart pattern shows $HOSKY is trading below key Moving Averages (MA).
HOSKY Token Price Live Data
The live HOSKY Token price today is $1.06e-7 USD with a 24-hour trading volume of $467,937 USD. We update our HOSKY to USD price in real-time. HOSKY Token is up 5.30% in the last 24 hours, with a live market cap of $24,229,480 USD. It has a circulating supply of 227,999,999,999,931 HOSKY coins and a max. supply of 1,000,000,000,000,001 HOSKY coins.

Cardano ADA Is The Best Donald Trump's Coin EverHello, Skyrexians!
We have already made a lot of analysis on BINANCE:ADAUSDT and all of them plays out great, this coin is very technical moving, so we can predict them with the high probability. Donald Trump recently announced that ADA will be in reserve, so we have to understand how it can affect the price action.
Let's take a look at the weekly time frame. You can see that after a green dot on Bullish/Bearish Reversal Bar Indicator the impulsive waves 1 and 3 have been started. In our opinion now the wave 3 is about to continue. Awesome Oscillator has the highest value in this bull run that's why this is can be only wave 3. The targets are very high. Now we can say that they are located between $2 and $3.5 with the final bull run target at $5.
Best regards,
Skyrexio Team
___________________________________________________________
Please, boost this article and subscribe our page if you like analysis!

ADA is on the move!After Trump tweeted about a Crypto Strategic Reserve that includes XRP, SOL, and ADA, the crypto market went wild.
And the best performer from the list? You guessed it—ADA.
ADA has surged over 80%.
What’s next?
- A retest of the $0.84 structure could offer trend-following long opportunities.
- A breakout above the $1.17 range would signal a long-term bullish takeover.
Is ADA gearing up for another explosive move? Stay ahead of the game—follow us for real-time market insights, expert analysis, and the latest crypto trends! 🚀
Disclaimer:
This content is for informational purposes only and should not be considered financial or investment advice. Always do your own research and consult with a professional before making any investment decisions.

Just In: Cardano ($ADA) Broke Out of a Falling Wedge Surge 10% The renown altcoin that is known to move in tandem with CRYPTOCAP:XRP saw a noteworthy uptick in price with the native asset surging 10% amidst breaking out of a falling wedge pattern. With the RSI at 57 are we going to witness a lip to the $1 pivot or beyond?
Presently, CRYPTOCAP:ADA is trading within the trendline of the wedge a small thrust above the resistance could be the catalyst CRYPTOCAP:ADA needs to cement a move to $2.
What Is Cardano (ADA)?
Cardano is a proof-of-stake blockchain platform that says its goal is to allow “changemakers, innovators and visionaries” to bring about positive global change. The open-source project also aims to “redistribute power from unaccountable structures to the margins to individuals” — helping to create a society that is more secure, transparent and fair.
Cardano Price Live Data
The live Cardano price today is $0.936263 USD with a 24-hour trading volume of $5,369,546,196 USD. We update our ADA to USD price in real-time. Cardano is up 8.62% in the last 24 hours. The current CoinMarketCap ranking is #8, with a live market cap of $32,968,087,133 USD. It has a circulating supply of 35,212,423,444 ADA coins and a max. supply of 45,000,000,000 ADA coins.
Cardano 7X Trade-Numbers (1330% Potential)I would love to have a better entry here but better late than never. When in doubt, reduce leverage.
The falling wedge pattern here reveals the end of the correction. The bullish breakout reveals the resumption of the bullish move. A bullish move means higher highs and higher lows.
Cardano is set to grow for months and months and months.
We are going up.
You can find the targets for this chart setup listed below:
_____
ADAUSDT LONG 7X (PP: 1330%)
Targets:
TP1: $1.0114
TP2: $1.1499
TP3: $1.3262
TP4: $1.5207
TP5: $1.6410
TP6: $1.8354
TP7: $2.1502
TP8: $2.6594
Adjust all settings to your own liking.
_____
Good luck. Thank you again for your continued support.
Remember, you deserve the best.
The Cryptocurrency market is healthy, new and young.
Crypto is here to stay.
This is only the beginning.
The best is yet to come.
Namaste.

$ADA: Cardano’s Quiet Climb – Ready to Roar or Still Crawling?(1/9)
Good afternoon, crypto enthusiasts! 🌙 Cardano ( CRYPTOCAP:ADA ): Blockchain’s Steady Eddie – Can It Break Out?
ADA’s chugging along at $0.84, with new dApp launches and partnerships. Is it time to stake or wait for a dip? Let’s dive in! 🔍
(2/9) – PRICE PERFORMANCE 📊
• Recent Trend: Holding at $0.84, up from last month’s peak of $0.82 📉
• 2025 Context: New dApp activity and African expansion driving interest 📏
• Sector Trend: Crypto market recovering from February’s 20.57% crash, but volatility persists 🌟
It’s a steady performer, but can it break out? ⚙️
(3/9) – MARKET POSITION 📈
• Ranking: Top 10 cryptocurrency by market cap, per CoinMarketCap 🏆
• Use Case: Smart contract platform with a focus on scalability and security ⏰
• Trend: Increasing adoption in emerging markets, particularly Africa 🎯
Firm, with a solid foundation and growth potential! 🚀
(4/9) – KEY DEVELOPMENTS 🔑
• Market Reaction: Shares steady, with analysts optimistic about long-term growth 📋
Cookin’ up something big, but the market’s cautious! 💡
(5/9) – RISKS IN FOCUS ⚡
• Competition: Ethereum and Solana offer stiff competition with more established ecosystems 🕳️
• Regulatory: Crypto regulations could impact adoption and growth ⚖️
• Volatility: Crypto market’s unpredictable swings can hit hard ❄️
Tread carefully, but the path looks promising! 🛑
(6/9) – SWOT: STRENGTHS 💪
• Scalability: Hydra and other upgrades promise high throughput and low fees 📊
• Community: Strong, academic-driven community with a focus on long-term development 🥇
• Partnerships: Growing presence in emerging markets, especially Africa 🌍
Got the building blocks for success! 🏦
(7/9) – SWOT: WEAKNESSES & OPPORTUNITIES ⚖️
• Weaknesses: Slower adoption compared to competitors, limited dApp activity 📉
• Opportunities: Expanding into new markets, new dApp developments, and regulatory clarity in some regions 📈
Can it catch up and surpass? 🤔
(8/9) –📢ADA’s at $0.45, with mixed market signals—your take? 🗳️
• Bullish: $1 soon, fundamentals are strong 🐂
• Neutral: Steady, wait for clearer skies ⚖️
• Bearish: Under $0.30, competition’s too fierce 🐻
Vote below! 👇
(9/9) – FINAL TAKEAWAY 🎯
ADA’s holding its ground at $0.83, with promising developments but market headwinds. Volatility’s our friend—dips are DCA gold 💰. Grab ‘em low, ride high! Gem or bust?

Cardano Ultra-Bullish With 100% Growth Within 2 DaysThere you have it my dear friends... I told you that the low was in and this is confirmed now, without a shadow of doubt, based on current price action.
The low happened in early February 2025. Boom! And we win.
Told ya! Over and over, again and again.
And this is awesome and great news, why?
Because it means we are on, we are bullish, we are super bullish and we are set to experience the biggest growth ever... "March 2025 and beyond."
Trading volume is really high today which confirms that this is a real move.
All the bears are very likely going crazy right now and that's ok, and it is normal because the market is breaking out with the biggest force ever, period.
Pay attention to the Master of the charts, because we are going up.
Crypto is going up.
Bitcoin is going up.
Cardano is going up.
The Cryptocurrency market is set to experience the biggest growth phase since 2021.
Thanks a lot for your continued support.
If you trusted and followed, I am sure you are doing great.
If you were bearish, I feel sorry for you... Not! Get in line, get in now and prepare for massive growth, it is not too late.
Namaste.

Trump’s crypto picks struggle: Saylor sees $200T market cap Bitcoin has fallen below the 78.6% retracement of Sunday’s surge and is now less than 2K above the level it was at when Trump tweeted about a strategic reserve including Bitcoin and a few altcoins.
Some of the smaller cryptocurrencies mentioned by Trump—Cardano, Solana, and Ripple—are holding up slightly better but have also dropped.
Strategy Executive Chairman Michael Saylor, whose company holds nearly 500,000 BTC, strongly endorsed Trump’s proposed strategic crypto reserve in a CNBC interview. Saylor also predicted Bitcoin’s market cap could reach $20 trillion and eventually $200 trillion, projecting a price of $13 million per BTC by 2045. In a bullish scenario, he sees Bitcoin hitting $49 million, while a bearish case could still put it at $3 million.

Cardano Update: Bullish MA200 Daily Long-Term & Short-TermLet's have a closer look at Cardano, ADAUSDT; look at the volume, what do you see?
It is not only yesterday's rise that is out of proportion with the rest of the days, early February and mid-November 2024 are also mainly green. Really high volume, always on green days. Notice how low the volume bars are on bearish (red) days.
After a strong bullish breakout, a reactive move, there is always a retrace. This retrace should be short-term and short-lived. That is, prices move lower shortly before additional growth. Whatever happens, this retrace will always end as a higher low compared to the start of the bullish jump. This means that Cardano is going up. Going up long-term and set to continue to grow on the short-term. But the market never moves straight up in a signal week, month or day.
If an advance is set to last only 30 days, we can definitely see a parabolic rise but, for this to happen, we would have a strong and long consolidation phase preceding the move. The best example is recent, late 2024. Consolidation happened between August and October 2024 and then a massive jump. All those months building up momentum and then a move with massive force developed. Now it is different because we won't see a simple bullish jump, we are set to experience long-term growth. Say Cardano grows for 8 months or more, until late 2024. Consider a new All-Time High around November 2025. Can be sooner or can be a bit later but here we are developing a map.
The important point is to focus on the long-term. Ignore the noise, ignore the short-term. The best example is Bitcoin, it was weak and bearish for six days, all loses were recovered in a matter of hours. This is how a volatile and young market behaves. Prepare for more.
Cardano is good. The chart reveals a bullish bias and the price is nice and strong. MA200 daily worked as support and yesterday's breakout recover EMA55, the action is happening above. A break and close above EMA55 confirms growth potential mid-term. The trading above MA200 daily means that it is confirmed, we are bullish on the long-term.
The bullish bias was confirmed in November 2024. The recent drop was a test of a resistance level turned support. The test was a success, MA200 holds. With this confirmation done and over, we are green and up we go.
Namaste.

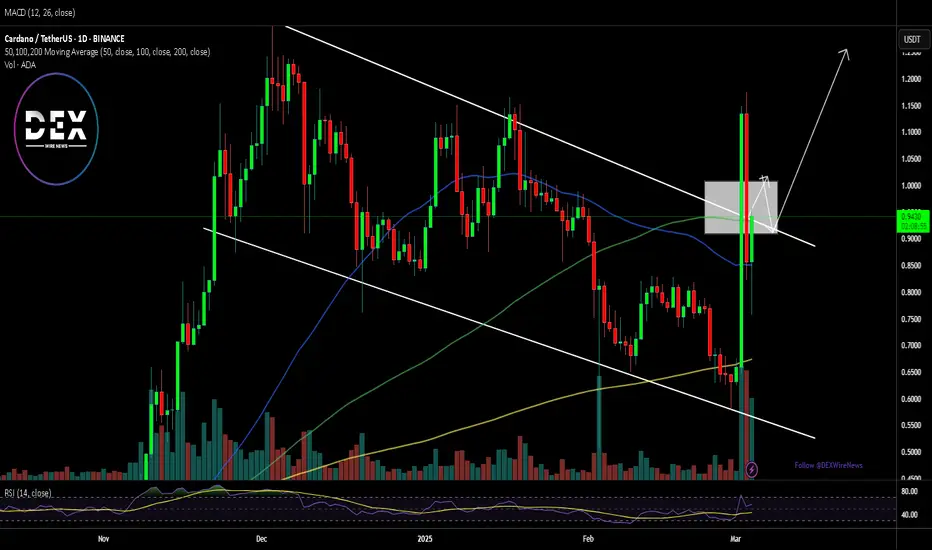
ADA/USDT at Decision Point – Major Move Incoming!ADA/USDT is testing a major resistance zone after retesting the 100 EMA and bouncing from the rising support line. The price remains in a long-term symmetrical triangle, with the resistance trendline as a key breakout level.
The Stochastic RSI is recovering from oversold levels, indicating potential bullish momentum. A breakout above resistance could trigger a strong uptrend continuation, while rejection may lead to a pullback toward support.

ADAUSDT Breakout Incoming or Another Fakeout?Yello, Paradisers! Are we about to see ADAUSDT explode, or is this just another trap for impatient traders? Let’s break it down!
💎ADAUSDT is looking solid after completing a proper double zig-zag corrective phase. The key to confirming the next move lies in breaking and closing a candle above the resistance level. If this happens, it significantly increases the probability of a bullish breakout. Why? Because ADA is still trading in the discount range of a descending channel, and we’re also seeing bullish divergence—a strong confluence signal for upside momentum.
💎However, if ADA pulls back or retraces further, the smartest play is to wait for inducement. Ideally, we want to see bullish structures form, such as a bullish I-CHoCH or well-known bullish patterns like a W formation or inverse head and shoulders on lower timeframes. If those confirmations appear, the probability of a bullish move shifts in our favor.
💎On the flip side, if ADA falls sharply or closes a candle below the support zone, it would invalidate our bullish scenario. This would likely extend the corrective wave into a deeper structure, signaling that it’s best to stay patient and wait for clearer price action.
🎖 Bottom line? The market is setting up for a major move—either a powerful breakout or a deeper retracement. Only those who wait for the right confirmations will come out on top. Stay disciplined, Paradisers! 🚀
MyCryptoParadise
iFeel the success🌴

Bitcoin - Bitcoin, waiting for another decline?!Bitcoin is located between the EMA50 and EMA200 on the four-hour timeframe and is trading in its descending channel. Bitcoin's downward correction and its placement in the demand zone will provide us with the opportunity to buy it again. It should be noted that there is a possibility of heavy fluctuations and shadows due to the movement of whales in the market and compliance with capital management in the cryptocurrency market will be more important. If the downward trend continues, we can buy in the demand range.
Donald Trump has issued an executive order on digital assets, directing the Presidential Task Force to move toward establishing a strategic cryptocurrency reserve that will include XRP, SOL, and ADA. He emphasized, “I will ensure that the United States becomes the cryptocurrency capital of the world.” Trump further added, “We are making America great again!”
He also highlighted Bitcoin and Ethereum as other valuable digital assets that will be central to this reserve, stating, “I love Bitcoin and Ethereum!” Following this announcement, Bitcoin responded positively to the news of the executive order.
On February 28, BlackRock made headlines after Bitcoin (BTC) dropped below $80,000. Amid speculation, some claimed that the company had sold $500 million worth of Bitcoin, playing a significant role in the price decline.
However, a closer analysis contradicts these claims. Data shows that BlackRock’s iShares Bitcoin Trust (IBIT) still holds 577,919 BTC. While this fund saw an outflow of 2,274 BTC on February 27 and a total of 10,595 BTC over the past week, this does not imply that BlackRock itself is selling Bitcoin.
These ETF outflows result from investors selling shares of the fund. In such scenarios, the ETF is required to sell Bitcoin proportionally to meet liquidity demands. Therefore, these movements are not directly tied to BlackRock’s own decision to offload BTC but rather reflect investor behavior.
Contrary to circulating rumors, BlackRock is not exiting Bitcoin; in fact, it has been increasing its exposure. Recent financial filings reveal that the company now holds a 5% stake in MicroStrategy (MSTR), up from 4.09% in September 2024.
Additionally, it has been announced that BlackRock plans to integrate its Bitcoin ETF into the firm’s $150 billion portfolio. This move suggests that rather than pulling out of the market, BlackRock is strengthening its position in Bitcoin-related assets.
Ultimately, this situation highlights how quickly rumors and speculation can spread during market downturns, but a detailed analysis of the data always provides a clearer picture of reality.
Meanwhile, Ronaldinho, the former Brazilian football star, has announced plans to launch his own cryptocurrency. He also warned his fans to stay vigilant against fraudulent meme coins.

Cardano Long-Term: Crypto Strategic ReserveCardano grew by 18,352% between March 2020 and August 2021. The highest volume came in on the third wave and we ended with a truncated five.
Seeing this performance in the last bull-market, we can aim high. Instead of being too conservative and making the same mistake as always, aiming too low, let's aim higher because we know that Cryptocurrency has huge potential, it is new and young.
From current price to $10.5 we are looking at ~895% potential. From the August 2024 bottom to the same target we have some 3,770%. I think that with the current size Cardano has now such total growth might be reasonable, but the market is not reasonable. We don't know the meaning of a "Crypto Strategic Reserve." We don't know what it means, in turns of prices and numbers, many nations buying Crypto. We can end up with a bull-market that is hundreds of times stronger than anything we've seen before. In this case, all projections would breakdown and prices would go off the chart. I hope this happens.
Since we cannot predict the unpredictable nor calculate based on assumptions, let's go with what we have. What is the chart saying, what are the potential targets and how will the bull-market unravel. We want answers to those questions.
The targets are the ones seen on the chart.
The minimum target for a new ATH based on conservative and standard calculations would equal $4.86. Short-term targets that will be hit within the next three months go as follows: $1.33, $1.66, $1.83, $2.00, $2.22, $2.66 & $3.49.
A strong target and projection sits at $7.77 and a $10.58 is the next All-Time High if we have a great bull-market based on standard projections. The ultra-bullish scenarios we welcome and enjoy them if they show up but they are beyond this chart.
The main support range after the Trump Pump sits between $0.9116 and $1.0094. If it goes lower, we have $0.8138 but I don't think lower is possible. This is for support if the market decides to shake. Remember, it is a long bull-market so there will be plenty of time for volatility to show up. Whatever happens, remember the bigger picture; we are going up.
I always liked Cardano and I share many analysis and many charts so it is great to see that we have Trump's support. Our future is bright. If we are smart, we buy and we hold.
Don't just think about next year or next month, consider 10 years into the future, maybe even 20 years... Think of the big tech companies. One can become rich with one project, one coin. Just as the old people from the 70s and 80s. We are approaching the bull-market of a new generation. No limits now, no barriers, no filters; everybody can join.
Cryptocurrency, the stock market for the people.
Thanks a lot for your continued support.
Namaste.

Important support and resistance zone: 1.0302 ~ 1.2214
Hello, traders.
If you "Follow", you can always get new information quickly.
Please click "Boost".
Have a nice day today.
-------------------------------------
(ADAUSDT 1W chart)
The key is whether it can receive support at the important support and resistance zone and rise to around 1.3678.
If not, whether it can support around 0.8836 is important.
-
(1D chart)
The key is whether it can be supported in the Fibonacci ratio range of 0.5(1.0302) ~ 0.618(1.2214).
If not, whether it can be supported in the vicinity of 0.8451-0.8836 is important.
The reason is that the price must be maintained above the M-Signal indicator on the 1D, 1W, and 1M charts to continue the uptrend.
-
Thank you for reading to the end.
I hope you have a successful trade.
--------------------------------------------------
- Big picture
I used TradingView's INDEX chart to check the entire range of BTC.
(BTCUSD 12M chart)
Looking at the big picture, it seems to have been following a pattern since 2015.
In other words, it is a pattern that maintains a 3-year bull market and faces a 1-year bear market.
Accordingly, the bull market is expected to continue until 2025.
-
(LOG chart)
Looking at the LOG chart, we can see that the increase is decreasing.
Accordingly, the 46K-48K range is expected to be a very important support and resistance range from a long-term perspective.
Therefore, we do not expect to see prices below 44K-48K in the future.
-
The Fibonacci ratio on the left is the Fibonacci ratio of the uptrend that started in 2015.
That is, the Fibonacci ratio of the first wave of the uptrend.
The Fibonacci ratio on the right is the Fibonacci ratio of the uptrend that started in 2019.
Therefore, this Fibonacci ratio is expected to be used until 2026.
-
No matter what anyone says, the chart has already been created and is already moving.
It is up to you how to view and respond to it.
Since there is no support or resistance point when the ATH is updated, the Fibonacci ratio can be appropriately utilized.
However, although the Fibonacci ratio is useful for chart analysis, it is ambiguous to use it as a support and resistance role.
The reason is that the user must directly select the important selection points required to create the Fibonacci.
Therefore, it can be useful for chart analysis because it is expressed differently depending on how the user specifies the selection point, but it can be seen as ambiguous for use in trading strategies.
1st: 44234.54
2nd: 61383.23
3rd: 89126.41
101875.70-106275.10 (when overshooting)
4th: 134018.28
151166.97-157451.83 (when overshooting)
5th: 178910.15
-----------------
