Public trade #24 - #ADA price analysis ( Cardano )CRYPTOCAP:ADA price was drained quite a bit on 03/02/25, but today it shows one of the best rates of buyback (of course, among the “old” coins with a large market cap)
Let's try to bribe to ourselves with #Cardano
The approximate trade for the investment portfolio is shown on the chart, and also we will take #ADA in copytrading as the price moves, depending on the dynamics.
Do you believe that the price of OKX:ADAUSDT will reach $5.60-6.50 in this 2025 growth cycle?
_____________________
Did you like our analysis? Leave a comment, like, and follow to get more
J-ADA

$ADA Surges 15% Amid Grayscale’s Groundbreaking ETF ProposalCardano ( CRYPTOCAP:ADA ), the ninth-largest cryptocurrency by market cap, is making headlines once again. This time, it’s not just about its innovative blockchain technology or its proof-of-stake consensus mechanism—it’s about a potential game-changer in the world of traditional finance. Grayscale Investments, the powerhouse behind the first Bitcoin ETF, has proposed a first-ever Cardano ETF for listing on the New York Stock Exchange (NYSE). This announcement sent CRYPTOCAP:ADA soaring by 15%, with its price hitting $0.7953 and its market cap climbing to $27.99 billion. But what does this mean for Cardano, and why is this development so significant? Let’s break it down.
Grayscale’s Cardano ETF Proposal
Grayscale’s filing for a Cardano ETF marks a pivotal moment for the cryptocurrency. Unlike its previous ETF filings for Solana and XRP, which involved converting existing trusts into ETFs, the Cardano ETF is a brand-new offering. If approved, the Grayscale Cardano Trust (ticker: GADA) would allow traditional investors to gain exposure to ADA without the complexities of managing private keys or navigating crypto exchanges. Coinbase Custody would serve as the custodian, while BNY Mellon would handle administrative tasks.
This move is particularly significant for Cardano, which has often been overshadowed by Bitcoin and Ethereum in the ETF conversation. While Bitcoin and Ethereum ETFs have dominated discussions, Cardano’s inclusion signals growing institutional interest in altcoins. However, regulatory hurdles remain. The SEC has previously classified ADA as a security in its lawsuits against Binance and Coinbase, which could complicate approval.
Technical Analysis
From a technical standpoint, Cardano is showing strong signs of a bullish reversal. Here’s what the charts are saying:
1. Price Action and RSI:
Despite the 15% surge, Cardano’s Relative Strength Index (RSI) sits at 46, indicating that the asset is not overbought. This suggests there’s still room for upward movement before hitting resistance levels. The lack of overbought conditions is a bullish signal, as it implies sustained buying pressure.
2. Fibonacci Levels:
In the event of a market pullback, the 78.6% Fibonacci retracement level serves as a strong support zone. This level has historically acted as a springboard for price recoveries, making it a critical area to watch.
3. Breakout Potential:
A breakout above the 1-month high pivot point could trigger a sustained bullish streak, potentially propelling ADA toward the psychologically significant $1.5 mark.
4. Volume Surge:
Trading volume for ADA spiked by 51% to $1.16 billion, reflecting heightened market activity and investor interest. Increased volume during a price surge is a strong confirmation of bullish momentum.
Why This Matters for Cardano and the Crypto Market
Grayscale’s Cardano ETF proposal is more than just a win for ADA holders—it’s a milestone for the broader cryptocurrency market. Here’s why:
1. Institutional Adoption:
An ETF would open the doors for institutional investors who have been hesitant to dive into the crypto space due to regulatory and custodial concerns. This could bring significant capital inflows into Cardano.
2. Regulatory Clarity:
While the SEC’s stance on ADA remains uncertain, Grayscale’s filing could push regulators to provide clearer guidelines on altcoin classification. This would benefit the entire crypto ecosystem.
3. Market Sentiment:
The mere announcement of a Cardano ETF has already boosted market sentiment, as evidenced by the 15% price surge. Approval could further solidify Cardano’s position as a top-tier blockchain project.
4. Altcoin ETF Landscape
If approved, the Cardano ETF could pave the way for similar products targeting other altcoins, expanding the reach of digital assets in traditional finance.
Conclusion
Cadano’s 15% surge following Grayscale’s ETF proposal underscores the growing institutional interest in the project. With strong technical indicators pointing to further upside and a groundbreaking ETF filing that could reshape the altcoin landscape, CRYPTOCAP:ADA is poised for a potential breakout. While regulatory challenges remain, the proposal marks a significant step toward mainstream adoption.

ADA Buy📊 ADAUSDT Signal Analysis
📆 Timeframe: 4H
🏛️ Exchange: Binance
🔍 Market Overview:
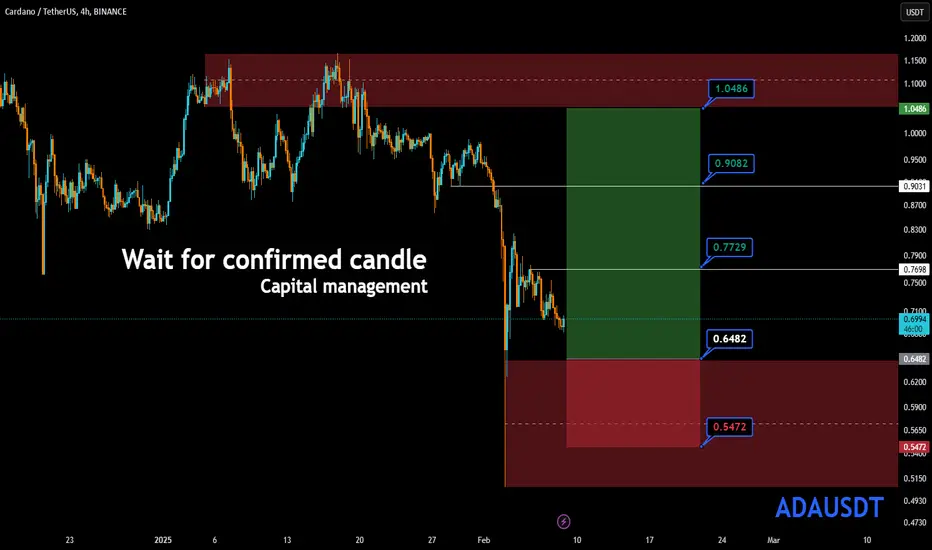
🔸 The current price of ADA is around 0.6988 USDT.
🔸 A recent downtrend has pushed the price lower, bringing it close to a key support level.
🔸 If the price reacts positively, a potential uptrend could begin.
📉 Technical Analysis:
🔹 Key Support Level: 🟢 0.6482 USDT
🔹 Key Resistance Levels: 🔵 0.7729 USDT, 🔵 0.9082 USDT, 🔵 1.0486 USDT
🔹 Stop Loss: 🔴 0.5472 USDT
🔹 Capital Management: 📌 Enter the trade only after a confirmed bullish candle.
📌 Entry Strategy:
✅ If the price reacts positively around 0.6482 USDT, a long position can be considered after a confirmed bullish candle.
🎯 Target Levels:
1️⃣ 0.7729 USDT
2️⃣ 0.9082 USDT
3️⃣ 1.0486 USDT
❌ Stop Loss: If the price breaks below 0.6482 USDT and reaches 0.5472 USDT, the trade should be closed.
🔔 Important Note: A confirmed bullish candle is essential before entering to ensure a strong reversal.
⚠️ Conclusion:
📌 This analysis is based on technical data and should be used alongside other strategies and proper risk management.
ADA with a series of 1-2Cardano's ADA continues to maintain its structure, as long as it stays above the first invalidation level, preserving the current degree wave 1-2. I anticipate a strong bullish continuation due to the long price history and strong community backing.

Cardano (ADA): Sharp Selling Pressure!Cardano seems to head toward the major support zone (which, on bigger timeframes, acts as an important neckline).
We are aiming to see the price reach $0.82 zones where we might see some fight between buyers and sellers.
Either way, it will be early to call a further move from there but we would want to see a break of it, which would stabilize the coin properly and give a better chance for healthy bullish movement!
Swallow Team

XAUUSD ANALYS#XAUUSD ANALYS
####### This analysis was loaded with the correct wavenumber. ######
With this wave count, we can say that here, by hunting liquidity, $2950 will move towards $2700 to complete micro-wave C of wave 4.
I hope this analysis has helped you.
Share this analysis with your friends.
The analysis was done by Mr. Khosravi.
Signature
KHOSRAVI.E.W

Name Your Cryptos ! I’ll Analyze the Most Voted Picks!Tell me the coin name, and I'll analyze it for you!

Be careful with CARDANO !!!The price can experience significant growth now and go up to 89 cents and then up to 1 dollar. Also, positive divergence in MACD can be one of the signs.
Give me some energy !!
✨We spend hours finding potential opportunities and writing useful ideas, we would be happy if you support us.
Best regards CobraVanguard.💚
_ _ _ _ __ _ _ _ _ _ _ _ _ _ _ _ _ _ _ _ _ _ _ _ _ _ _ _ _ _ _ _
✅Thank you, and for more ideas, hit ❤️Like❤️ and 🌟Follow🌟!
⚠️Things can change...
The markets are always changing and even with all these signals, the market changes tend to be strong and fast!!

another look at my previous chart....ALTERNATE CRYPTOVERSEAda is bouncing well after the dumpster fire that happened over the weekend....
currently ADA is forming an ascending wedge...(bearish)
i am expecting a rejection at $.857 area...if the ascending wedge doesn't breakdown i think we can expect price to find a bottom in this trend support.....with support being around $.803
if that breaks down you can look for supports in the $.7665 level...
next support at .668
Lets GO!!!! ill be buying at $.58-$.53 or the break of $.857
Remember to always conserve capital....if you don't protect your money you won't be around long...before enter a trade always come up with a trade plan... figure out why you are getting into the position....what would casue you to exit at a lose? how far are you willing to allow drawdown? Where are you taking profits... or where are you putting a trailing stop? and then keep the discipling and stick to the plan...
Don't limit your runners and expose yourself to unlimited gains by not using a stop loss and just putting a sell order...be wise... use a stop loss, buy the bottom(or take a 2.5% loss and try again) and then once you are in profit and cleared network and transaction fees... put a stop loss... and always
Use Best Trading Practices and STICK TO YOUR PLAN
#LFGold

ADA/USDT RECOVERY TIMEADA/USDT RECOVERY TIME
There is good chance that Ada/usdt will return to up 1 USD level

𝐀𝐃𝐀 → 𝐁𝐮𝐥𝐥𝐢𝐬𝐡 𝐏𝐫𝐞𝐬𝐬𝐮𝐫𝐞 !!!Buy at 89 cents and sell at 1 dollar. This signal is only valid for 2 days.
Give me some energy !!
✨We spend hours finding potential opportunities and writing useful ideas, we would be happy if you support us.
Best regards CobraVanguard.💚
_ _ _ _ __ _ _ _ _ _ _ _ _ _ _ _ _ _ _ _ _ _ _ _ _ _ _ _ _ _ _ _
✅Thank you, and for more ideas, hit ❤️Like❤️ and 🌟Follow🌟!
❗Disclaimer
⚠️Things can change...
The markets are always changing and even with all these signals, the market changes tend to be strong and fast!!

ADA - Time to buy again!I think this price level has good support, and from here the price can grow well.
Give me some energy !!
✨We spend hours finding potential opportunities and writing useful ideas, we would be happy if you support us.
Best regards CobraVanguard.💚
_ _ _ _ __ _ _ _ _ _ _ _ _ _ _ _ _ _ _ _ _ _ _ _ _ _ _ _ _ _ _ _
✅Thank you, and for more ideas, hit ❤️Like❤️ and 🌟Follow🌟!
⚠️Things can change...
The markets are always changing and even with all these signals, the market changes tend to be strong and fast!!

ADA - Time to buy again!The price is in an ascending triangle, which could push the price up to the triangle's ceiling. Since this market has a habit of deceiving traders, it is possible that the triangle will break from below and then reach the triangle's ceiling.
Give me some energy !!
✨We spend hours finding potential opportunities and writing useful ideas, we would be happy if you support us.
Best regards CobraVanguard.💚
_ _ _ _ __ _ _ _ _ _ _ _ _ _ _ _ _ _ _ _ _ _ _ _ _ _ _ _ _ _ _ _
✅Thank you, and for more ideas, hit ❤️Like❤️ and 🌟Follow🌟!
⚠️Things can change...
The markets are always changing and even with all these signals, the market changes tend to be strong and fast!!

Cardano's Bullish IdeaAs long as ADA is above $0.77 and $0.32 a bull-run is expected to target a new all-time high.

ADA to $1.78 as a final push?It appears that ADA has completed its wave 4 triangle correction and is now poised to target the 1.618 Fibonacci extension, a common projection for wave 5, with a price target of $1.78 .
Following the completion of this impulsive wave, a significant correction or pullback is likely, presenting an excellent opportunity for strategic positioning from a macro perspective.

Cardano analysis: Is it a buying opportunity?hello friends
Considering the good rise we had, now this coin has formed a channel for us, in case of failure, we can enter into a purchase transaction with capital management...
*Trade safely with us*

Skyrexio | Cardano ADA Will Drop Before AltseasonHello, Skyrexians!
We have already observed BINANCE:ADAUSDT recently, now it's time update it. This is one of the strongest assets in this bull run. While most of altcoins are trying to escape the water, Cardano is already in the sky. Moreover correction is not so strong for this crypto.
On the daily time frame we can see the first impulse as a wave 2. Recently we supposed that corrective wave 2 has been already finished with this beautiful green dot on the Bullish/Bearish Reversal Bar Indicator inside the 0.5 Fibonacci zone, but growth from the bottom was not impulsive. This behavior gives us a hint that this is only wave B in the flat correction.
If our assumption is right wave C shall retest the wave A bottom. The green dot on this indicator is going to become the great re-entry opportunity if you still don't have a position for ADA. The next wave 3 is going to be insane, targets you can find in our previous analysis.
Best regards,
Skyrexio Team
___________________________________________________________
Please, boost this article and subscribe our page if you like analysis!

ADA | ALTS | Good Buy or WEAKNESS?ADA is one of a few altcoins that have not yet made a new ATH, or trading close to its previous ATH.
Considering Cardano is one of the "older" crypto's , you'd expect it to behave like the rest of the titans. But instead, when overlayed with the Solana chart we see a disappointing comparison:
Regardless of this, ADA trades in a range within a fairly reasonable timeframe, meaning it is ideal for short term profits (range trading). ADA can easily do + or - 30% in two weeks, ideal for swing traders.
_________________________
BINANCE:ADAUSDT

ADAUSDT: Ranging within flag until Trump InaugurationI predict the price to range within this flag until we hit the vertical line, January 20th. One would presume a big move on this day, as Trump will be inaugurated. It's possible we continue to range within the flag afterwards, but I think a big move will happen on or very near January 20th.
Cardano (like almost all crypto) is heavily pegged to the price of Bitcoin and almost always moves in the same direction. However, it looks like Cardano is attempting to de-couple from BTC with some success. The more this continues, the more likely we are to see large bullish moves in the price. If $1.20 breaks with high volume, expect a big move up to at least $1.50.
Not trading advice. I'm a noob, first idea.

ADAUSD: Last consolidation before 5.50.Cardano is neutral on its 1D technical outlook (RSI = 48.919, MACD = 0.005, ADX = 18.468) as it is trading around its 1D MA50. Basically it is consolidating since December 7th following November's incredible rally. The pump stopped on the HH trendline, which is holding for 2 years, since basically the bottom of the Bear Cycle. This is no different than the consolidation of December 2020, which was also around the 1D MA50, above the 1D MA200 and below the HH trendline.
Once this breaks, we espect a rally of similar proportions to November (TP = 5.500).
## If you like our free content follow our profile to get more daily ideas. ##
## Comments and likes are greatly appreciated. ##

Will Cardano Finally Break Free? Key Levels to Watch Right Now!Yello, Paradisers! Are #ADA bulls about to reclaim their dominance? Let’s break it all down because #Cardano is approaching a critical moment you cannot afford to miss!
💎Cardano has been consolidating after a massive rally, but here’s the kicker—it’s now forming an ascending triangle. If this bullish formation plays out, ADA could finally break out of its range and reignite its upward momentum.
💎ADA faces a pivotal challenge at the $1.15–$1.20 resistance region. This area has been a brick wall for ADA’s upside potential since December 9th. This zone isn’t just horizontal resistance—it’s also reinforced by the 0.618 Fibonacci retracement level, making it a major decision point for the bulls.
💎For ADA to reignite its hyper-bullish phase, the bulls must decisively break and hold above the $1.15–$1.20 region, which remains a significant roadblock. If they succeed in flipping this zone into support, the price is likely to target the 52-week high at $1.327 as the first major milestone. Beyond this, the upside target extends further, stretching toward the $1.38 level.
💎On the downside, there’s solid ascending support between $0.93–$0.918, which the bulls have been defending consistently for weeks. As long as this level holds, the bullish structure remains intact. However, if this support breaks, the horizontal support at $0.865–$0.85 comes into play as the next line of defense.
Trade smart, Paradisers! Stay focused, and don’t chase the market.
MyCryptoParadise
iFeel the success🌴

Cardano (ADA) Analysis: Rebounding from Key Support Zonehello guys!
The Cardano (ADA) chart reflects a corrective move approaching a critical support level. The price appears to be reacting to a combination of horizontal and trendline support, signaling a potential reversal for bullish continuation.
__________________________
what I see:
Support Zone Interaction: The price is approaching a highlighted support zone near $0.92-$0.95, marked by a horizontal demand area. This region aligns with an upward-sloping trendline, strengthening its significance.
Potential Rebound: A strong bounce from this confluence zone could lead to a bullish reversal, pushing ADA back toward its recent highs near $1.10.
Bullish Continuation: If the price holds above the support zone and the ascending trendline, it could signal a continuation of the broader uptrend. The next key resistance zone lies near $1.10-$1.15.
Risk of Breakdown: A decisive breakdown below the $0.92 support and the ascending trendline could invalidate the bullish scenario, opening the way for further downside toward $0.85 or lower.
__________________________
Strategy for Traders:
Bullish Scenario: Look for a reversal candlestick pattern or strong volume near the support zone to confirm a rebound. Potential targets include $1.00 and $1.10.
Bearish Scenario: If the price breaks below the trendline and support zone, traders might consider short positions targeting $0.85 and beyond.
Monitoring the price action around the support zone will be key to identifying the next significant move.

ADA EOY targetsHello Tradingview community!
As always: If these patterns I'm showcasing doesn't work as predicted..
then please don't come crying to me (ty) -> NFA DYOR
The chart explains it all pretty much..
From my own TA perspective, it seems that BINANCE:ADAUSDT could be
at around 0.60 - 0.80 cents EOY and potentially even the 1 dollar mark.
What about downside? Well if Bitcoin takes a massive dump
then ADA could hit the 0.25 - 0.31 zone (i find it unlikely)
Even though I'm clearly more bullish than bearish
I still ALWAYS consider downside while being it.
Just an idea, BOOST if you like it and follow for more!
NFA DYOR <<<<------
