ADA EOY targetsHello Tradingview community!
As always: If these patterns I'm showcasing doesn't work as predicted..
then please don't come crying to me (ty) -> NFA DYOR
The chart explains it all pretty much..
From my own TA perspective, it seems that BINANCE:ADAUSDT could be
at around 0.60 - 0.80 cents EOY and potentially even the 1 dollar mark.
What about downside? Well if Bitcoin takes a massive dump
then ADA could hit the 0.25 - 0.31 zone (i find it unlikely)
Even though I'm clearly more bullish than bearish
I still ALWAYS consider downside while being it.
Just an idea, BOOST if you like it and follow for more!
NFA DYOR <<<<------
J-ADA

ADA - Time to buy again!As you can see, the price is forming two bullish patterns on the DAILY timeframe, If my view is correct, Cardano will rise to $1.45 .
And if this pattern is correct and breaks, higher targets are possible.
Give me some energy !!
✨We spend hours finding potential opportunities and writing useful ideas, we would be happy if you support us.
Best regards CobraVanguard.💚
_ _ _ _ __ _ _ _ _ _ _ _ _ _ _ _ _ _ _ _ _ _ _ _ _ _ _ _ _ _ _ _
✅Thank you, and for more ideas, hit ❤️Like❤️ and 🌟Follow🌟!
⚠️Things can change...
The markets are always changing and even with all these signals, the market changes tend to be strong and fast!!

ADA/USDT CHART UPDATE !!ADA/USDT 4-hour chart shows a bullish continuation pattern as Cardano prepares for a potential breakout after a period of consolidation.
The price is making higher lows, indicated by the rising trendline.
Resistance lies at $1.20, which aligns with the upper boundary of the triangle.
Support: $0.80–$0.90 (green area and trendline).
Resistance: $1.20 (key breakout level).
The 21-day MA and 100-day MA are sloping upwards, indicating bullish momentum.
The price is currently above both MAs, which provide additional support.
If ADA breaks above $1.20, it could head towards $1.50 or higher.
However, a breakdown below the rising trendline could lead to a retest of $0.80.
This setup suggests that ADA is gaining strength, with bullish continuation likely on the breakout.
If you found this analysis helpful, hit the Like button and share your thoughts or questions in the comments below. Your feedback matters!
Thanks for your support!
DYOR. NFA

ADA on the Verge of a Bullish Breakout: Key Levels to Watch❓ What’s the secret to capturing long-term growth in the crypto market? For many traders, it's about recognizing key moments in the market and aligning their strategies accordingly. Today, we’re going to dive into one of the most popular altcoins: Cardano (ADA) . With a sharp recovery recently, ADA is showing signs of a potential trend reversal. I’m Skeptic , and together, we’ll explore how to identify key triggers for buying or selling in this market.
🔮 Strategies and Tools
Daily Timeframe Analysis
After a strong rally, ADA has entered a corrective phase, retracing after an impressive 300% surge. Recently, however, we’ve seen a new bullish momentum forming, potentially pushing ADA past significant resistance at $1.3256. This would signal a continuation of the primary uptrend.
Key Levels:
Support Zone: $0.75
Resistance Zone: $1.3256
Trading Strategy:
Look for a breakout above $1.24 (a key level) for confirmation of the upward momentum.
Watch Bitcoin and USDT.D for additional confirmation—these can influence ADA’s movement significantly. If Bitcoin’s RSI breaks above 62.64, we could see further confirmation.
📈 4-Hour Timeframe Analysis
In the shorter time frame, ADA has formed a descending corrective channel, but has now broken out and is retesting the previous resistance at $1.1427. This could potentially be an ideal spot for a long position if the price breaks above this resistance.
Key Indicators:
RSI: Approaching overbought levels at 70. This signals the potential for a breakout.
SMA7: Shows strong upward momentum, further confirming bullish pressure.
Trade Setup:
Consider entering a long position once resistance at $1.1427 is broken.
Stop-Loss: Place a safe stop-loss below recent support levels.
Caution: Avoid shorts for now; wait for the price to establish a new range and trend direction.
📊ADA is presenting an exciting opportunity, but it’s important to wait for the right trigger points. Whether you're trading the breakout or waiting for confirmation, patience and discipline are key.
Which stage are you at in your trading journey? Are you practicing patience, or are you jumping in at the first sign of a rally? Share your thoughts in the comments!
I’m Skeptic , and I’m here to simplify trading, one step at a time. Let’s keep growing together! Don't forget to stay disciplined in your risk management :) 🤍

Cardano on the Edge: Breakout AlertADA is currently trading within a symmetrical triangle, a pattern that typically signals market indecision. The price is tightening as it moves between an upward-sloping support line and a downward-sloping resistance line. Currently the price is testing a descending resistance line.
After making its new all-time high at $1.3264 the price is also trading within a range support zone Green at $0.8140 - $0.8416 and the resistance zone Blue at $1.1074 - $1.1567. A breakout above the resistance zone Blue and the symmetrical triangle with volume and daily candle close above could move the price towards the new all-time high, if the momentum continues Cardano (ADA) would make new highs.

Old ADA giant continues to move!ADA like other legacy assets has shown good growth. I believe that such coins will not show crazy growth anymore. The global market maker has been accumulating assets and is playing its cards. This is the main reason why old coins started to rise. Regarding ADA here we can fixation above 50 EMA on daily timeframe, which confirms bullish movement further. We are also pushing back from the support zone, which was resistance a couple months ago. I would expect ADA to rise to the 0.718 Fibonacci level area. That's a pretty good target for such a project.
Horban Brothers.

ADA Outlook after the Dip. What to expect NOW ?As you can see, the price is forming two bullish patterns on the DAILY timeframe. I expect the price to rise to the top of the triangle to complete the handle of the cup and handle pattern. If my view is correct, Cardano will rise to $1.25 .
And if this pattern is correct and breaks, higher targets are possible.
Give me some energy !!
✨We spend hours finding potential opportunities and writing useful ideas, we would be happy if you support us.
Best regards CobraVanguard.💚
_ _ _ _ __ _ _ _ _ _ _ _ _ _ _ _ _ _ _ _ _ _ _ _ _ _ _ _ _ _ _ _
✅Thank you, and for more ideas, hit ❤️Like❤️ and 🌟Follow🌟!
⚠️Things can change...
The markets are always changing and even with all these signals, the market changes tend to be strong and fast!!

ADAUSD - From this simple chart, whole crypto market bullish?While its not necessary obvious to guess next move on BTC, some alts like ADA can help a lot
ADA made a rebound on the weekly 200MA on the 20th of December, that mark was also a support from the previous high made in feb 2024 and another support on feb 2022
as we are talking with big timeframes, chances for the asset to go under 20th December lows are very unlikely (but still possible), making the WHOLE crypto market still very bullish
what now ?
We can easily revisit ATH at 3, the faster we reach it, the higher we can go next
3 possibilities : February, April or September
not financial advice
Cheers

BTC BUYhello friends
Considering the failure of the resistance, we can enter into the purchase transaction.
Note that if the stop loss is taken in the lower range, we will enter the transaction again with capital management.
*Trade safely with us*

BUY ADAhello friends
According to the support range we are in, we can enter into a purchase transaction with capital management.
*Trade safely with us*

I think I have drawn a flawless painting !!! As you can see, the price is forming two bullish patterns on the 4-hour timeframe. I expect the price to rise to the top of the triangle to complete the handle of the cup and handle pattern. If my view is correct, Cardano will rise to $1.5 . so I think I have drawn a flawless painting!!!!!
Give me some energy !!
✨We spend hours finding potential opportunities and writing useful ideas, we would be happy if you support us.
Best regards CobraVanguard.💚
_ _ _ _ __ _ _ _ _ _ _ _ _ _ _ _ _ _ _ _ _ _ _ _ _ _ _ _ _ _ _ _
✅Thank you, and for more ideas, hit ❤️Like❤️ and 🌟Follow🌟!
⚠️Things can change...
The markets are always changing and even with all these signals, the market changes tend to be strong and fast!!

ADA Masterclass: Spotting the Perfect TradeHappy New Year, everyone! I hope 2025 is off to a fantastic start for you, filled with success, joy and of course, profitable trades. ADA has been a shining example of technical precision in recent months, offering reliable and rewarding setups. Let’s explore what the charts are telling us as we move forward into the new year.
Market Overview:
ADA has consistently respected key technical levels. Recently, the market completed a perfect ABC correction to the trend-based Fibonacci extension 1:1 at $0.7655, almost to the dollar. Following this correction, ADA has seen a strong rally, now approaching critical resistance levels, while the $1 support zone emerges as a pivotal area.
Key Observations and Levels:
1.) Resistance Zone – $1.079–$1.1108
ADA is approaching the 0.618 Fibonacci retracement of the broader downtrend from $1.3264 to $0.7624, located at $1.1108.
This level is a significant resistance zone, marking a potential turning point where sellers could step in to take control.
2.) Short Trade Idea:
A short trade setup can be executed at $1.1108, targeting the $1 support zone for a potential 8–9% gain.
Trade Setup Details:
Entry: $1.1108
Stop Loss: Above the 0.666 Fibonacci retracement.
Target: $1
Risk-to-Reward Ratio: 3:1
Risk: 2.75%
3.) Support Zone at $1:
The $1 level remains a critical support zone due to multiple confluences:
Psychological significance as a round number.
A single print zone between $1.001–$1.003, indicating a key liquidity area.
Alignment with the 0.382 Fibonacci retracement of the current wave (1st January low to 3rd January high).
Anchored VWAP from the recent lows is also sitting at $1, adding further weight to this level as a strong support zone.
Long Trade Idea:
A long trade can be considered if ADA revisits the $1 support zone, but ensure to wait for volume confirmation to validate buying strength before entering.

Analysis and buy signalsHello guys
With its growth, this currency entered the correction phase and was compressed in a price triangle.
Now, taking into account the further fall, we have determined the purchase range that you can use and move to the specified range with it.
*Trade safely with us*

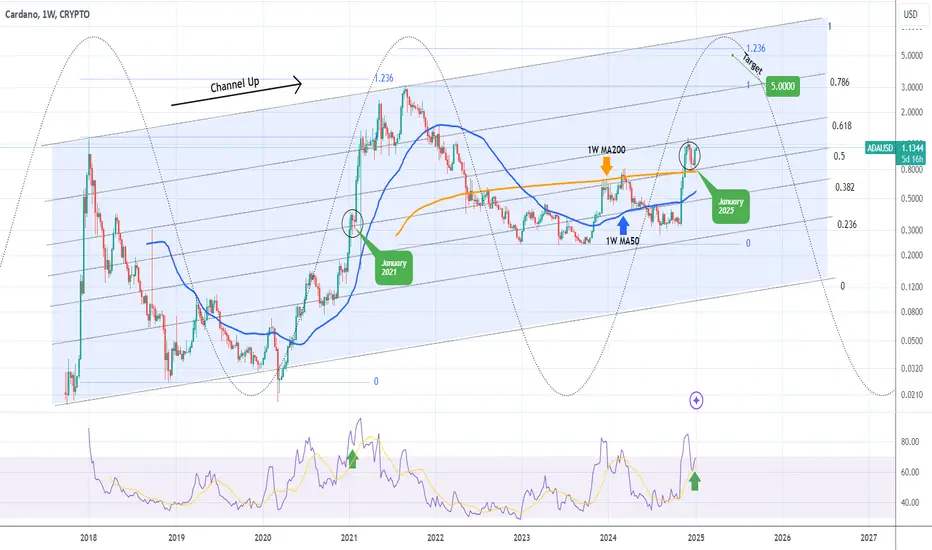
CARDANO Mega rally starting first to $3 then top expected at $5Last time we looked at Cardano (ADAUSD) we gave a confident medium-term buy signal (November 18 2024, see chart below):
Today, having seen a very strong closing to the year last week and especially since the price bounced off the 1W MA200 (orange trend-line), we are making a long-term call towards the top of the Cycle.
Technically ADA's historic pattern is a Channel Up and if we draw its Fibonacci levels, the price is currently within the 0.5 - 0.618 range. That is exactly where it was during the same stage of the previous Cycle in January 2021. As the 0.5 Fib held, once it closed a 1W candle above the 0.618, the price skyrocketed to the 0.786 Channel Fib and tested the previous All Time High (ATH).
We can see the amazing symmetry between the Cycles on the 1W RSI fractals too. As a result, our next immediate Target for ADA is near the previous ATH at $3. Beyond that, we expect the Cycle to top at $5, which is marginally below the 1.236 Fibonacci extension, which was where the August 2021 Cycle Top was priced.
-------------------------------------------------------------------------------
** Please LIKE 👍, FOLLOW ✅, SHARE 🙌 and COMMENT ✍ if you enjoy this idea! Also share your ideas and charts in the comments section below! This is best way to keep it relevant, support us, keep the content here free and allow the idea to reach as many people as possible. **
-------------------------------------------------------------------------------
💸💸💸💸💸💸
👇 👇 👇 👇 👇 👇
Be careful with ADAUSDT !!!As I mentioned, the price finally managed to break the bullish wedge and reach the targets I mentioned. Now, technically, since the price has reached the important 0.618 line, it might correct slightly and then break this line with strength to reach higher targets.
PREVIOUS ANALYSIS
Give me some energy !!
✨We spend hours finding potential opportunities and writing useful ideas, we would be happy if you support us.
Best regards CobraVanguard.💚
_ _ _ _ __ _ _ _ _ _ _ _ _ _ _ _ _ _ _ _ _ _ _ _ _ _ _ _ _ _ _ _
✅Thank you, and for more ideas, hit ❤️Like❤️ and 🌟Follow🌟!
⚠️Things can change...
The markets are always changing and even with all these signals, the market changes tend to be strong and fast!!

ADA - Time to buy again!Possibly due to Bitcoin's price rising above $100,000 and an increase in money injection into Bitcoin, the price may correct slightly in a few days, drop to the support line, and then rise to $1.25 .
Give me some energy !!
✨We spend hours finding potential opportunities and writing useful ideas, we would be happy if you support us.
Best regards CobraVanguard.💚
_ _ _ _ __ _ _ _ _ _ _ _ _ _ _ _ _ _ _ _ _ _ _ _ _ _ _ _ _ _ _ _
✅Thank you, and for more ideas, hit ❤️Like❤️ and 🌟Follow🌟!
⚠️Things can change...
The markets are always changing and even with all these signals, the market changes tend to be strong and fast!!

Just COMMENT me the name, and I'll handle the analysis for you!Tell me the coin name, and I'll analyze it for you!

Ada breaking up out of a Bull pennant.Target for the pennant hound be around $1.86 . I also noticed the.bitcoin dominance chart’s 200ma looks like its finally flipping back to resistance which if so will increase the probability of ADA hitting this pennant target as well as alt season finally officially starting. *not financial advice*

Cardano ADA Continues Outperform The Market In JanuaryHello, Skyrexians!
In our recent analysis on BINANCE:ADAUSDT we predicted the price growth above $1.20 when the price was $0.37. When price reached the $1.30 we told you that it's time for retracement to $0.8. Cardano reached exactly this target and has already bounced. You can find all this predictions in this article . Now it's much more important to understand what is the next move.
Let's take a look at the daily time frame. After reaching the local top price has printed red dot on Bullish/Bearish Reversal Bar Indicator and dumped -40%. As always, alerts from this indicator are automatically replicated on my accounts. You can find the information in our article on TradingView .
Dump has been stopped inside the Fibonacci 0.5 zone with the green dot on this indicator. This is the strong sign that corrective wave 2 has been finished. The next target is 1.61-2.61 Fibonacci extensions. We suppose that price can reach $2.5-$3.5 in January-February 2025.
Best regards,
Skyrexio Team
___________________________________________________________
Please, boost this article and subscribe our page if you like analysis!

Hoping for a Dip, but Also Some Thrills: Shorting $ADA!CRYPTOCAP:ADA Short Setup:
Wanted some extra adrenaline in my life, so I’m shorting CRYPTOCAP:ADA here.
Simple setup: First time testing the monthly block. If this week closes below $1.18, it will add confluence.
Aiming for sub-80c. BINANCE:ADAUSDT

Tell me the coin name, and I'll analyze it for you!Just COMMENT me the name, and I'll handle the analysis for you!

ADA Analysis: Key Levels and Trend Outlook 2024.12.28Hello, this is Greedy All-Day.
Today’s analysis focuses on ADA (Cardano).
Weekly Chart Analysis
Looking at the weekly chart, ADA is currently within the green box frame.
However, unlike the past, where the price oscillated within a box range with alternating bullish and bearish candles, the current zone has seen three consecutive bearish weeks, signaling persistent selling pressure.
Key Support Zone: Red Box
The red box represents the resistance level from 2022 before the breakout. It is now acting as a support zone under test.
If the support holds: ADA may follow a similar range-bound movement as seen in the green box on the left.
If the support fails: ADA is likely to drop further into the yellow box zone.
Breakdown Scenario:
If the yellow box support also fails, ADA may enter the blue box frame, with the potential to decline to as low as 0.216.
Daily Chart Analysis
The daily chart reveals several bearish patterns:
Head & Shoulders (H&S) pattern is complete.
Descending Triangle pattern is also complete.
Key Observation:
ADA is currently holding the 0.87 support level.
However, if the price breaks below the Ichimoku Cloud on the daily chart, the bearish patterns suggest a significant loss of buying momentum and a potential shift to selling pressure.
Target:
If the bearish scenario unfolds, the expected sell-off could lead to a 51% decline, with the price first testing the yellow box zone.
Additional downside potential will depend on whether support emerges in the yellow box zone.
4-Hour Chart Analysis
The 4-hour chart confirms that ADA has broken its short-term trendline, indicating a definitive shift in momentum.
Buying pressure appears to have dissipated, suggesting that the bullish trend is effectively over for now.
Upside Potential:
For ADA to regain bullish momentum, it would need to climb back above $1.00.
Until that happens, the market should be approached with a sell-oriented perspective.
Conclusion
ADA is currently in a bearish trend, with critical support levels being tested.
If 0.87 support holds, a temporary range-bound movement may occur.
If it breaks, ADA could fall to the yellow box zone or even enter the blue box frame, with a potential low of 0.216.
For now, a sell perspective is more appropriate, with cautious monitoring of the $1.00 level for potential signs of recovery.
Trade wisely, and best of luck! 🚀

Be careful with ADAUSDT !!!After breaking the descending wedge, the price fell to the support line. As you can see, the price has now formed an ascending wedge, which is promising. The price could rise to $1.07 after breaking this wedge, but considering the Christmas holidays, this might take a bit longer.
Give me some energy !!
✨We spend hours finding potential opportunities and writing useful ideas, we would be happy if you support us.
Best regards CobraVanguard.💚
_ _ _ _ __ _ _ _ _ _ _ _ _ _ _ _ _ _ _ _ _ _ _ _ _ _ _ _ _ _ _ _
✅Thank you, and for more ideas, hit ❤️Like❤️ and 🌟Follow🌟!
⚠️Things can change...
The markets are always changing and even with all these signals, the market changes tend to be strong and fast!!
