Tell me the coin name, and I'll analyze it for you!Just COMMENT me the name, and I'll handle the analysis for you!
J-ADA

ADA Analysis: Key Levels and Trend Outlook 2024.12.28Hello, this is Greedy All-Day.
Today’s analysis focuses on ADA (Cardano).
Weekly Chart Analysis
Looking at the weekly chart, ADA is currently within the green box frame.
However, unlike the past, where the price oscillated within a box range with alternating bullish and bearish candles, the current zone has seen three consecutive bearish weeks, signaling persistent selling pressure.
Key Support Zone: Red Box
The red box represents the resistance level from 2022 before the breakout. It is now acting as a support zone under test.
If the support holds: ADA may follow a similar range-bound movement as seen in the green box on the left.
If the support fails: ADA is likely to drop further into the yellow box zone.
Breakdown Scenario:
If the yellow box support also fails, ADA may enter the blue box frame, with the potential to decline to as low as 0.216.
Daily Chart Analysis
The daily chart reveals several bearish patterns:
Head & Shoulders (H&S) pattern is complete.
Descending Triangle pattern is also complete.
Key Observation:
ADA is currently holding the 0.87 support level.
However, if the price breaks below the Ichimoku Cloud on the daily chart, the bearish patterns suggest a significant loss of buying momentum and a potential shift to selling pressure.
Target:
If the bearish scenario unfolds, the expected sell-off could lead to a 51% decline, with the price first testing the yellow box zone.
Additional downside potential will depend on whether support emerges in the yellow box zone.
4-Hour Chart Analysis
The 4-hour chart confirms that ADA has broken its short-term trendline, indicating a definitive shift in momentum.
Buying pressure appears to have dissipated, suggesting that the bullish trend is effectively over for now.
Upside Potential:
For ADA to regain bullish momentum, it would need to climb back above $1.00.
Until that happens, the market should be approached with a sell-oriented perspective.
Conclusion
ADA is currently in a bearish trend, with critical support levels being tested.
If 0.87 support holds, a temporary range-bound movement may occur.
If it breaks, ADA could fall to the yellow box zone or even enter the blue box frame, with a potential low of 0.216.
For now, a sell perspective is more appropriate, with cautious monitoring of the $1.00 level for potential signs of recovery.
Trade wisely, and best of luck! 🚀

Be careful with ADAUSDT !!!After breaking the descending wedge, the price fell to the support line. As you can see, the price has now formed an ascending wedge, which is promising. The price could rise to $1.07 after breaking this wedge, but considering the Christmas holidays, this might take a bit longer.
Give me some energy !!
✨We spend hours finding potential opportunities and writing useful ideas, we would be happy if you support us.
Best regards CobraVanguard.💚
_ _ _ _ __ _ _ _ _ _ _ _ _ _ _ _ _ _ _ _ _ _ _ _ _ _ _ _ _ _ _ _
✅Thank you, and for more ideas, hit ❤️Like❤️ and 🌟Follow🌟!
⚠️Things can change...
The markets are always changing and even with all these signals, the market changes tend to be strong and fast!!

TradeCityPro | Cardano : On the Way to a New ATH👋 Welcome to TradeCityPro!
In this analysis, I will review the ADA coin for you. The Cardano project is one of the major projects in the crypto space and has been among the top 10 coins by market cap for a long time.
📅 Weekly Timeframe: Moving Towards ATH
In recent weeks, ADA has shown a strong upward trend, forming significant lows that serve as support levels for the price.
📈 Currently, the price is struggling with the resistance level at 1.2046, and if this level is broken, the next major resistance will be the ATH.
🧩 The RSI oscillator entered the overbought zone during the price pump, reaching 82.87, and is now in a corrective phase, moving below the overbought level.
📊 The buying volume in recent candles has been substantial, supporting the trend and showing convergence.
🔽 In case of a correction, the first support level is at 0.7683, which the price has already reacted to once. If a deeper correction occurs, the last support for this bullish leg is at 0.4322.
✅ The primary support levels are 0.3166 and 0.2427, which are critical and unlikely to be easily lost.
📝 Final Thoughts
This analysis reflects our opinions and is not financial advice.
Share your thoughts in the comments, and don’t forget to share this analysis with your friends! ❤️

ADA. Spot Entry Alert: Perfect Fibonacci Reversal! 12/24/24BINANCE:ADAUSDT
The market experienced a pullback, with the price returning to the lower boundary of the range. After breaking its support, it moved to a high-volume level, where strong buyers were present. Additionally, a proper Fibonacci correction was achieved, which might signal a potential reversal and an attractive spot entry point.
The $0.9388–$0.9088 range appears appealing for purchases, with targets at $1.2350–$1.3264.
DYOR.

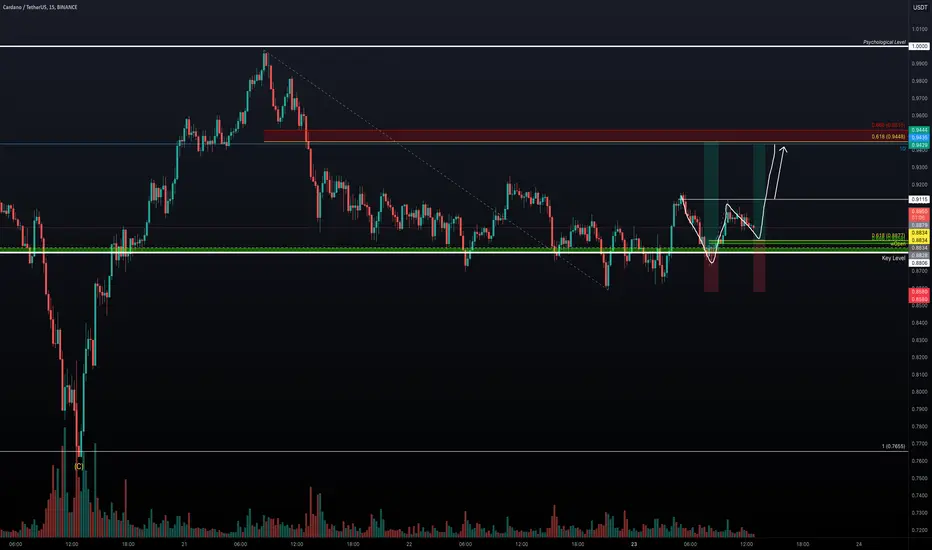
ADA - Gearing Up for a Breakout?After an impressive rebound from the trend-based Fibonacci extension 1:1 at $0.7655, ADA has been consolidating between $0.92 and $0.85 for the past two days. As the new week begins, today's wOpen at $0.8834 is a critical support level, perfectly aligning with the key level at $0.8806. Holding above these levels reinforces a bullish outlook.
Key Insights and Trade Setups:
Support Zones to Watch:
$0.8834 (wOpen) and $0.8806 (Key Level).
Maintaining above these levels keeps the bullish structure intact.
Long Setup Options:
A great long opportunity was from today’s wOpen ($0.8834).
Alternatively, wait for a retracement to the golden pocket at $0.8877 of this current wave.
R:R: 2.5, a solid potential reward for the risk taken.
Target for Long Trades:
Aim for the Fibonacci 0.618 level at $0.9448, which aligns with the daily resistance level.
This zone also represents a high-liquidity area where short sellers may be forced to exit positions.
Pattern Confirmation:
The potential formation of an Adam and Eve pattern strengthens the bullish case. Confirmation comes above $0.9155, suggesting further upside.
Cardano instant analysishello friends
By breaking the red support zone, ADA gives us this signal that there is a high possibility of price correction. We have considered two specified areas for buying it, which I hope you like, and the targets are also specified.
Be successful and profitable.

ADA USDTCardano has experienced a 40% decline from its recent high and is now retesting key higher timeframe support levels. This zone presents a strategic entry point for positioning ahead of the next upward move.

Be careful with ADAUSDT !!!I think the price is trying to form a bullish flag, but I'm not sure yet. After the bullish flag breaks, we can say that the price will increase.
Give me some energy !!
✨We spend hours finding potential opportunities and writing useful ideas, we would be happy if you support us.
Best regards CobraVanguard.💚
_ _ _ _ __ _ _ _ _ _ _ _ _ _ _ _ _ _ _ _ _ _ _ _ _ _ _ _ _ _ _ _
✅Thank you, and for more ideas, hit ❤️Like❤️ and 🌟Follow🌟!
⚠️Things can change...
The markets are always changing and even with all these signals, the market changes tend to be strong and fast!!

Need I say moreWithout even looking i know theres a wicked bear divergence on the daily RSI also
GET LOWWWW. Not financial advice haha

ADA – Is the $1 Support Zone the Next Target?ADA is currently trading within a well established range-bound structure. Here’s the breakdown of this setup:
1. Key Levels to Watch
$1.00
This is the most critical support zone and psychological level.
The Golden Pocket (0.618 Fibonacci retracement) lies perfectly at this level, adding strong confluence for buyers to step in.
Resistance:
Around the 0.786 Fibonacci retracement level (~$1.107), where price could be rejecting. The 0.786 Fibonacci level coincides with the Point of Control (POC) of the trading range.
The anchored VWAP (Volume Weighted Average Price) aligns with this resistance, creating a high-probability short opportunity!
2. Trade Setup: Low-Risk Short Opportunity
Given the confluence of the following:
0.786 Fibonacci level (~$1.107): Resistance zone.
Anchored VWAP: Adding overhead selling pressure.
Order Block & Golden Pocket at $1: Strong support target.
This creates a low-risk short setup:
Entry: Near $1.107
Take-Profit: $1.015
Stop-Loss: Above $1.113 to limit risk exposure.
3. Risk-to-Reward Ratio
Risk: ~1% loss (tight stop above resistance).
Reward: ~8% gain (targeting the $1.00 support).
This gives us an 8:1 risk-to-reward ratio, making it a highly favorable trade setup.
4. Supporting Indicators
Volume Profile: Price has significant volume accumulation near the current range, indicating strong resistance around $1.10-$1.12.
Bearish Structure: Price remains below the anchored vwap (yellow line), indicating bearish momentum.
Conclusion
ADA is showing strong confluence for a potential short opportunity with minimal risk and significant upside reward. A retest of the $1 support is likely, given the combination of the Fibonacci Golden Pocket, order block and anchored VWAP resistance.

Cardano - Starting The 10x Parabolic Rally!Cardano ( CRYPTO:ADAUSD ) is perfectly following the break and retest:
Click chart above to see the detailed analysis👆🏻
With an incredible +200% pump in November, Cardano is finally coming back to life after creating the bullish double bottom break and retest just a couple of months ago. Looking at previous cycles, this seems to be just the beginning of another +3.000 rally.
Levels to watch: $3.0, $10.0
Keep your long term vision,
Philip (BasicTrading)

ADA at the Crossroads: Will $1.12 Spark a Bullish Surge?Cardano (ADA) is currently navigating a pivotal price range near $1.12, which serves as a significant intraday resistance level. The market is displaying signs of potential directional movement, with buyers and sellers poised to define the next critical phase.
A pullback toward $1.016, followed by a decisive bounce, or a direct bullish breakout of $1.12 could reaffirm bullish sentiment, setting the stage for a climb toward the next major resistance zone at $1.267. Such a move would signal renewed optimism among market participants, offering opportunities for upward momentum (Solid Green Projection).
Conversely, failure to break above $1.12 might hint at underlying weakness, increasing the probability of a descent toward the $1.016 support zone (Dashed Green Projection).
A breach below this level could signal the start of a more pronounced downward trend, with the next major support at $0.869 potentially coming into focus (Red Projection).

XRP Brief scenarioHi Traders,
This is my trading scenario.
Hope it can help you for your trading strategy.
Make sure this is just scenario. please plan your own trading strategy too.
Waiting is most important key to be a long term trader.
Emotion is just biological reaction from your hormone, memory and body.
Good luck.

ADAUSDT | The Blueprint for a Potential ReboundIn the current market structure, the blue boxes on the chart may serve as potential demand zones.
These areas are key levels where buying interest could emerge, providing support for ADA's price.
If the price revisits these zones, they could act as strong entry points for a potential bounce. However, it’s essential to monitor how price reacts upon reaching these levels and wait for confirmation signals to ensure the zones hold as valid support.
I keep my charts clean and simple because I believe clarity leads to better decisions. Trading doesn’t have to be overly complicated, and I enjoy sharing setups that have worked well for me.
My approach is built on years of experience and a solid track record. I don’t claim to know it all, but I’m confident in my ability to spot high-probability setups. It’s all about learning and growing together as traders, and I’m here to share what I see.
The markets can confirm what the charts whisper if we’re paying attention. I hope these levels help you as much as they’ve helped me in the past. Let’s see how this plays out!
My Previous Hits
🐶 DOGEUSDT.P: Next Move
🎨 RENDERUSDT.P: Opportunity of the Month
💎 ETHUSDT.P: Where to Retrace
🟢 BNBUSDT.P: Potential Surge
📊 BTC Dominance: Reaction Zone
🌊 WAVESUSDT.P: Demand Zone Potential
🟣 UNIUSDT.P: Long-Term Trade
🔵 XRPUSDT.P: Entry Zones
🔗 LINKUSDT.P: Follow The River
📈 BTCUSDT.P: Two Key Demand Zones
🟩 POLUSDT: Bullish Momentum

ADA/USDT : More Bullish Move Ahead? (READ THE CAPTION)By analyzing the #Cardano chart in the daily (logarithmic) timeframe, we can see that the price is currently trading around the $0.35 range. If it can stabilize above this key level, we can expect further upward movement. The next targets for ADA are $0.3780, $0.415, and $0.4570.
Please support me with your likes and comments to motivate me to share more analysis with you and share your opinion about the possible trend of this chart with me !
Best Regards , Arman Shaban

HBAR gearing up for ATH: $0.80As said in my previous analysis, Hedera Hashgraph is the layer 1 in crypto to look out for and shortly after it did a 2.5x! Find the analysis below why Hedera is the superior layer 1 in all of crypto.
Now, ofcourse after a big run up, there's need for a consolidation and HBAR did just that. Currently its repeating November's fractal pretty perfectly. If(!) Ethereum doesn't correct today and keeps momentum, I expect HBAR to breakout. Key levels to break: 0.32 & 0.34. HBAR is currently sitting on a conflux of volume weithed support and the 4HR 50 EMA which (if the overall market stays bullish) will give support for a run up towards ATH.
I expect HBAR at ATH by the end of december if the market keeps momentum. DO NOT LEVERAGE TRADE, SPOT ONLY & DYOR.
Good luck and have fun! :)

ADA/USDT 1H AnalysisADA/USDT 1H Analysis: Bullish Momentum in Play
On the 1-hour time frame, ADA has just broken out of a bullish pennant pattern, and the price is moving upward. However, there are key levels to monitor if you're holding a long position:
Black line: This level represents the Daily Point of Control (POC) and the Weekly Open, making it a critical area to watch for potential resistance.
Pink resistance zone: A significant resistance level where price action may slow or reverse.
If you're currently long, exercise caution as the price approaches these levels. Confirmation of a breakout beyond these zones could signal further upside potential.
Let me know your thoughts and feel free to share your feedback! 👍

The last bullish chance of CARDANO in short term!The ADAUSDT has broken the wedge, which is a bearish sign in the short term. The price can correct down to the 0.618 Fibonacci level and then potentially shoot back up.
Give me some energy !!
✨We spend hours finding potential opportunities and writing useful ideas, we would be happy if you support us.
Best regards CobraVanguard.💚
_ _ _ _ __ _ _ _ _ _ _ _ _ _ _ _ _ _ _ _ _ _ _ _ _ _ _ _ _ _ _ _
✅Thank you, and for more ideas, hit ❤️Like❤️ and 🌟Follow🌟!
⚠️Things can change...
The markets are always changing and even with all these signals, the market changes tend to be strong and fast!!

Cardano ($ADA) Dips 8% After Foundation’s X Account HackCardano ( CRYPTOCAP:ADA ), one of the largest cryptocurrencies by market cap, faced significant turbulence after the Cardano Foundation’s X account (@Cardano_CF) was compromised on Sunday. This breach resulted in false promotions and market concerns, triggering an 8% drop in ADA’s price. Here’s a comprehensive analysis of the incident and the technical and fundamental outlook for the coin.
The Hack and Market Sentiment
The compromised X account propagated false information, including:
- Promotion of a fake token, ADAsol: Claimed as a partnership between Cardano and Solana.
- False claims of ADA withdrawal halts: Allegedly tied to SEC actions, further amplifying market fears.
The Cardano Foundation promptly addressed the issue, urging users to disregard any posts from the hacked account. Despite this, the damage to market sentiment was palpable, as fear and uncertainty gripped traders.
Broader Implications
This incident underscores the vulnerability of social media platforms to cyberattacks, even for established blockchain entities. It also raises critical questions about the need for enhanced cybersecurity in the crypto ecosystem.
However, amidst the chaos, optimism persists. Whale activity has shown signs of accumulation, suggesting that large investors still hold faith in ADA’s long-term prospects. Additionally, Cardano’s strong monthly performance—166% gains—indicates the potential for recovery.
Technical Analysis
At the time of writing, CRYPTOCAP:ADA trades at $1.115, reflecting a 6.79% drop intraday. The coin’s immediate range shows:
- Intraday low/high: $1.15–$1.22
- RSI (Relative Strength Index): 49, indicating weak momentum but a potential buy zone for opportunistic traders.
Market Outlook
While the hack triggered bearish sentiment, ADA’s price action aligns with broader market trends. Bulls will need to reclaim $1.22 to resume the upward trajectory seen earlier in Q4. Meanwhile, sellers may dominate if ADA fails to hold above the 38.2% Fib retracement level.
The Road Ahead
The X account hack could continue to weigh on ADA’s price in the short term. Negative sentiment might lead to increased selling pressure, especially if there are delays in restoring the compromised account.
Long-Term Prospects
Despite this setback, ADA’s bullish fundamentals remain intact:
- Whale Accumulation: Signals strong institutional confidence.
- Q4 Market Optimism: Renewed interest in cryptocurrencies positions ADA for potential gains.
Conclusion
The Cardano Foundation’s X account hack has undeniably shaken market confidence, resulting in an 8% dip in ADA’s price. However, with strong fundamentals and signs of whale accumulation, the coin still holds promise for recovery.
Traders should closely monitor technical levels and broader market trends to navigate this volatile period. For long-term holders, ADA remains a compelling investment, backed by its ecosystem and community support.

Where does ADA stand currently?From the point where we placed the red arrow on the chart, Cardano's correction began, and from the point where we placed the green arrow, Cardano's bullish pattern started.
The correction appears to be a symmetrical one, while the new bullish pattern seems to form an expanding triangle.
From the green zone, Cardano may potentially move upward again to complete wave E.
Closing a daily candle below the invalidation level will invalidate this analysis.
For risk management, please don't forget stop loss and capital management
Comment if you have any questions
Thank You

CRYPTO: ADAUSD trading plan. This is a trade I am currently looking at. I would be taking a LONG position if the price breakthrough the upper rectangular box and a SHORT position if the price breakthrough the lower rectangular box . Currently, I am more interested on the Long position. However, this is only a plan. Please take note that trading is about dealing and respecting the market trend. I do not make predictions.

Cardano Primed for 2025 ATH: Don’t Miss Out!Cardano (ADA) has been performing well, but its price hasn’t seen a major jump yet. It’s currently trading within its previous range, showing signs of stability. Based on the chart, the $0.9799 level looks like an ideal zone for a swing trade entry. This area offers a good balance of risk and reward for those looking to capitalize on potential upward movement.
Looking ahead, I’m optimistic about Cardano’s long-term growth, especially as we move toward 2025. The ecosystem has strong fundamentals and continued development, which could drive it toward a new all-time high (ATH). For traders and investors, this makes current levels a promising opportunity to position for the future rally.
