Cardano ADA price at a crossroadsAt the beginning of the year, ADA holders rejoiced that their coin was one of the first to break the long downward trend and that its price was expected to grow strongly.
However, there were 5 attempts to break above the strong mirror level of $0.42-0.43 and all failed, so it turns out that "someone" was selling out.
Did "they" know in advance that in early June, the SEC would say that Cardano's ADA is a security and that the ADAUSDT price would strong fall on the negative news?
I would like to believe that this is a coincidence, but the crypto market is currently unregulated and anything can happen.
We're keeping our "fingers crossed" that ADAUSD buyers will manage to break through and gain a foothold above $0.295. This will open the way for them to reach at least $0.36, and if they are lucky, the notorious $0.42-0.43.
However, we must also admit that if you look at the global chart, you can see that the ADAUSDT price still has room to fall. For example, to $0.17-0.18.
_____________________
Did you like our analysis? Leave a comment, like, and follow to get more
J-ADA

ADAs dilly fades away. If you find this information inspiring/helpful, please consider a boost and follow! Any questions or comments, please leave a comment! Also, check out the links in my signature to get to know me better!
...almost a full retrace of the dilly.
This is a good place for bulls to prove themselves.
Losing this level wouldn't be the greatest look, MO.
Other levels of interest, but this would be a nice one to see an impulse up from.
Cheers!

ADA long updateCRYPTOCAP:ADA update...
#Cardano is bouncing on R/S mtf level... Waiting for a breakout on the meme trendline and retest to jump in... Target 0.618 fib...
Only when confirmed...
#trading
@Cardano

ETH - will leave the channel in the wake of bitcoin?!Hello trader! Today I have a new idea for you. Like and subscribe to the channel, there is a lot of useful information.✅
Ethereum similarly built an ascending channel only already at 4H TF and is also actively pressing the support of the pattern, from which we can probably get a small reaction from the buyer, a small rebound)
While the main local support for ETH remains the level of $1825, which was already tested last week, I wrote about this support and there were plans to exit the short position there, but plans changed and I closed the position earlier.
As you understand, my thoughts are on a downward movement and an exit from the channel at a breakdown of the support level or through a small rebound and the first target will be the range of $1820-1800
So far, only from marginal Bitcoin positions to short with TBX $31,250

Will the exit from the "upward channel" be classic? When is DumpHello trader! Today I have a new idea for you. Like and subscribe to the channel, there is a lot of useful information.✅
Friends, I fell out of trading a bit, as always, when moving, on flights, but now I'm already at the base and ready to return to work with renewed vigor.
In general, nothing much has changed while I was away from the channel, the new formation "upward channel" that I found on 12H looks very good, on recent news, they removed jewelry liquidity from above $ 31,850 test of the upper border of the channel, at that time I fixed altos #AVVE and said that the correction from this XRP hype would not be long in coming :)
And what do we see now? The price is actively pushing the support of the $30,000 pattern and we are already seeing a small downward exit from the ascending channel, although it looks weak so far. This suggests that the seller has not yet activated at full strength, but I think this is temporary and we will see a powerful movement very soon. I have allocated for myself a zone of $27,780-28,000 where I will already think about fixing my short position with TBX $31,250.
By the way, the indicator also began to slowly change into short shoes on older timeframes, but not on all functions! So something here is quite possible to expect a slight rebound, from about $29,650 to $30,000-30,500 is not a long signal! In general, while I'm watching and if there are any changes, I will definitely let you know❤️

#ADAUSDT's Remarkable Bounce off Support and its Implications💎Yesterday, #ADAUSDT exhibited a precise bounce off the 227.2% Fibonacci retracement level, instilling strong hopes of an imminent trend reversal. However, caution is warranted as the price approaches a supply zone and remains below the downtrend trendline. At present, the market does not present the most secure buying opportunity, and sellers should remain vigilant.
💎In light of these factors, #Cardano needs to surmount the current obstacles to solidify its bullish intentions. Until then, we should anticipate range trading and a volatile price action. Nevertheless, it is only a matter of time before the price breaks, either below the support or above the resistance, signaling the opportune moment for MCP to take action.
Stay prepared, Paradisers, as we navigate the path ahead. 🌴

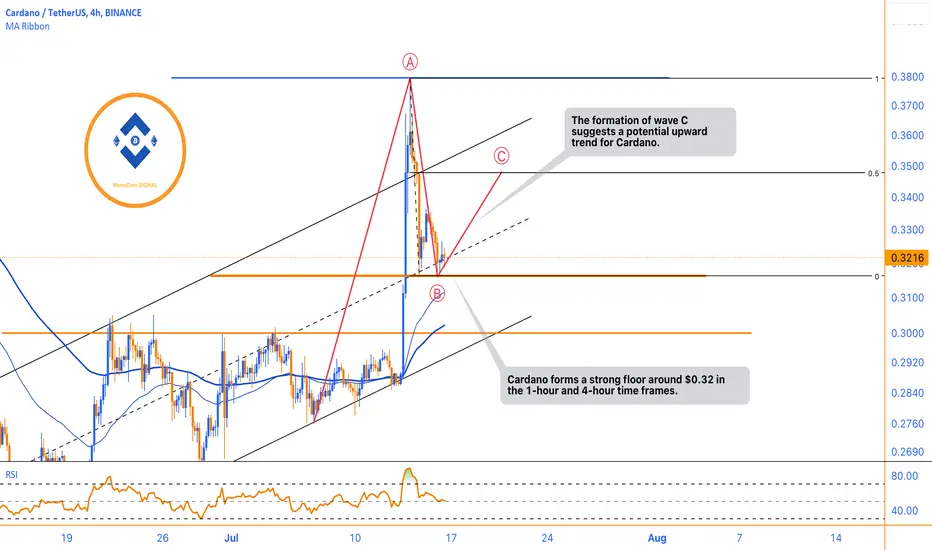
Strong Support Zone Suggests Bullish Potential in Wave CAccording to the analysis based on the previous resistance level, Cardano has established a solid support zone at approximately $0.32 within both the 1-hour and 4-hour timeframes. This range could potentially signal the beginning of an upward trend in wave C, indicating a bullish outlook.
ADA Trading Plan, July 16th – 22nd, 2023• ADA is one of the big winners following XRP’s legal victory. The chances of ADA being deemed a security are reduced. The probability of a new bear market low is diminished as well.
• On July 13th and 14th, ADA had a massive price increase of over 30%. Currently, it is retracing to the liquidity pool it left behind.
• The closest support level is the previous range high, at 0.305 USD.
• The closest resistance is at 0.33 USD.
Weekly Bias:
• My weekly bias is bullish. IMO, ADA’s price was suppressed for a long time. It has a solid base between 0.27 – 0.30 USD. I do not think it will go lower than 0.285 USD.
• My preferred scenario is for ADA to fully retrace the liquidity pool, find support on the previous range high, and continue to the upside. Regardless, most of the liquidity pool is already taken. ADA could continue up from this point.
A long trade from the previous range high has a better chance of success (IMO) and a better R: R.
Trade Idea No. 1:
• Entry: 0.33 (S/R flip).
• SL: 0.3169 (Daily low).
• Target: 0.38
• R: R: 1:4
Trade Idea No. 2:
• Entry: 0.305 (S/R flip).
• SL: 0.291 (Demand zone).
• Target: 0.38
• R: R: 1:5
NFA.
What do you think? Please share in the comments.
Best Wishes.

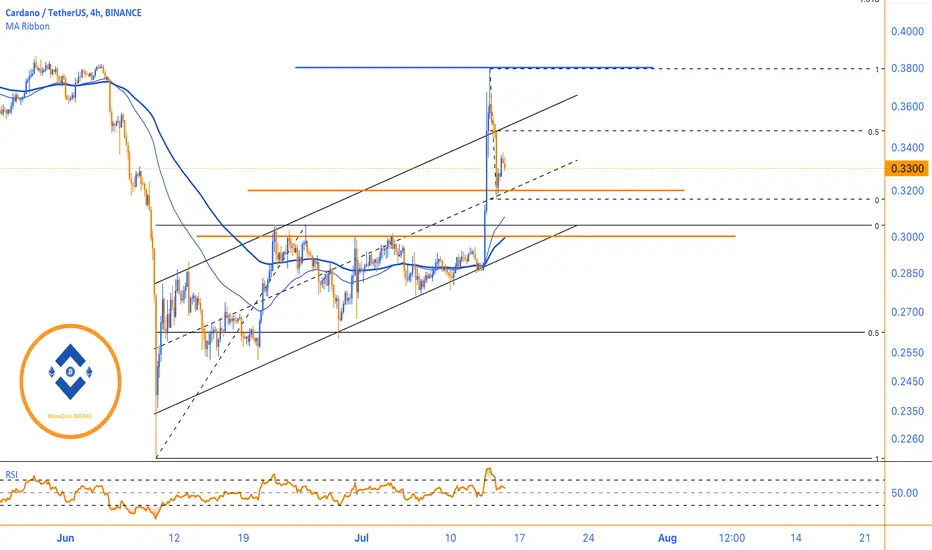
Maintaining Support, Price Surge, and Potential GrowthADA has successfully maintained the lower boundary of its short-term ascending channel, leading to a significant price increase within the specified resistance levels. This upward movement exhibited rapid and substantial gains within a single daily candle. However, the resistance at the $0.38 range triggered a strong negative reaction, causing Cardano's price to decline to the $0.32 support level. Remarkably, the demand for Cardano surged once again in this area. These developments indicate that Cardano is now operating within a broader range trend, demonstrating positive and bullish momentum in shorter time frames.
Upon analyzing the chart's resistance and support levels, two key support levels have been identified for Cardano at $0.32 and $0.30. By effectively maintaining these support levels, Cardano has the potential for further growth and a more comprehensive approach towards the $0.38 resistance level.
ADA/BTC - Cardano: Ascending_Triangle◳◱ We've detected an Ascending Triangle pattern on the CRYPTOCAP:ADA / CRYPTOCAP:BTC chart. This pattern is a bullish indication and could indicate a potential trend reversal. The next resistance levels are at 0.00000969 | 0.00000994 | 0.00001044 and the major support zones are respectively at 0.00000919 | 0.00000894 | 0.00000844.
◰◲ General info :
▣ Name: Cardano
▣ Rank: 8
▣ Exchanges: Binance, Kucoin, Huobipro, Gateio, Poloniex, Mexc
▣ Category/Sector: Infrastructure - Smart Contract Platforms
▣ Overview: Cardano is an open-source, smart-contract platform that aims to provide multiple features through layered design. Its modularization will eventually allow for network delegation, sidechains, and light client data structures. Cardano uses a version of Proof-of-Stake (PoS) called Ouroboros to secure the network and manage the block production process. The network features a native token called ADA that gives stakers a claim on new issuance in proportion to their holdings and allows users to pay for transactions.
◰◲ Technical Metrics :
▣ Mrkt Price: 0.0000096 ₿
▣ 24HVol: 75.640 ₿
▣ 24H Chng: 1.159%
▣ 7-Days Chng: -0.51%
▣ 1-Month Chng: 6.88%
▣ 3-Months Chng: -28.15%
◲◰ Pivot Points - Levels :
◥ Resistance: 0.00000969 | 0.00000994 | 0.00001044
◢ Support: 0.00000919 | 0.00000894 | 0.00000844
◱◳ Indicators recommendation :
▣ Oscillators: BUY
▣ Moving Averages: STRONG_BUY
◰◲ Technical Indicators Summary : STRONG_BUY
◲◰ Sharpe Ratios :
▣ Last 30D: -0.47
▣ Last 90D: -2.17
▣ Last 1-Y: -0.44
▣ Last 3-Y: 0.77
◲◰ Volatility :
▣ Last 30D: 0.55
▣ Last 90D: 0.55
▣ Last 1-Y: 0.68
▣ Last 3-Y: 1.06
◳◰ Market Sentiment Index :
▣ News sentiment score is 0.51 - Bullish
▣ Twitter sentiment score is 0.55 - Bullish
▣ Reddit sentiment score is 0.38 - Bearish
▣ In-depth ADABTC technical analysis on Tradingview TA page
▣ What do you think of this analysis? Share your insights and let's discuss in the comments below. Your like, follow and support would be greatly appreciated!
◲ Disclaimer
Please note that the information and publications provided are for informational purposes only and should not be construed as financial, investment, trading, or any other type of advice or recommendation. We encourage you to conduct your own research and consult with a qualified professional before making any financial decisions. The use of the information provided is solely at your own risk.
▣ Welcome to the home of charting big: TradingView
Benefit from a ton of financial analysis features, instruments and data. Have a look around, and if you do choose to go with an upgraded plan, you'll get up to $30.
Discover it here - affiliate link -

Cardano possible next move? 🚀🔥ADA today analysis 💎 ADA is currently showcasing an intriguing pattern, as it's trading within a tight symmetrical triangle, hinting at a potential breakout on the horizon.
💎 At this moment, it's navigating within a high-demand zone, and the RSI is signaling a substantial upward momentum. Moreover, an anticipated crossover of EMA 21 and 50 could further bolster the bullish outlook.
💎 If a breakout occurs in the upward direction, we could witness a fantastic bullish surge. However, if the price fails to sustain its upward momentum, a significant downward shift could be on the horizon.
💎In the dynamic world of crypto, staying informed and adaptable is key. Stay tuned for more updates and enjoy your trading journey

ADA Cardano and the Altcoin Season ThesisIf you haven`t sold ADA here:
Then the recent developments in the cryptocurrency market, particularly the favorable court ruling for Ripple Labs, signal an optimistic start to a new altcoin season.
With the federal judge ruling that some of Ripple's sales of the XRP token do not fully meet the definition of a securities offering, it instills confidence in the altcoin space.
This ruling brings clarity to the regulatory landscape and alleviates concerns surrounding XRP, leading to major cryptocurrency exchanges, including Coinbase, relisting the token. The reintroduction of XRP to these platforms demonstrates growing acceptance and renewed interest in this altcoin.
The anticipation surrounding the approval of a spot bitcoin ETF in the United States adds to the positive sentiment in the market.
The successful launch of a previously approved ETF in Europe further reinforces the upward trend for altcoins.
The recent court ruling that declared XRP as not a security sets a precedent that could potentially benefit other cryptocurrencies currently classified as securities by the SEC. In the SEC's case against Binance, they designated 10 cryptocurrencies, including BNB, BUSD, SOL, ADA, MATIC, ATOM, SAND, MANA, AXS, and COTI, as securities.
Additionally, in the SEC's lawsuit against Coinbase, they named 13 cryptocurrencies, reinforcing their stance on SOL, ADA, MATIC, SAND, and AXS, and adding CHZ, FLOW, ICP, NEAR, VGX, and NEXO to the list.
This development showcases the increasing institutional acceptance of cryptocurrencies and creates a ripple effect across the market, providing a boost for various altcoins, including ADA Cardano, for which my price target is $0.45.
Looking forward to read your opinion about it!

The 0.4080 point is the divergence point of the rise and fallHello?
Traders, welcome.
If you "Follow", you can always get new information quickly.
Please also click "Boost".
Have a good day.
-------------------------------------
(ADAUSDT chart)
This rise did not turn the trend into an uptrend.
Therefore, I think that the movement to switch to an upward trend will begin only when the price rises above the 0.3032-0.3731 section and maintains it.
I would expect the price to hold above 0.4080 to start a full-fledged uptrend.
The timing of purchase is important for investment, that is, trading, but in the end, you must think about the increase compared to the investment period and decide.
In that sense, if it rises above 0.4080, ADA is a good coin to trade from a mid- to long-term perspective.
-------------------------------------------------- -------------------------------------------
** All descriptions are for reference only and do not guarantee profit or loss in investment.
** Even if you know other people's know-how, it takes a considerable period of time to make it your own.
** This is a chart created with my know-how.
---------------------------------
ADAUSD crossed over the MA200 (1d). Buy signal.ADAUSD crossed over the MA200 (1d) after 5 weeks under it.
The main pattern is a Channel Down and the last time the MA200 broke after a bottom, made the price peak near the 1.382 Fibonacci level.
Trading Plan:
1. Buy on the current market price.
Targets:
1. 0.44000 (under the MA200 1d).
Tips:
1. The RSI (1d) is overbought. The other two times it reached that level this year, one was at the start of an uptrend (straight after crossing above the MA50 1d) and the other at the end of the uptrend (but the MA50 1d has been broken much earlier). This time the MA50 (1d) just broke today, so it is more likely that we are still at the start of the uptrend.
Please like, follow and comment!!

🔥 ADA Worst Case Scenario: Be Prepared!In this analysis I want to take a look at my personal worst case scenario for Cardano: a parallel channel. Keep in mind that this is not my most likely outcome, but something I'm just watching.
The channel is constructed by taking the top resistance (with three touches) and attaching it directly to the COVID sell-off lows. By doing this we construct a parallel channel with a clear support and resistance structure. The bottom support has not been retested, so we can't guarantee that the market will accept this support. If ADA will actually move towards the bottom support, it would mean that we still have 40%-30% more downside ahead of us.
Still, I'm confident about two things:
- The market will find some kind of support. Whether it will be the definite market lows remains to be seen.
- Buying from this support will offer great long term opportunity, even if it's not the bear market low.
What is your prediction for ADA? Share your thoughts in the comments 🙏

Fluctuations, Resistance, and Potential Price LevelsOver the past week, Cardano experienced fluctuations within a specific range and demonstrated a consistent response to levels that were identified as support and resistance. The resistance level at $0.3050 continues to elicit negative reactions, but if market conditions remain favorable, it is possible for this resistance to be surpassed, leading to a potential increase in ADA's price towards the next range at $0.232. It is worth noting that the subsequent resistance range is expected to trigger a stronger negative reaction compared to the $0.30 range. Consequently, there is a possibility of further price decline, potentially testing support levels at $0.24 and $0.23.

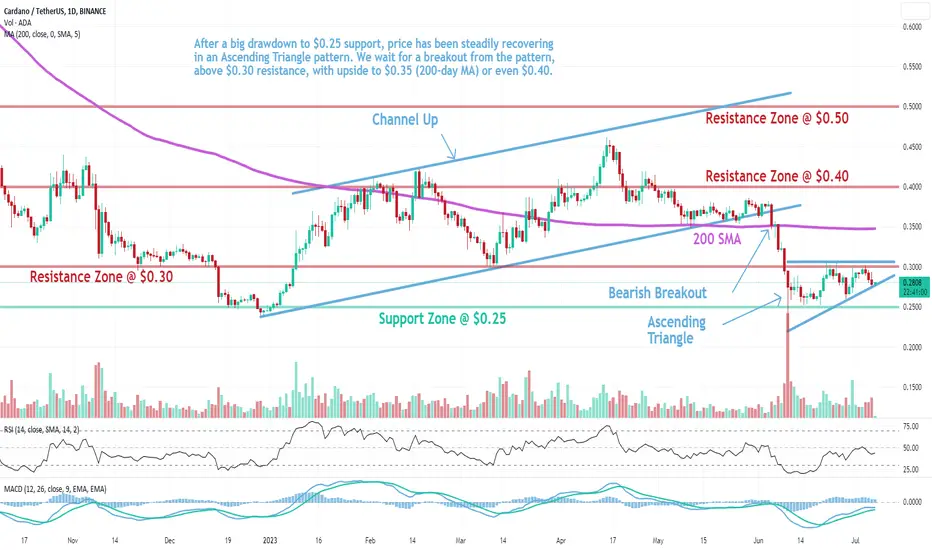
ADA: Ascending TriangleCardano (ADA) technical analysis:
Trade setup : After a big drawdown to $0.25 support, price has been steadily recovering in an Ascending Triangle pattern. We wait for a breakout from the pattern, above $0.30 resistance, with upside to $0.35 (200-day MA) or even $0.40.
Trend : Downtrend across all time horizons (Short- Medium- and Long-Term).
Momentum is Mixed as MACD Line is above MACD Signal Line (Bullish) but RSI < 45 (Bearish). MACD Histogram bars are declining, which suggests that momentum is weakening.
Support and Resistance : Nearest Support Zone is $0.25. The nearest Resistance Zone is $0.30 (previous support), then $0.40, and $0.50.
BITCOIN : My view for the next few daysFor those who have followed the previous posts I published on Bitcoin, you will already know what my view is, if you haven't seen my posts go and see them in my profile.
Today I go into detail by analyzing the latest daily candles.
Since the last post we have seen a rapid exit from the bullish channel highlighted in which I had signaled the Long entry which took place successfully.
After the upward movement we see a slowdown in prices in the 30500 area, where the candles following that of June 23rd are almost all inside bars, therefore according to my method, NOT tradable candles.
I have highlighted the highs and lows of the candle of 23 and we see an exit on the candle of June 30 which causes the start of the second swing in favor of the bullish structure highlighted by the yellow color of the candles.
The price continues its lateralization approaching the LuBot TrendCloud and today showing another Long trigger on swing number 3.
This could be the trigger that could lead prices to the 34500 area considering the more positive view (green path).
The other 2 views are both positive but see a major correction / lateralization before arriving at the 34500 area.
In any case, the view remains positive.
👍 What do you think? If you also agree with my view leave a like 😁
💖 Remember to follow me so you don't miss my future analyses.
📊 Get access 🔑 free to all my indicators for a week,
message me to find out how to get FREE access for life 💥

Bitcoin - the beginning of a strong dump or will we see another Hello trader! Today I have a new idea for you. Like and subscribe to the channel, there is a lot of useful information.✅
BTC - Friends, the short position is working out according to plan!
We have two important events ahead of us:
▪First: a test of the triangle from below in the range of $30.225-30.150. From there we can get a refund of $30,800. Be careful with your feet!
▪Second: FOMC minutes at 21:00 MCK. You should also expect volatility from this event.
I continue to hold the position and have temporarily removed the $31,550 order. In case of increased volatility, I will set it back.
P.S: Guys, if you are holding a position with me and using high leverage, I advise you to move your stop loss to breakeven, and it is best to move it to plus.

adabunch of lines on this, waiting to see if this "double bottom" can form.
looking like could go, but from the start we have always thought about seeing .14 again. would be surprised if we didnt but if btc doesnt retest prev highs than i could see this skipping as well.

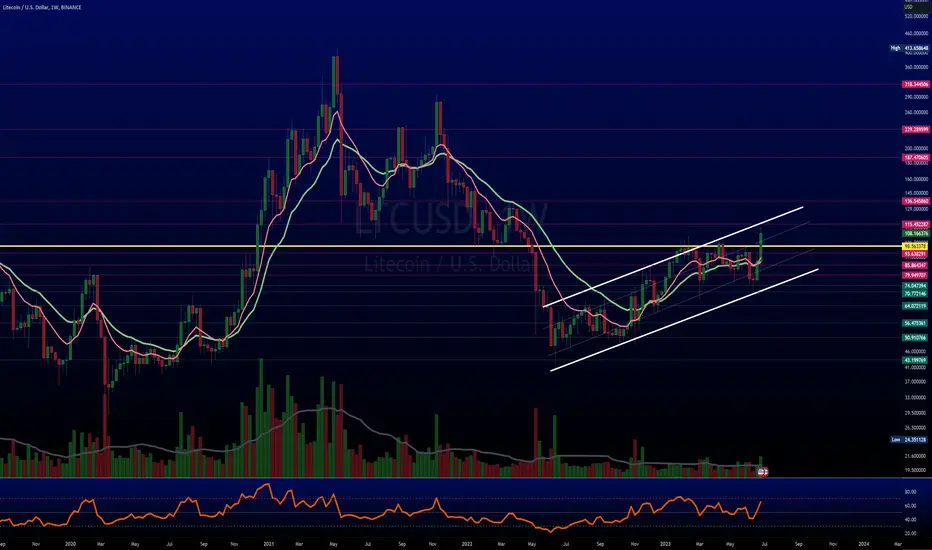
$LTC has been leading Crypto AltcoinsStill have spot CRYPTOCAP:LTC & not selling this for some time.
This, besides CRYPTOCAP:SHIB , is going to be a long term hold.
IMO this is likely to climb the top 10 & get closer, maybe even leapfrog, $ADA.
CRYPTOCAP:MATIC had the crown for a long time but it faded a while ago. The #altcoin leader is #LTC now.
Will reconsider selling some @ ATH but this is gone. Nice breakout at major resistance.
#crypto #litecoin
Bitcoin - another way out of the triangle - is it a trap?!Hello trader! Today I have a new idea for you. Like and subscribe to the channel, there is a lot of useful information.✅
I will slightly update yesterday's idea regarding the triangle.
Yesterday's swing can be said to have cut the triangle from both sides, there was an attempt to renew the maximum of 31455, but another ETF-related FUD interrupted this attempt and the price fell below $30,000.
At the moment, the price of the asset was able to recover and Bitcoin returned above $30,000 again and continues to consolidate in the range of $30,500-30350. Technical BTC has returned to the triangle again and there is a tightening to the upper border of the potturn, which may lead to another local takeaway towards $31,000.
But I also do not rule out that a new weekly candle will begin to form from a correction below $30,000, which is quite likely, and do not forget about the history associated with Binance, the SEC regulator and ETF, all this is still a big question, they often like to throw news after growth in 15-20% which has already happened.

ADA LongRevolut, a prominent digital investment bank, has made a surprising move by announcing the cessation of support for three major tokens — Cardano (ADA), Solana (SOL) and Polygon (MATIC). The news, revealed by esteemed crypto journalist Colin Wu, came to light after Revolut reportedly sent an email to its U.S. users, notifying them of the impending delisting.
Read more on U.Today u.today
