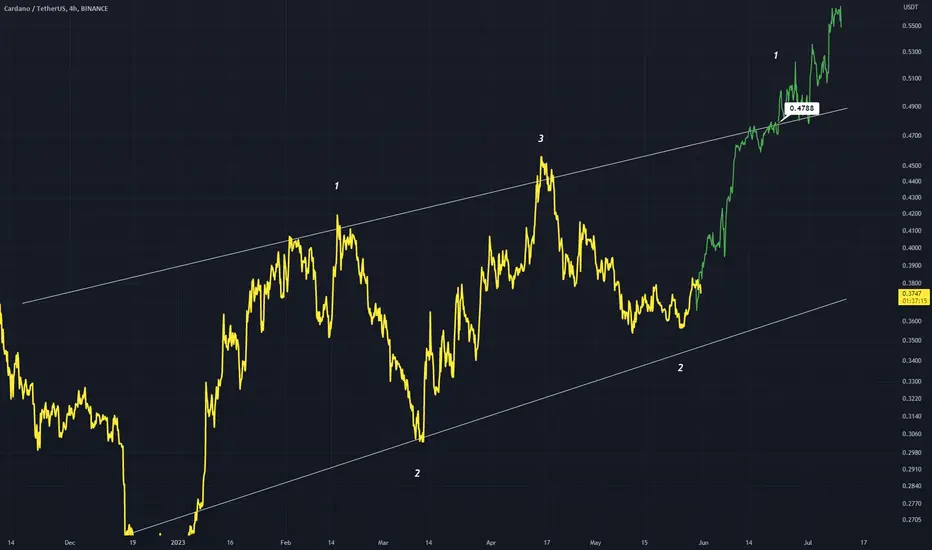
ADA thanks for playingADA fractal was on point. alts will continue to get smash until Q4. BTC topside liq grab next week for CPI
J-ADA

ADA...not this way! Not like this!If you find this info inspiring/helpful, please consider a boost and follow! Any questions or comments, please leave a comment! Also, check out the links in my signature to get to know me better!
This swift move down does not look great for the coin. Broke some pretty clear yuge levels, MO. So now for me its the waiting game. I could see either of these play out. But in the end I will be waiting for an nice impulse up and an internal retrace before an attempt at a long on this asset, I stll have my bags... wont be adding anymore to them atm.

ADA Cardano ADAUSDT Multiple cypher pattern in play,
my opinion is we will retest Head and shoulder trend line which aligns with cypher pattern

ADA/USDT 1DInterval Resistance and SupportHello everyone, let's look at the ADA vs USDT chart on a single day timeframe. As you can see, the price is moving below the local downtrend line.
Let's start with setting the support line and as you can see the first support in the near future is $0.30, if the support is broken then we can see a strong drop in the price around $0.21.
Now let's move to the resistance line, as you can see the first resistance is $0.34, if you break it, the next resistance will be $0.36, then you have a resistance zone of $0.38 to $0.39, then resistance at 0 $42.
Looking at the CHOP indicator, we see that the energy has been used, the MACD indicates that we are in a downtrend, while the RSI has crossed the lower limit of the range, which could potentially result in an uptrend reversal.

ADA/USDT 1DAY UPDATE BY CRYPTO SANDERSHello, welcome to this ADA/USDT update by CRYPTO SANDERS.
CHART ANALYSIS:- Cardano (ADA) plunged to a three-month low on Thursday, as traders remained nervous, following the recent U.S. Securities and Exchange Commission (SEC) lawsuits.
After a high of 0.3376 on Wednesday, ADA/USD dropped to a bottom at 0.3196 earlier in today’s session.
The drop pushed the token to its lowest level since March 15, when price was at a bottom of 0.3166.
this decline came as the relative strength index (RSI) moved deep into oversold territory, falling to a low below 30.00.
The index has since rebounded, and is tracking at 34.21, which is marginally above a key level of resistance at the 33.00 mark.
Should this upward momentum continue, bulls will look to recapture the 0.3500 level.
I have tried to bring the best possible outcome to this chart.
Hit the like button if you like it and share your charts in the comments section.
Thank you

ADAUSDT.1DMars Signals Team wishes you high profits*
This is a daily time frame analysis for ADAUSDT.1D
We are in daily time frame. What you see is the price swinging above the first support zone.
We have two scenarios in mind
Scenario 1: If you hold your price above our first support line, we expect price to rise to resistance areas.
Second scenario: If the price moves completely below our first support zone, we expect a drop to the second support zone.
Warning: This is just a suggestion and we do not guarantee profits. We advise you to analyze the chart before opening any positions.
Take care

Cardano non popular chart 💔Update:
Cardano non popular chart 💔
I HODL ADA for long-term
Looking on weekly chart without emotion and bias...
ADA might correct🔻much lower dear Crypto Nation
Even $0.095 or $0.053 would not be the end of future price gains - just Log-Fib
Let me know your thoughts in the comments🤗
⬇️⬇️⬇️
Likes and Follow for updates appreciated🤗
Disclaimer:
Not financial advice
Do your own research before investing
The content shared is for educational purposes only and is my personal opinion

ADAUSD Rejected Three Attempts to Break Key Support#ADAUSD bulls holding strong at the $0.38 demand zone after three consecutive attempts to break below. But that's not all, a recent breakout above the downtrend trendline has added fuel to the bullish pattern. This is a clear indication of complete bullish domination, and we're excited to see where it goes from here.
But we're not jumping in just yet. We need to see a daily close above the current resistance before making our move. And when that happens, we'll be on the lookout for a buy trade setup, targeting a potential 10-15% profit.
Stay tuned for updates on #ADA and other exciting coins as we continue to monitor the market for potential trading opportunities. This is a time to be bullish, and we're ready to ride the wave!

CARDANO - Catch This BIG Impulse!Cardano is setting up for a big impulse. We've recently seen the completion of wave 2 correction and broken out of that correction. We are now in bullish waters and seeing a nice deep retracement which is great news for us as we've got the bottom in place. This means the lower it goes, the better.
Trade idea:
- Safe entry on break of red trendline
- Stops below the bottom
- Targets: 1, 3, actively manage rest
Goodluck and as always, trade safe!

ETH - rebound from the countertrend lineHello trader Today I have prepared a new idea for you. Like and subscribe to the channel there is a lot of useful information✅
I will update the previous idea for ETH, then the entry point was + - the same and the price came exactly to the take profit of $1928.
At the moment, the asset has returned to the range from where I gave a long signal last time, let's try!
Technically, you can try to get a long position with a small % of the deposit (5-10%)
Today I already mentioned this chart on the channel, and as you can see, the support from the trend line works perfectly, but you shouldn’t rush and enter with one limit order or the market, it’s better to take a position with an additional one for another counter-trade confirmation.
Deal plan:
Entrance - 1835/1805/1777$
Stop - $1724
Take Profit - 2020$
P.S: I did not enter the deal myself, because the margin position for BTC is 25% TBX: $25,850

Cardano is looking for a SHORTHi guys, let's look at 1D price chart for Cardano.
If we look at 1D ADA chart we can see that the price being in big flat for the past 6 months.
There is strong resistance area at 0.4185 and strong support area at 0.3018. Between these two areas price is fluctuating for the past 6 months.
As I see it Cardano price is tending for short up to the support area at 0.3018.
Yesterday price touched another support level at 0.351 and from here correction is possible. But overall I think that price will go down to 0.3018 support area and even lower.
If this post is useful to you, you can support me with like/boost and advice in comments.

ADA 1D inverse H&SIn 1D chart, ADA has an inverse H&S pattern.
-
ADA broke through the neckline of 0.4218 and then fell back to the support trend line, and the EMA was entangled, which means that ADA is in a state of consolidation.
Before ADA falls below 0.2973, there is still a chance to reach the upper target:
0.4916
0.5131
0.5347
0.6045
-
Look at the 4 hr chart:
There are two bottoms near the support trend line, and if the price closes above 0.3801, the double bottom pattern is established.
Follow the goals above:
0.3924
0.3962
0.3999
0.4122
-

FUD - overflow with a big move?!Hello trader Today I have prepared a new idea for you. Like and subscribe to the channel there is a lot of useful information✅
Everyone has probably heard the news that the SEC has filed a lawsuit against the Binance crypto exchange
A few days ago CZ tweeted for support when he throws "4" again and what do we see now? That's right, CZ throws "4" on Twitter when the SEC sues his company It's me that again they created a situation for panic and pretend that everything is in order and there is nothing to be afraid of
Let's remember the situation on March 10 this year (just look at the chart), decoupling USDC from $, the collapse of the banking sector and a real panic sell in the market, in general, threw the strongest FUD before rising by +10,000 points. Now a similar situation is happening, they are scaring the crowd before a possible reversal.
As for my position:
As I said in the last post, if they drop below $26,000, then I will average my long, I got $25,650 for 5% of the deposit (25% in the position). Stop temporarily removed, I want to wait out the FUD.
Technical: the $25,200 level has not been touched yet, maybe we will get there soon, if you are going to take a position from there, be prepared for (squeeze) the price may drop a little lower by a few hundred points.

Bullish Divergence: ADAUSDT Journey Within the Symmetrical Wedge💎 Ladies and Gentlemen of ParadiseClub, exciting developments are underway for #ADAUSDT within the symmetrical wedge pattern!
💎 Our beloved #Cardano recently experienced an impressive bounce off the 327.2% and 61.8% Fibonacci support levels near the wedge's lower boundary. This precise rebound, accompanied by a bullish MACD divergence, emphasizes the significance of the current support.
💎 A break below this crucial level would have a significant impact on future price action. Conversely, if the support holds, we anticipate a potential move towards the upper boundary of the wedge.
💎 However, let's exercise caution as #Cardano is currently consolidating within this range. We eagerly await the breakout direction to guide our strategic moves. Stay tuned for more updates, Paradisers!

Analyzing the Shift in Sentiment for #ADAUSDT💎 In our previous analysis of #ADAUSDT, we highlighted the short-term upside potential as the price traded near the bottom of the range. Since then, we've witnessed the formation of a double bottom in the bearish zone, followed by a breakthrough to our projected resistance level.
💎 The sentiment has now clearly shifted towards a bullish outlook for #ADA. The price has not only broken above the previous higher high but also rejected our key support level at $0.36. Currently, the resistance level could potentially transform into support, as indicated by the potential rejection of the trendline.
💎 This is a critical moment for #ADA. If the trendline holds, it could mark the beginning of a significant upward swing. However, a break below the trendline may push the price back towards the key support, leading to further consolidation.
💎 It is essential for our ParadiseClub members to monitor this development closely. Should #ADA reenter the bearish zone, the probability of further downside movement will significantly increase. Stay informed and trade wisely, Paradisers! 🌴

Bitcoin - next week will be decisive!Hello trader Today I have prepared a new idea for you. Like and subscribe to the channel there is a lot of useful information✅
The standing of the price under the local resistance continues, and this, of course, makes me stop believing in further growth, but I continue to hold the Long position and adhere to the original plan.
Technical: nothing much has changed, the buyer again needs to return the price to the $27,500 zone to go above the local High $28,450 and I think this will be a quick takeaway, because we have already removed liquidity from below by going to $26,500, it's time to collect liquidity from above, so be prepared for next week's rally, and don't forget your risk management!

Trading Opportunities and Positive MomentumDuring the previous week, Cardano's price movements aligned precisely with the analysis. By surpassing the upper boundary of its descending channel within the 4-hour time frame, the price surged towards the resistance level of $0.3863. However, encountering this resistance prompted a corrective phase, leading the price to retrace back to the upper boundary of the breached channel. Notably, the Cardano chart exhibited responsiveness from both ends, allowing for short-term trading opportunities amid upward and downward fluctuations.
Significantly, a notable bullish candle emerged yesterday, demonstrating a 3.80% price increase and forming an Engulfing candlestick pattern on a support level. This development bodes well for Cardano's outlook. Nevertheless, a more substantial price growth is expected upon a complete breach of the aforementioned resistance. The potential for such a breakthrough remains intact as long as the lower boundary of the channel, situated around the $0.3485 range, remains intact.

ADA/USDT 1DAY UPDATE BY CRYPTO SANDERSHello, welcome to this ADA/USDT update by CRYPTO SANDERS.
CHART ANALYSIS:- Cardano (ADA) was one of Friday’s notable gainers, as the token snapped a key resistance level.
ADA/USD rose by as much as 3% in today’s session, hitting an intraday high of 0.3777 as a result.
This rally resulted in the 10-day (red) moving average crossing over its 25-day (blue) counterpart.
Typically such an upwards crossover signals the start of a bull run, and it comes as the relative strength index (RSI) also rose considerably.
the index is tracking at 50.91, which is marginally below a resistance level of 52.00.
In the event this ceiling is broken, there is a strong chance that ADA will move toward the 0.3800 mark.
I have tried to bring the best possible outcome to this chart.
Hit the like button if you like it and share your charts in the comments section.
Thank you

Cardano ADA and the US Debt CeilingNegotiators from Democratic and Republican parties finalized an agreement on Sunday night.
Instead of raising the limit to a specific level, they have opted to suspend it entirely until 2025. This strategic move ensures that their bills can be paid until that date, while also guaranteeing that the next battle to raise the ceiling will not coincide with the upcoming presidential election.
The resolution of the debt ceiling issue brings optimism and stability to the financial landscape, which has a positive ripple effect on the cryptocurrency market.
Bitcoin and the broader crypto market stand to benefit from increased investor confidence, reinforced safe-haven status, enhanced institutional adoption, regulatory clarity, and the overall positive impact on global markets.
ADA/USDT short
Entry Range: $0.35 - 0.37
Take Profit 1: $0.40
Take Profit 2: $0.43
Take Profit 3: $0.46
Stop Loss: $0.32

ADAUSDT - W Pattern Within ChannelADA is within a channel with a higher high top formed. A W pattern can form right now allowing a move up to (1) This is a bullish forecast with the price label attached. Lets see what happens.
✏️ CARDANO (ADA) : First SHORT then LONGAs you can see, after stabilizing in the range of 36 cents, the price of Cardano was accompanied by price growth and was able to increase the price up to 38 cents! Now, the range of 38 to 40 cents is an important supply zone , And in order to reach higher targets, breaking and stabilizing above this level is of great importance! 2 possible scenarios have been specified on the chart, and it is recommended that you monitor the mentioned zones !
Don't Forghet To Push The Boost (Like) Button and Follow me for More TA !
Best Regards , Arman Shaban


Cardano- i read many peoples complain about ADA on Twitter.
- Like the project is bad and going to nowhere.
- As Trader my job is only to do the Math and check pourcentages.
- i care about what peoples speak but i verify and deduct.
-----------------------------------------------------------------------------------------------------
So let me do Little Math for Cardano :
-----------------------------------------------------------------------------------------------------
- in 2018 if u bought ADA at Bottom ( 0.017$) you could have made +6500%
-- So if u invested 10k$ you could have returned $660,000
-----------------------------------------------------------------------------------------------------
- in 2020 ADA returned the same bottom level ( 0.017$) then made +16160%
-- So if u invested 10k$ you could have returned $1,626,000
-----------------------------------------------------------------------------------------------------
- So Now i don't think we gonna see again 0.017$ in entire Cardano Life.
- So haters gonna hate but Cardano made the Job.
- Just have to buy at the good time and be patient.
- if you bought the TOP, it's not Cardano fault, but your own fault!
- Next Target could be around 7.5$ (+3000%)
Happy Tr4Ding !
