J-ADA

Cardano- i read many peoples complain about ADA on Twitter.
- Like the project is bad and going to nowhere.
- As Trader my job is only to do the Math and check pourcentages.
- i care about what peoples speak but i verify and deduct.
-----------------------------------------------------------------------------------------------------
So let me do Little Math for Cardano :
-----------------------------------------------------------------------------------------------------
- in 2018 if u bought ADA at Bottom ( 0.017$) you could have made +6500%
-- So if u invested 10k$ you could have returned $660,000
-----------------------------------------------------------------------------------------------------
- in 2020 ADA returned the same bottom level ( 0.017$) then made +16160%
-- So if u invested 10k$ you could have returned $1,626,000
-----------------------------------------------------------------------------------------------------
- So Now i don't think we gonna see again 0.017$ in entire Cardano Life.
- So haters gonna hate but Cardano made the Job.
- Just have to buy at the good time and be patient.
- if you bought the TOP, it's not Cardano fault, but your own fault!
- Next Target could be around 7.5$ (+3000%)
Happy Tr4Ding !

CARDANO: WHEN MOON?As far as crypto goes, Cardano is one of my favourite projects, not because it has had the most insane price action or is the most
trendy or even has the best user experience... because it has none of those things... yet.
I really appreciate the philosophy behind the project,specially in light of the FTX collapse and Terra Luna de-peg.
They seem to understand that if you are building a completely novel and potentially revolutionary financial system that aims
at displacing our current financial system, that an endeavour this profound and revolutionary, should not only be done
with patience and caution but that if it is not done with patience and caution, the result could absolutely catastrophic
for all this involved and society in general.
The fact their getting their work peer reviewed and they are not rushing to market with their products and updates
is revolutionary in itself for a crypto project. Their recent inroad to the health care industry and the novel approach
of preventative medicine is another revolutionary act in our society today. It shouldn't be but it is when big pharma
has completely taken over health care and treatment with pharmaceuticals that treat symptoms rather than cause.
Why? Because there is far less profit in curing someone than there is in treating them. Society is in desperate need
of overhaul in several different industries and Cardano seems to be paving the way for practical ways of tackling
these issues and due to the gravity of most of these issues, they need to be approached methodically.
Finding solutions that are both economically sound and shed all the bureaucratic BS, wasteful spending,
violated social contracts, etc. is going to take a lot of time and cooperation between people and companies.
They are the only ones going about in the way that I would if I was the one who had the means of tackling
the issues they are tackling. I think that people will slowly start to appreciate the ground that they have already
gained and the milestones they are soon set to make.
Their commitment to decentralisation is another reason why I am really bullish on its future. I think with the hostility we
are seeing towards cryptos, this is going to increasingly become an important aspect to demand of digital assets.

ADA analysis (4H)Hi, dear traders. how are you ? Today we have a viewpoint to BUY/LONG the ADA symbol.
For risk management, please don't forget stop loss and capital management
When we reach the first target, save some profit and then change the stop to entry
Comment if you have any questions
Thank You

ADA/USDT 1DAY UPDATE BY CRYPTO SANDERSHello, welcome to this ADA/USDT update by CRYPTO SANDERS.
CHART ANALYSIS:- Cardano (ADA), was also in the green to start the weekend, with prices moving further away from a recent support level.
ADA/USD hit an intraday high of 0.3667 earlier in today’s session, which comes following a low of 0.3564 on Friday.
The move has resulted in Cardano climbing to its strongest point since Wednesday, moving away from the aforementioned floor at 0.3550 in the process.
ADA has begun to consolidate, with the price now retreating from its earlier highs, following a collision with a ceiling on the RSI.
Price strength has failed to move past a point of resistance of 44.00 which has pushed the token to a current reading of 0.3638.
I have tried to bring the best possible outcome to this chart.
Hit the like button if you like it and share your charts in the comments section.
Thank you

ADA will Lag and then catch up in a hurryEverything in crypto appears to be in a diagonal. Ada is no different. The angle of ADA's diagonal is less than BTC and most other cryptos. This means that ADA will probably not break 50cents before BTC has its first major correction of the cycle. But when BTC corrects ADA should actually fair better. After the correction, ADA will have its moment. I am short term long.

ETH - breakdown of the local countertrendHello trader Today I have prepared a new idea for you. Like and subscribe to the channel there is a lot of useful information✅
ETH continues to consolidate in the same range, creating small impulses towards the local countertrend line.
You can try to gain a position from the current values on the breakdown of the countertrend line by placing a grid of orders, 5% of the deposit.
Deal plan:
Entrance - 1820/1790/1770$
Stop - $1725
Take profit - $1900-1930 (0.5 level test)
I think there will probably be a small rollback before the trend line is broken, so it’s better not to risk much and take a position with an addition lower, you can arrange the grid in your own way to stronger levels from where the price can get a rebound.

ADA’s Uptrend is DangerSince December 22nd ADA is moving in an upward sloping channel. It has found support on the lower boundaries of the channel in March 9-12 and lately on May 8-15. Notice that ADA tends to leave wicks below the trendline.
ATM it is not clear if ADA will hold the channel support or fail. To be honest, much depends on BTC which is at resistance. Therefore, I have two scenarios, along and a short.
Long Scenario:
If ADA manages to find support above the 4HR EMA and above 0.3755 USD which is the local resistance.
Entry: 0.376
SL: Below channel support at approximately 0.362.
TP1: 0.42 (previous resistance).
TP2: 0.4579 (previous resistance).
TP3: 0.4728 (0.786 fib target).
Be aware that currently ADA is below the 50 EMA on the 4HR and the Daily.
Short Scenario:
Considering that ADA may lose channel support and that BTC is also below the 50EMA on the 4HR and the daily, this scenario is more likely IMO.
Entry: after a break and retest of the channel support at approximately 0.365
SL: above channel support and the 4HR EMA at 0.372
TP: at around 0.3 USD.
You will have to manage this short because much depends on the behavior of the market as a whole and BTC’s behavior in particular.
ATM I don’t expect ADA to drop below 0.3 USD, but as you can see there are a lot of imbalances (green boxes) below 0.3 USD. So, a wick below 0.3 USD is possible, if not likely.
Fun Fact: the previous cycle, bottom to bottom to ADA 70 days. If this cycle is similar the bottom is not far.
NFA
Would appreciate your feedback.
Best wishes to all.

Bitcoin fails local resistance againHello trader Today I have prepared a new idea for you. Like and subscribe to the channel there is a lot of useful information✅
Bitcoin bounced back from local resistance again and dropped below $27,000, which I said yesterday that in order to go higher, you need to keep local support above $27,200, but the buyer seems unable to do this yet, but the chances still remain.
While we are trading in this protracted sideways movement and have not updated the last LoW of $25,800, there is still a chance to return to the $27,500 range and gain a foothold higher for a hike to $30,000, plus a minus rate suggests that locally they may soon begin to take out short positions, so be careful if you hold a short marginal position.
I also noted a clear resistance on the chart (red line), I think that the next testing of the $27,500 mark will already be at a breakdown of the level, which can create a strong impulse to the next resistance through the channel at $28,500.
Well, as long as there is pressure on the market, I think they can lower it to 26,100 (-+) I wrote about this on Monday and was waiting for a test of this level...

Bitcoin - exit from the descending channel.Hello trader Today I have prepared a new idea for you. Like and subscribe to the channel there is a lot of useful information✅
Another interesting chart on the 8H timeframe is the formation of a descending channel.
I already wrote in the last post on BTC what you need to see the $30,000 mark, so I want to add more thoughts.
The price of bitcoin is now at the middle line of the channel, which is currently a temporary support, now it is most important that the buyer can keep the range of $27,200-27,000 and not fail it, then the middle line of the descending channel can push bitcoin to the important resistance of $28,650 (upper part formations).
While there are still chances for a bullish scenario, it remains to wait some more time and the matter is small...

ATOM - strong accumulation zone before space flight!Hello trader Today I have prepared a new idea for you. Like and subscribe to the channel there is a lot of useful information✅
Another interesting coin!
The first thing to note is that the asset price has been in accumulation for a long time for about 377 days, which is most often accompanied by a strong impulse when a major player appears.
Technical: the price is testing the trend line, which is currently a temporary support ($10.360). Everything seems to be good, but it is embarrassing that the pressure to the tread line is confusing, which can lead to a slight correction, as it was recently in bitcoin.
So far, I haven’t made any trading decisions on the coin, I want to watch for some more time, if suddenly there is a rebound without correction (from current values), then I will buy on the breakdown of the global countertrend double (5% of the deposit), and the first target will be $ 17.2 last local high.
But if suddenly the buyer cannot hold the support (trend line) and we see a correction below the current values, then the first area of interest will be $9.1-9.5. For now, I'm just waiting and watching the schedule.

Bitcoin broke into a bullish range again!Hello trader Today I have prepared a new idea for you. Like and subscribe to the channel there is a lot of useful information✅
Friends, I want to slightly update the previous idea from the technical side.
Last time, I warned that the opening of the week would most likely begin with a downward movement to the $26,150-26,500 zone, and the technical side of the trend line tightening signaled the same, we saw a breakdown and the price went down to the local support of $26,550.
At the moment, the price of bitcoin has again returned to the bullish range to the local support of $26,850-27200, from where it is trying to break through the local resistance of $27,550-27750, just what is needed in order to see further growth to $30,000
Well, this is not all that is needed for the cherished mark, after the breakdown of local resistance, it is important that the price be able to stay above the range of $27.550-27.750, and then if the buyer can hold the price, then we have another important resistance ahead of 28.760 (red line on the chart).
My bitcoin position unchanged:
Entrance - 26,280
Stop - $25,260
Target - $30-32k

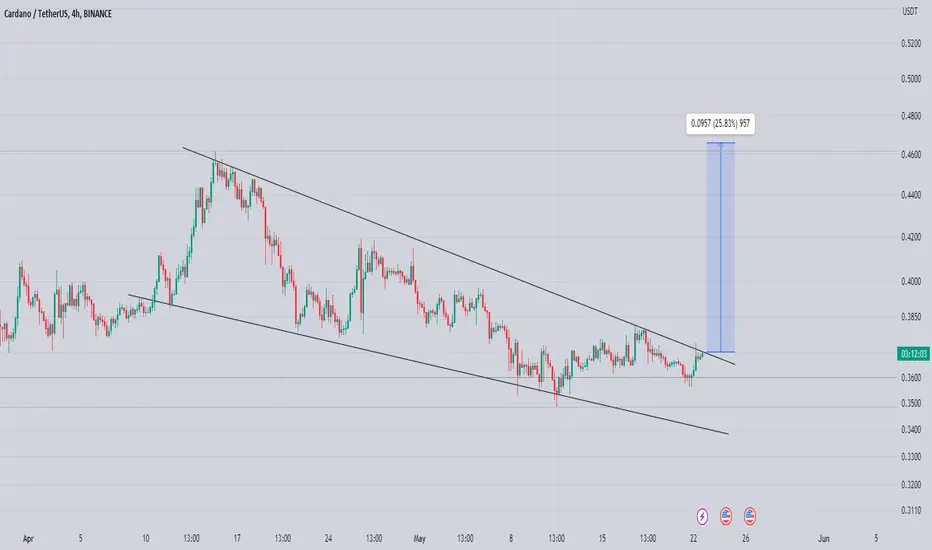
Cardano testing Crucial Area Formed & Breaking Falling Wedge In h4 Timeframe Incase Of breakout expecting Move towards 0.50$ Keep Eyes On Ada For Breakout
ADA/USDT 1DAY UPDATE BY CRYPTO SANDERSHello, welcome to this ADA/USDT update by CRYPTO SANDERS.
CHART ANALYSIS:- Cardano (ADA) ended a four-session losing streak on Monday.
After a low of 0.3573 on Sunday, ADA/USD rose by 2% today, reaching a high of 0.3732.
Today's price rebounded as the bulls rejected the breakout of a floor at the 0.3570 mark.
This coincided with consolidation at an important support point of the RSI, with price strength moving away from the 40.00 mark.
The index is now tracking at 44.29, with a higher range of 49.00 a potential target for the ADA bulls.
If this area is reached, there are relatively good chances that Cardano will trade above $0.3800.
I have tried to bring the best possible outcome to this chart.
Hit the like button if you like it and share your charts in the comments section.
Thank you

ADAUSD Is targeting 0.850 by the end of the year.Cardano (ADAUSD) is currently trading within the 1D MA200 (orange trend-line) and 1D MA50 (blue trend-line) for most of May. This consolidation is most likely the new Accumulation Phase for the next price jump and the reason is an old chart that we published last year, comparing the 2022/23 Cycle with 2018/19.
So far it has been remarkably similar, with the Bear Cycle being a decline of around -93% on both occasions, within a Channel Down pattern that bottomed on an Inverse Head and Shoulders. The first significant upside target in 2019 was the 0.5 Fibonacci retracement level. That is currently a little over 0.850 and since the Cycle has been following the previous one so closely so far, we see no reason not to continue to do so.
-------------------------------------------------------------------------------
** Please LIKE 👍, FOLLOW ✅, SHARE 🙌 and COMMENT ✍ if you enjoy this idea! Also share your ideas and charts in the comments section below! **
-------------------------------------------------------------------------------
💸💸💸💸💸💸
👇 👇 👇 👇 👇 👇

Cardano (ADA) is about to break down the support!Hello, everyone!
As you know, sometimes I can take the trade on BINANCE:ADAUSDT instead of Bitcoin. Today I am going to show you my thoughts about this asset, what we can wait in the nearest future.
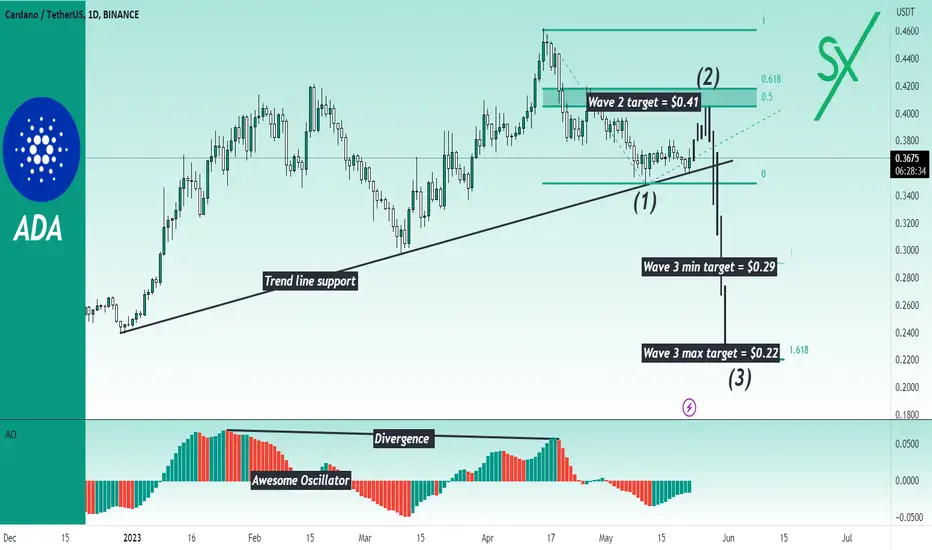
ADA demonstrated the bounce in the first half of 2023, formed the bearish divergence with the Awesome Oscillator. This is the clear sign, that it was just a correction to the downtrend impulse. I consider the final bearish wave which should be ended with the 5 waves cycle. If we suppose that wave 1 has been already formed, ended just at the support trend line, now we can expect the reactive wave 2. It has the target at 0.61 Fibonacci retracement, $0.41 .
This potential bounce could be the nice bull trap. The wave 3 which is going to follow this bounce can easily break the support line. It has two targets: $0.29 and $0.22 . My plan is to wait this bounce to open short trade.
Best regards, Ivan
_____________________________________
❤️Follow me and never miss the update❤️
ADA ANALYSISHi, dear traders. how are you ? Today we have a viewpoint to SELL/SHORT the ADA symbol.
For risk management, please don't forget stop loss and capital management
When we reach the first target, save some profit and then change the stop to entry
Comment if you have any questions
Thank You

Crypto Update: ADA gearing up for new push higher?Today's focus ADA
Pattern – HL support hold
Possible targets – .3550
Support – .3550
Resistance – .3665 - .3770
Looking at ADA today, we can see a few bullish signs coming into play. We have run over them in today's analysis, and the rejection signs we will also be looking out for. Effectively we want to see support continue to hold and feed a new rally. If we do see this, we would like to see a new test of resistance to show buyer strength and break of that level to start thinking the overall up trend is still in play.
Thanks for stopping by. Good trading, and have a great day.

ADAUSD - Trend LineA trend line that allows for a support to form.
The lower dashed line is just below the trend line which we have seen once before in the past.
Bars patterns placed shows my thoughts about price.
Right now is a pretty good long entry.

Hi, I see A very good Swing trade opportunityHi,
I see A very good Swing trade opportunity
Risk to reward is very convenient
Good luck Every one


Potential Trend Reversal at Crucial Support LevelLast week, ADA exhibited a range-bound pattern, and its price experienced a downward movement, reaching the lower resistance level of the previously broken range channel. Currently, there is a notable correction in the price of Cardano. Nevertheless, it is noteworthy that Cardano's price has shown a positive response of 9% upon reaching one of the recognized support levels, accompanied by an attempt to establish an upward trend within the daily timeframe. This suggests the potential for a favorable reaction within this support range. However, it is essential to consider the possibility that the previous support level may have been falsely breached. Specifically, the critical support level at $0.34 holds significant importance for Cardano. A positive reaction originating from this range could potentially lead to a shift in trend within the shorter timeframes and mark the conclusion of the correction within the longer timeframes. The chart provides indications for short-term and medium-term targets.

Bitcoin - the price is in the global channelHello trader Today I have prepared a new idea for you. Like and subscribe to the channel there is a lot of useful information✅
There is another option on the Bitcoin daily chart.
On the technical side, the price of the asset continues to move in an upward channel without confirming the lower border of the $25,250 pattern, which is currently the key zone for taking a Long position (red line on the chart) and most market participants are waiting for confirmation of this zone.
Well, it often happens that the market maker reverses without reaching the key level of several hundred points.
Time will tell how it will be this time and the liquidation of the Long position, if the price is still allowed to reach $25,000
