Bitcoin - exit from the triangle above $ 30,000Hi, the trader has prepared a new idea for you today. Put like and subscribe to the channel there a lot of useful information
Previously, Long gained a position from $ 28.250
I made a decision to fix part of the profit from the long position.
Tting: we have a pattern - a triangle for 12h the upper part is currently local resistance ($ 29.650) where can we get the seller’s reaction, if the price of Bitcoin can overcome the resistance, then we will most likely see a hike above $ 30,000, so I fix only part of the profit.
I will find 50% of the profit: I transfer $ 29.650 to $ 29.650 to the used. What I advise you to do.
All with a profit if also called from $ 28.250
J-ADA

ADAusdt 3D important Zone As we can see in the chart, if the important range is broken up, we will expect the price to increase. And if the trend line is broken, the downtrend will continue.
Its not Buy or Sell SIGNAL
DYOR
BY : M.TeriZ - @AtonicShark

ADA/USDT 1DAY UPDATE BY CRYPTO SANDERSHello, welcome to this ADA/USDT update by CRYPTO SANDERS.
CHART ANALYSIS:-Cardano formed a bearish head and shoulders formation, which is about to resolve soon. If confirmed, that would mean the price could break lower. ADA also lost 5.4% of its valuation this past week.
The key support at 38 cents is critical for this cryptocurrency as it will determine the price action in the weeks to come. The Bears appear to have the upper hand right now, but things could still go either way.
Looking ahead, expect volatility to increase as the price approaches the key support. If buyers cannot defend this critical level, then ADA could fall towards 35 cents next. The key resistance is at 41 cents should buyers suddenly return.
Hit the like button if you like it and share your charts in the comments section.
Thank you

ADA long road to sobriety. Notes on how I personally use my charts/NFA:
Each level L1-L3 and TP1-TP3 has a deployment percentage. The idea is to flag these levels so I can buy 11% at L1 , 28% at L2 and if L3 deploy 61% of assigned dry powder. The same in reverse goes for TP. TP1: 61%, TP2:28% and TP3:11%. If chart pivots between TP's, in-between or in Between Sell levels these percentages are still respected. I like to use the trading range to accumulate by using this tactic.
Just my personal way of using this. This is not intended or made to constitute any financial advice.
This is not intended or made to constitute any financial advice.
FED Macro Situation Consideration:
All TP's are drawn within the context of a return to FED neutral policy. I do not expect these levels to be reached before tightening is over.
NOT INVESTMENT ADVICE
I am not a financial advisor.
The Content in this TradingView Idea is for informational purposes only, you should not construe any such information or other material as legal, tax, investment, financial, or other advice. Nothing contained within this idea constitutes a solicitation, recommendation, endorsement, or offer to buy or sell any securities or other financial instruments in this or in in any other jurisdiction in which such solicitation or offer would be unlawful under the securities laws of such jurisdiction.
All Content on this idea post is information of a general nature and does not address the circumstances of any particular individual or entity. Nothing in the idea/post constitutes professional and/or financial advice, nor does any information on the idea/post constitute a comprehensive or complete statement of the matters discussed or the law relating thereto. You alone assume the sole responsibility of evaluating the merits and risks associated with the use of any information or other Content on the idea/post before making any decisions based on such information.

ADA 1D ViewThis is my view for the coming days, I don't have much description because I believe everything is clear on the chart.

🔥DOGE WILL PUMP BUT ONLY AFTER THIS: 3 LONG TARGETS FOR YOU🔥Hi, friends! DOGE is already not moving even when Elon writes about it. It seems like the whales are already sold it and wait until the price will fall lower to buy the coins from retail much cheaper.
📊 Now the price is squeezing to the trendline, so I expect 2 scenarios:
1. DOGE continues the growth
2. DOGE breaks down the trendline and falls to $0.072-0.078 important value area
The second scenario is much more probable for me because I expect BTC to fall lower. As you know, if BTC falls, so most altcoins fall as well.
✅ MY TARGETS FOR DOGE:
1. $ 0.10 - the key level
2. $ 0.11 - the key level and value area
3. $ 0.135 - the key level
💻Friends, press the "boost"🚀 button, write comments, and share with your friends - it will be the best THANK YOU.
P.S. Personally, I open an entry if the price shows it according to my strategy.
Always do your analysis before making a trade.

ADA (Y23.P2.Video1) a bullish case scenario to watch out forHi Traders,
If history repeats, we have a similar potential play so lets plan and if it plays accordingly, make the trade.
Please give me a like and share,
Regards,
S.SAri

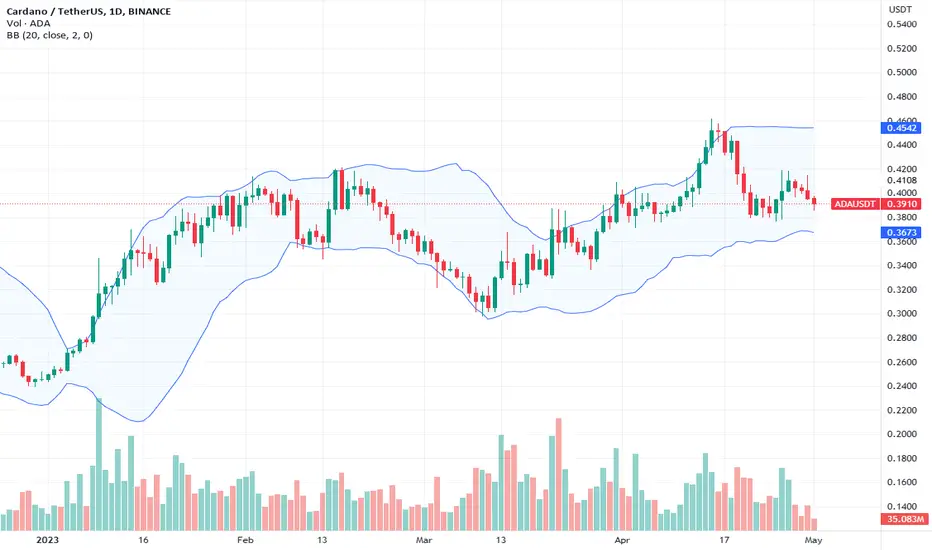
#Cardano Retracement after 50% Rally, Support at $0.37Past Performance of Cardano
The uptrend might still be valid, and ADA is up over 50% from mid-March, but the coin could further correct from recent peaks. Notice that the coin is lower, pulling back from last week's highs. The resistance line remains at $0.41, while support is at $0.37. Any comprehensive close above those lines will shape the immediate to medium-term formation.
#Cardano Technical Analysis
Trading volumes are decent, but ADA buyers still need to build on recent gains and edge above April 26 highs of $0.42. The current rejection of higher prices means bears of April 16 to 22 may flow back, forcing the coin towards $0.37 and even $0.30 in the sessions ahead. Traders may wait for a solid close, with expanding volumes, below $0.37 before engaging. This means they are aware that more gains above $0.41 may see ADA float back to $0.45 in a bull trend continuation formation.
What to Expect from #ADA?
ADA is in an uptrend but correcting after a solid performance from mid-March. As a bear flag prints in a short-term correction printed within a broader bull trend, traders should watch how prices react at $0.37. Losses may dent Cardano bulls' sentiment.
Resistance level to watch out for: $0.41
Support level to watch out for: $0.37
Disclaimer: Opinions expressed are not investment advice. Do your research.
ADA/USDT 1DAY UPDATEHello, welcome to this ADA/USDT update by CRYPTO SANDERS.
CHART ANALYSIS:-Cardano managed to hold onto a price above 40 cents, despite the most recent correction that saw it test the support at 38 cents. This also allowed ADA to book a minor increase in the price of 1.4% this week.
The biggest challenge for ADA is to move above 40 cents which is the key resistance at this time. If the overall market remains bullish, then this cryptocurrency could explore higher levels.
Looking ahead, Cardano is found in an uptrend, and so far, buyers have the upper hand. As long as they can defend the support at 38 cents, the price has a good chance to move higher over time.
Hit the like button if you like it and share your charts in the comments section.
Thank you

ADA: Channel UpCardano (ADA) technical analysis:
Trade setup : Price is in an Uptrend, trading in a Channel Up pattern. Likely to revisit the channel resistance trendline around $0.50, which also lines up the horizontal resistance zone. After 3x failed attempts, price finally broke above $0.40, indicating that buyers have soaked up all the supply from sellers and price could resume its Uptrend with upside to $0.50.
Pattern : Price is trading in a Channel Up pattern. With emerging patterns, traders who believe the price is likely to remain within its channel can initiate trades when the price fluctuates within its channel trendlines. With complete patterns (i.e. a breakout) – initiate a trade when the price breaks through the channel’s trendlines, either on the upper or lower side. When this happens, the price can move rapidly in the direction of that breakout.
Trend : Uptrend across all time horizons (Short- Medium- and Long-Term).
Momentum is Mixed as MACD Line is below MACD Signal Line (Bearish) but RSI ~ 50 (Neutral). MACD Histogram bars are rising, which suggests that momentum could be nearing another upswing.
Support and Resistance : Nearest Support Zone is $0.40, then $0.30. The nearest Resistance Zone is $0.50, then $0.60.

ADA/USDT 1DAY UPDATE BY CRYPTO SANDERSHello, welcome to this ADA /USDT 1DAY chart update by CRYPTOSANDERS.
I have tried to bring the best possible outcome to this chart.
CHART ANALYSIS:- Cardano (ADA) rose by as much as 9% on Wednesday, as bullish sentiment returned to cryptocurrency markets.
Following a low of 0.38 on Tuesday, ADA/USD raced to an intraday high of 0.4166 earlier in today’s session.
Today’s surge in price saw Cardano climb to its highest point in six days since the token was trading above a ceiling at 0.4200.
Looking at the chart, Wednesday’s move came as the relative strength index (RSI) broke free of a resistance level at 53.00.
At the time of writing, the index is now tracking at 55.12, with an upcoming ceiling of 58.00 a potential target for bulls.
Should this point be hit, it is possible that ADA will move back above its point above resistance.
This is not a piece of financial advice.
Hit the like button if you like it and share your charts in the comments section.
Thank you

Bitcoin - there is important resistance ahead!Hello trader Today I have prepared a new idea for you. Like and subscribe to the channel there is a lot of useful information✅
Past plan and my position in long:
Friends, the plan with a rebound from the local bottom has been completed, the buyer was able to keep the important support zone of HKEX:27 ,500 and the price again came to test HKEX:30 ,000, I wrote about this earlier. I have already fixed 50% of the profit from my long position and continue to hold the rest of the position up to an important resistance level.
Important bitcoin levels:
On the technical side: we have two resistances, a local HKEX:31 ,080 from where Bitcoin started its correction to the range of HKEX:27200 -27500 and there is a global resistance of 0.5 Fibonacci HKEX:32 ,500 from where a strong buyer may appear.
What does bitcoin need to keep going up?
Still an important support zone is the HKEX:28 ,000-28,500 range, the price is still close to this level, for a further trip to the HKEX:31 ,000-32,500 range, the buyer needs not to lose this support zone in a short time, but to stay afloat where we are at at the moment, otherwise we may expect a strong fall into the HKEX:25 ,000-24,000 zone
Test of an important Fibonacci level:
A test of the 0.5 fib level will be very important in order to understand the further direction vector in the future, there are two options: either we run into a strong buyer and catch a strong bounce down, or we stay in the 0.5 fib zone and continue to grow on HKEX:34 ,000-36,000
To all those who have gained Longs with a profit, do not forget about risk management!

ADA cup handle setupStop/ targets marked on chart. Enter partial position now. Add on breakout and retest of cup handle flat level

✴️ Cardano: Look Closer, The Potential is Huge | #OKXideasLet's go back to Cardano because this is one chart, one Altcoin, one pair that looks really good... Let's focus on the bigger picture and not just the short-term.
Notice on the left side of this chart, the black downtrend line... It has been broken.
When a trend is over, ends, a new trend develops.
As the bearish trend is over, a new bullish trend takes place.
Now, a bullish trend is not just one high or some growth for a few weeks or months... A bullish trend is defined by sustained higher highs and higher lows.
What this means is that we are set for growth.
Once we hit bottom, the only place left to go is up.
Cardano did hit bottom... We are very happy to see it recover and grow.
Namaste.

Bitcoin is out of an important range!Hello trader Today I have prepared a new idea for you. Like and subscribe to the channel there is a lot of useful information✅
LOCAL:
Technical on the 1H timeframe there was a breakdown of the local countertrend line, this may cause further growth to the important resistance level of HKEX:28 ,500
Let's hope that the HKEX:27 ,500 zone will remain the impetus for going to the HKEX:30 ,000-32,000 zone

AAVE - explode after breaking the trend line!!!Hello trader Today I have prepared a new idea for you. Like and subscribe to the channel there is a lot of useful information✅
I decided to buy #AAVE coins for spot 5% of the deposit.
▫️Technical: the asset is in a global downtrend, this can be seen from the global countertrend double line that fits well on the chart, I have identified an area of interest in the range of HKEX:69 -65 from where I am going to buy and buy more coins if the correction continues.
▫️The main buy setup is a breakdown of the global trend line, which in the future can create a strong impulse in the range of $100-125. Attention this is not financial advice, just sharing thoughts on the schedule.
---MY OPEN POSITIONS:
▪️BTC LONG - TBX HKEX:27 ,250 10% of deposit.
▪️ETH LONG - TVX - 1835$ 10% of the deposit
▪️ETC SPOT - TVX $18.85 15% of the deposit.
▪️TWT SPOT - TVX 1.1777$ 2% of the deposit.
▪️AAVE SPOT - 5% 68.5$ 5% of the deposit
▪️LEVER SPOT - TVX 0.0019$ 2% of the deposit.
▪️DOGE SPOT - TVX $0.08970 4% of the deposit.
Happy trading and good mood everyone :)

ADA / USDT daily chart ADA / USDT daily chart
2 different scenario shown by blue arrow
future depend on bitcoin
short scenario more possible at least to channel line

ADAUSDTADAUSDT
Thoughts
An inverted Head and Shoulders pattern has formed on the Cardano chart. The line of the right shoulder has already been broken and the impulse went up. Judging by the general situation on the market, it is worth considering opening short-term positions on the spot on ADA with the final target at 0.5542 (tp is set taking into account the development of the pattern on TA, we focus on the situation).
Here are some sample thoughts for those who want to enter a position on futures:
ADA long
Entry: up to 0.4225 (it is worth gaining only on a rollback to the shoulder line)
🔘Position addition: 0.4005
Shoulder: 5-10X
🟢Take-Profit: 0.4960 - 0.5552
🚫Stop: 0.3736
Focus strictly on your shoulders, do not forget to drag stops into boo and divide the margin to gain a position. Move stops with take calculation 25% - 50% - 75% -...
If you like the idea, don't forget to subscribe and rate like👍

🔥MATIC TRADING PLAN: EXPECT 30-45% PUMP WITH BULLISH BTC AS KEY🔥Hi, friends! I don't think that MATIC will update the local high at $ 1.57, but it has the power to make a local pump by 30-45%.
This is in line with my vision global vision on BTC that there will be one more pump before this local bull market will end.
📊 TRADING PLAN FOR MATIC:
1. false breakout of the trendline
2. the volume growth which in 70-80% confirms that the bottom is reached
3. bullish BTC is a must-have for altcoin growth
✅ THE MAIN TARGETS FOR MATIC:
🔥$ 1.25 - the ley level and local high
🔥$ 1.50 - the key level and even number which is usually the strong resistance/support
💻Friends, press the "boost"🚀 button, write comments, and share with your friends - it will be the best THANK YOU.
P.S. Personally, I open an entry if the price shows it according to my strategy.
Always do your analysis before making a trade.

Bitcoin is over if the buyer loses this zone!!!Hello trader Today I have prepared a new idea for you. Like and subscribe to the channel there is a lot of useful information✅
Friends, let's talk about bitcoin from the technical side and analyze the important areas, because at the moment many are interested in the question, is the correction over or is it just the beginning of a downward movement?
At the moment, the price of the asset is testing the important HKEX:27 ,350 zone, which is a very important support for bitcoin, if the buyer cannot hold this zone, then most likely we will see a continuation of the downward movement to the HKEX:25 ,200-23,800 zone, since there are traded volumes and the price is where linger.
So far, the week has not opened badly, above the previous Low of HKEX:27 ,150, which is positive and sets up the fact that the buyer will again be able to return the asset to the HKEX:28 ,500 zone and hold the price there to continue the upward movement.

BNB - Hike to your past "high"Hello trader Today I have prepared a new idea for you. Like and subscribe to the channel there is a lot of useful information✅
On the technical side: the asset is approaching a strong local resistance at 0.786 Fibonacci, from which we can expect a rebound to the local support level to the level of 0.618.
At the moment, you need to wait for confirmation of the local resistance of HKEX:338 , if the asset breaks through this price level, then it is also possible to exit the triangle and go to HKEX:400
The opening of the new week started very well, without the continuation of the market correction, let's hope that the buyer will become active in the market again and we will see a continuous growth! All successful trading.

#Ada | #Usdt#Signal | #ADA | #NUM_SV33
🛑Don’t risk more than 1% of your capital.
✳️Entry : > 0.3875~0.3895
⛔️Sl : 0.3775
🎯Tp 1 : 0.4023
🎯🎯Tp 2 : 0.4149
🎯🎯🎯Tp 3 : 0.4296
🎯🎯🎯🎯Tp 4 : 0.4359
🎯🎯🎯🎯🎯Tp 5 : 0.4551

LEVER - a coin that will give X?!Hello trader Today I have prepared a new idea for you. Like and subscribe to the channel there is a lot of useful information✅
▫️From the technical side: the price of the asset has broken through the local trend line, which may cause a continuation of the downward movement towards the important support of 0.618 Fibonacci ($0.0018-0.001750)
▫️I decided to buy a coin for 4% of the main deposit, 2% came from the current ($0.0019) and put up 2% interest for additional (0.001755$)
‼️Guys, pay special attention to such projects, try not to overestimate the risks on coins with a small capitalization, be careful!
