Bullish bounce off pullback support?EUR/CAD is falling towards the pivot, which acts as a pullback support that lines up with the 50% Fibonacci retracement and could bounce to the 1st resistance.
Pivot: 1.62239
1st Support: 1.61817
1st Resistance: 1.62991
Disclaimer:
The opinions given above constitute general market commentary and do not constitute the opinion or advice of IC Markets or any form of personal or investment advice.
Any opinions, news, research, analyses, prices, other information, or links to third-party sites contained on this website are provided on an "as-is" basis, are intended to be informative only, and are not advice, a recommendation, research, a record of our trading prices, an offer of, or solicitation for, a transaction in any financial instrument and thus should not be treated as such. The information provided does not involve any specific investment objectives, financial situation, or needs of any specific person who may receive it. Please be aware that past performance is not a reliable indicator of future performance and/or results. Past performance or forward-looking scenarios based upon the reasonable beliefs of the third-party provider are not a guarantee of future performance. Actual results may differ materially from those anticipated in forward-looking or past performance statements. IC Markets makes no representation or warranty and assumes no liability as to the accuracy or completeness of the information provided, nor any loss arising from any investment based on a recommendation, forecast, or any information supplied by any third party.
J-CAD

EUR/CAD - Bearish Flag (20.11.2025)🧠 Setup Overview TICKMILL:EURCAD
EUR/CAD is forming a clean Bearish Flag Pattern after a strong impulsive drop.
Price is trading below the EMA, inside a rising corrective channel — a classic continuation structure. With cloud resistance above and repeated rejections from the upper flag boundary, bearish momentum is building. A confirmed breakdown below the lower trendline could trigger the next bearish leg.
📊 Trading Plan🔻 Sell Bias (Primary Scenario)
Watch for a candle break & retest below the flag
Enter short after confirmation
🎯 Targets:
1st Support: 1.6137
2nd Support: 1.6109
❌ Invalidation:
A strong candle close above 1.6230 cancels the bearish view
⚡ Fundamental Outlook – Today (20 Nov 2025)
CAD Fundamentals
1️⃣ Canadian Dollar strengthened as crude oil prices saw a mild rebound, supporting CAD (commodity-linked currency).
2️⃣ Bank of Canada remains cautious, but no new signs of easing have emerged — giving CAD some underlying firmness.
EUR Fundamentals
3️⃣ Euro under pressure due to rate-cut expectations in early 2026 as European economic data remains soft, especially in manufacturing.
4️⃣ Risk-off sentiment pushes flows toward safer currencies, indirectly affecting EUR negatively.
➡️ Fundamentals support a continuation move lower for EUR/CAD.
#EURCAD #Forex #BearishFlag #PriceAction #TechnicalAnalysis #EUR #CAD #ForexTrader #TradingSetup #KABHI_TA_TRADING #ChartsDontLieTradersDontQuit #TradingViewCommunity #SupportAndResistance #BreakoutStrategy
⚠️ Disclaimer
This analysis is for educational purposes only.
Not financial advice — always use proper risk management.
💬 Support My Work ❤️
If this setup helps you:👍 LIKE the post💬 COMMENT your view🔔 FOLLOW for daily setups
Your support motivates me to keep posting high-quality analysis!

CADJPY – Update & ExecutionYesterday, our CADJPY position was stopped out at 111.65. The trend-changing pattern between Wave 3 and Wave 4 remains valid.
The wave that broke the Wave 3 structure extended beyond expectations, and price has now confirmed a breakdown with a second lower low on the M5 timeframe.
We have re-entered short at 111.94, with a stop loss at the high of the day (112.28).
Our target remains 110.92.

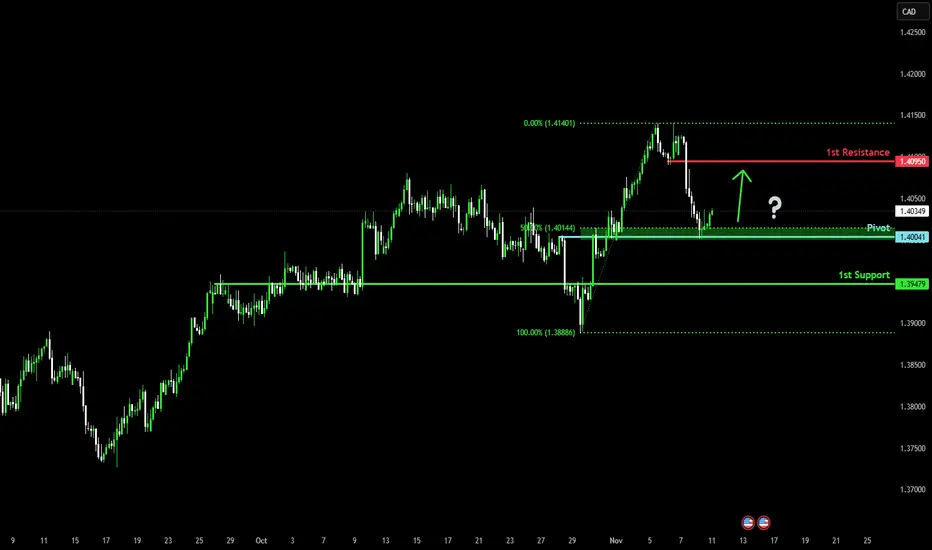
Bearish reversal off key resistance?Loonie (USD/CAD) has rejected off the pivot and could drop to the 1st support.
Pivot: 1.4068
1st Support: 1.4092
1st Resistance: 1.4092
Disclaimer:
The opinions given above constitute general market commentary and do not constitute the opinion or advice of IC Markets or any form of personal or investment advice.
Any opinions, news, research, analyses, prices, other information, or links to third-party sites contained on this website are provided on an "as-is" basis, are intended to be informative only, and are not advice, a recommendation, research, a record of our trading prices, an offer of, or solicitation for, a transaction in any financial instrument and thus should not be treated as such. The information provided does not involve any specific investment objectives, financial situation, or needs of any specific person who may receive it. Please be aware that past performance is not a reliable indicator of future performance and/or results. Past performance or forward-looking scenarios based upon the reasonable beliefs of the third-party provider are not a guarantee of future performance. Actual results may differ materially from those anticipated in forward-looking or past performance statements. IC Markets makes no representation or warranty and assumes no liability as to the accuracy or completeness of the information provided, nor any loss arising from any investment based on a recommendation, forecast, or any information supplied by any third party.

GBP/CAD - Triangle Breakout (17.11.2025)🧠 Setup Overview
GBP/CAD has broken below a symmetrical triangle, signaling a potential bearish continuation after repeated rejections from the upper trendline. The pair is now trading under the breakout level, with sellers showing strong control. If bearish momentum continues, the next support zones become key targets.
📊 Trading Plan 🔻 Bearish Scenario (Primary Bias)
Look for a clean breakdown retest and rejection for confirmation
Bearish continuation expected toward the support areas below
🎯 Targets:
1st Support: 1.8335
2nd Support: 1.8287
⚡ Fundamental Outlook — Today (17 Nov 2025)
GBP Sentiment – The Pound remains under pressure as markets expect the Bank of England to stay cautious, given ongoing inflation uncertainty and slowing economic data.
CAD Sentiment – The Canadian dollar stays supported by stable Bank of Canada policy and improving expectations around the energy sector.
– Rising US bond yields indirectly support CAD’s strength through its correlation with risk-on flows.
➡️ Overall: Fundamentals align with the bearish bias on GBP/CAD.
#GBPCAD #Forex #TechnicalAnalysis #TriangleBreakout #PriceAction #CAD #GBP #ChartPatterns #ForexTrader #TradingView #KABHI_TA_TRADING #ChartsDontLieTradersDontQuit #BearishSetup #MarketOutlook #FXMarket
⚠️ Disclaimer
This analysis is for educational purposes only and not intended as financial advice.
Always wait for confirmation and follow your risk management rules.
💬 Support My Work ❤️
If this helped you:
👍 LIKE, 💬 COMMENT, and 🔔 FOLLOW
Your support encourages more clean chart breakdowns & daily setups!

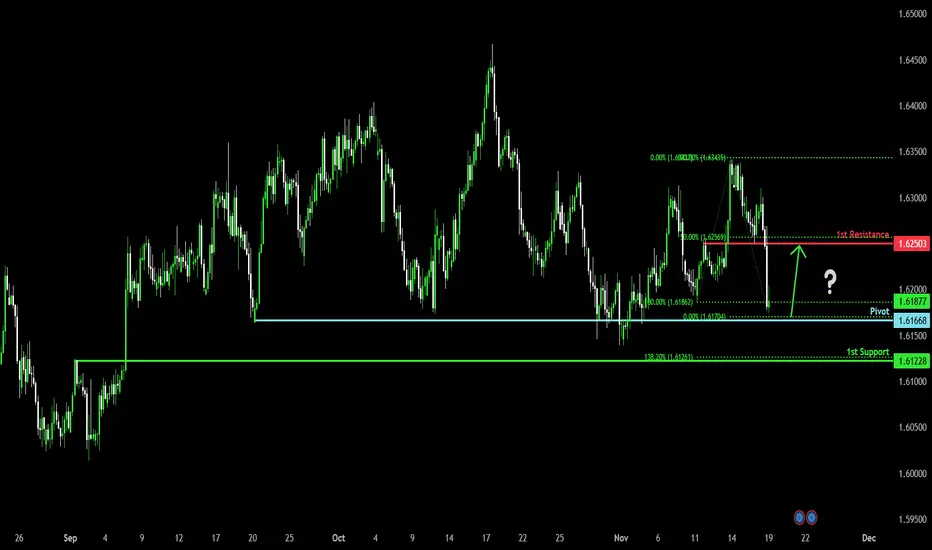
Bullish reversal setup?EUR/CAD is currently reacting off the pivot and could reverse to the 1st resistance.
Pivot: 1.61786
1st Support: 1.61228
1st Resistance: 1.62503
Disclaimer:
The opinions given above constitute general market commentary and do not constitute the opinion or advice of IC Markets or any form of personal or investment advice.
Any opinions, news, research, analyses, prices, other information, or links to third-party sites contained on this website are provided on an "as-is" basis, are intended to be informative only, and are not advice, a recommendation, research, a record of our trading prices, an offer of, or solicitation for, a transaction in any financial instrument and thus should not be treated as such. The information provided does not involve any specific investment objectives, financial situation, or needs of any specific person who may receive it. Please be aware that past performance is not a reliable indicator of future performance and/or results. Past performance or forward-looking scenarios based upon the reasonable beliefs of the third-party provider are not a guarantee of future performance. Actual results may differ materially from those anticipated in forward-looking or past performance statements. IC Markets makes no representation or warranty and assumes no liability as to the accuracy or completeness of the information provided, nor any loss arising from any investment based on a recommendation, forecast, or any information supplied by any third party.
Bullish momentum to extend?CAD/JPY is falling towards the pivot, which has been identified as a pullback support and could bounce to the 1st resistance, which aligns with the 100% Fibonacci projection.
Pivot: 110.59
1st Resistance: 112.07
1st Support: 109.83
Disclaimer:
The opinions given above constitute general market commentary and do not constitute the opinion or advice of IC Markets or any form of personal or investment advice.
Any opinions, news, research, analyses, prices, other information, or links to third-party sites contained on this website are provided on an "as-is" basis, are intended to be informative only, and are not advice, a recommendation, research, a record of our trading prices, an offer of, or solicitation for, a transaction in any financial instrument and thus should not be treated as such. The information provided does not involve any specific investment objectives, financial situation, or needs of any specific person who may receive it. Please be aware that past performance is not a reliable indicator of future performance and/or results. Past performance or forward-looking scenarios based upon the reasonable beliefs of the third-party provider are not a guarantee of future performance. Actual results may differ materially from those anticipated in forward-looking or past performance statements. IC Markets makes no representation or warranty and assumes no liability as to the accuracy or completeness of the information provided, nor any loss arising from any investment based on a recommendation, forecast, or any information supplied by any third party.

Bullish bounce off?EUR/CAD has bounced off the pivot whic acts as an overlap support and could rise to the 1st resistance.
Pivot: 1.62489
1st Support: 1.62177
1st Resistance: 1.63341
Disclaimer:
The opinions given above constitute general market commentary and do not constitute the opinion or advice of IC Markets or any form of personal or investment advice.
Any opinions, news, research, analyses, prices, other information, or links to third-party sites contained on this website are provided on an "as-is" basis, are intended to be informative only, and are not advice, a recommendation, research, a record of our trading prices, an offer of, or solicitation for, a transaction in any financial instrument and thus should not be treated as such. The information provided does not involve any specific investment objectives, financial situation, or needs of any specific person who may receive it. Please be aware that past performance is not a reliable indicator of future performance and/or results. Past performance or forward-looking scenarios based upon the reasonable beliefs of the third-party provider are not a guarantee of future performance. Actual results may differ materially from those anticipated in forward-looking or past performance statements. IC Markets makes no representation or warranty and assumes no liability as to the accuracy or completeness of the information provided, nor any loss arising from any investment based on a recommendation, forecast, or any information supplied by any third party.

USDCAD H4 | Heading Into 50% Fibonacci ResistanceMomentum: Bearish
Price is currently moving toward the sell entry level, positioned slightly above the 50% Fibonacci retracement.
Sell Entry: 1.4037
Pullback resistance
Aligned just above the 50% Fibonacci retracement
Stop Loss: 1.4096
Swing high resistance
Positioned slightly below the 78.6% Fibonacci retracement
Take Profit: 1.3982
Strong overlap support
Aligned with the 50% Fibonacci retracement
High Risk Investment Warning
Stratos Markets Limited (tradu.com ), Stratos Europe Ltd (tradu.com ):
CFDs are complex instruments and come with a high risk of losing money rapidly due to leverage. 70% of retail investor accounts lose money when trading CFDs with this provider. You should consider whether you understand how CFDs work and whether you can afford to take the high risk of losing your money.
Stratos Global LLC (tradu.com ): Losses can exceed deposits.
Please be advised that the information presented on TradingView is provided to Tradu (‘Company’, ‘we’) by a third-party provider (‘TFA Global Pte Ltd’). Please be reminded that you are solely responsible for the trading decisions on your account. Any information and/or content is intended entirely for research, educational and informational purposes only and does not constitute investment or consultation advice or investment strategy. The information is not tailored to the investment needs of any specific person and therefore does not involve a consideration of any of the investment objectives, financial situation or needs of any viewer that may receive it. Past performance is not a reliable indicator of future results. Actual results may differ materially from those anticipated in forward-looking or past performance statements. We assume no liability as to the accuracy or completeness of any of the information and/or content provided herein and the Company cannot be held responsible for any omission, mistake nor for any loss or damage including without limitation to any loss of profit which may arise from reliance on any information supplied by TFA Global Pte Ltd.

Bullish bounce off key support?Loonie (USD/CAD) is falling towards the pivot which has been identified as an overlap support and could bounce to the 1st resistance.
Pivot: 1.3920
1st Support: 1.3752
1st Resistance: 1.4138
Disclaimer:
The opinions given above constitute general market commentary and do not constitute the opinion or advice of IC Markets or any form of personal or investment advice.
Any opinions, news, research, analyses, prices, other information, or links to third-party sites contained on this website are provided on an "as-is" basis, are intended to be informative only, and are not advice, a recommendation, research, a record of our trading prices, an offer of, or solicitation for, a transaction in any financial instrument and thus should not be treated as such. The information provided does not involve any specific investment objectives, financial situation, or needs of any specific person who may receive it. Please be aware that past performance is not a reliable indicator of future performance and/or results. Past performance or forward-looking scenarios based upon the reasonable beliefs of the third-party provider are not a guarantee of future performance. Actual results may differ materially from those anticipated in forward-looking or past performance statements. IC Markets makes no representation or warranty and assumes no liability as to the accuracy or completeness of the information provided, nor any loss arising from any investment based on a recommendation, forecast, or any information supplied by any third party.

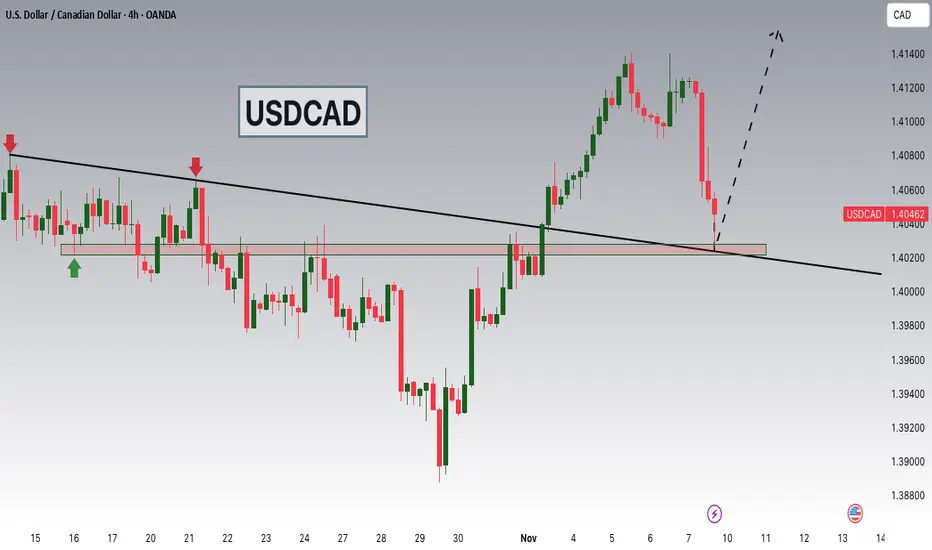
USD/CAD - Fundamental Drives (13.11.2025)🧠 Setup Overview OANDA:USDCAD
USD/CAD continues to face strong rejection from the resistance zone, with price failing multiple times to break above the 1.4020–1.4045 supply area.
The market structure remains bearish as the pair forms lower highs and struggles to sustain upside momentum.
With fundamentals also favoring CAD strength, the downside scenario remains more probable.
📊 Trading Plan🔻 Sell Bias
Look for bearish confirmation near or below the resistance zone
Continuation to the downside expected toward key support levels
🎯 Targets:
1st Support: 1.3969
2nd Support: 1.3950
🔰 Resistance Zone: 1.4020 – 1.4045
⚡ Fundamental Updates (Today – 13 Nov 2025)
1️⃣ Bank of Canada (BoC) signaled no further interest rate cuts, which strengthened the CAD.
• A stable or moderately hawkish BoC typically supports CAD appreciation.
2️⃣ US Treasury yields continue to fall as markets increase bets on the Federal Reserve easing policy in the coming months.
• Lower yields = weaker USD, helping push USD/CAD lower.
📌 High Impact Event Today:
USD - CPI (Inflation Rate) → A softer CPI reading could accelerate USD weakness.
#USDCAD #Forex #TechnicalAnalysis #PriceAction #ResistanceZone #FXMarket #FundamentalAnalysis #ChartPatterns #KABHI_TA_TRADING #ChartsDontLieTradersDontQuit #USD #CAD #TradingView #ForexSignals #BearishSetup #IntradayTrading
⚠️ Disclaimer
This analysis is for education only. It is not financial advice.
Always apply proper risk management and trade based on your own confirmation.
💬 Support My Work ❤️
If this analysis helps you —👉 LIKE 👍 👉 COMMENT 💬 👉 FOLLOW 🔔
Your support motivates more daily chart breakdowns and setups!

Bullish bounce off?Loonie (USD/CAD) has bounced off the pivot, which is a pullback support and could rise to the 1st resistance which has been identified as a pullback resitance that aligns witht he 78.6% FIbonacci retracement.
Pivot: 1.4019
1st Support: 1.3981
1st Resistance: 1.4092
Disclaimer:
The opinions given above constitute general market commentary and do not constitute the opinion or advice of IC Markets or any form of personal or investment advice.
Any opinions, news, research, analyses, prices, other information, or links to third-party sites contained on this website are provided on an "as-is" basis, are intended to be informative only, and are not advice, a recommendation, research, a record of our trading prices, an offer of, or solicitation for, a transaction in any financial instrument and thus should not be treated as such. The information provided does not involve any specific investment objectives, financial situation, or needs of any specific person who may receive it. Please be aware that past performance is not a reliable indicator of future performance and/or results. Past performance or forward-looking scenarios based upon the reasonable beliefs of the third-party provider are not a guarantee of future performance. Actual results may differ materially from those anticipated in forward-looking or past performance statements. IC Markets makes no representation or warranty and assumes no liability as to the accuracy or completeness of the information provided, nor any loss arising from any investment based on a recommendation, forecast, or any information supplied by any third party.

Bullish momentum to continue?EUR/CAD is reacting off the support level and could potentially rise from this zone toward our take-profit target.
Entry: 1.6317
Why we like it:
Price is pulling back into a well-defined support level.
Stop Loss: 1.6248
Why we like it:
It sits just below the pullback support, providing logical downside protection.
Take Profit: 1.6440
Why we like it:
This aligns with a previous swing-high resistance level.
Enjoying your TradingView experience? Review us!
Please be advised that the information presented on TradingView is provided to Vantage (‘Vantage Global Limited’, ‘we’) by a third-party provider (‘Everest Fortune Group’). Please be reminded that you are solely responsible for the trading decisions on your account. There is a very high degree of risk involved in trading. Any information and/or content is intended entirely for research, educational and informational purposes only and does not constitute investment or consultation advice or investment strategy. The information is not tailored to the investment needs of any specific person and therefore does not involve a consideration of any of the investment objectives, financial situation or needs of any viewer that may receive it. Kindly also note that past performance is not a reliable indicator of future results. Actual results may differ materially from those anticipated in forward-looking or past performance statements. We assume no liability as to the accuracy or completeness of any of the information and/or content provided herein and the Company cannot be held responsible for any omission, mistake nor for any loss or damage including without limitation to any loss of profit which may arise from reliance on any information supplied by Everest Fortune Group.

USD/CAD Hints at Swing LowA simple setup may have emerged for USD/CAD bulls. A bullish outside day formed around a support cluster on Thursday, which includes the 1.40 handle, monthly pivot point and weekly VPOC. It also posted a daily close above its 20-day EMA.
The 1-hour chart shows a bullish divergence formed on the RSI (14) ahead of yesterday's rally, with price action displaying a falling wedge (bullish reversal) into the cycle lows.
Bulls could seek dips towards the 1.4005 high-volume node (HVN) and initially target the weekly pivot point (1.4062), a break above which brings the 1.41 handle into focus.
A break beneath the cycle lows invalidates the near-term bullish bias.
Matt Simpson, Market Analyst at City Index.

Bearish drop off?EUR/CAD has rejected the pivot level, which serves as a pullback resistance, aligning with the 50% Fibonacci retracement. The pair could potentially drop toward the first support, which coincides with a previous swing low.
Pivot: 1.62489
1st Support: 1.61407
1st Resistance: 1.63091
Disclaimer:
The opinions given above constitute general market commentary and do not constitute the opinion or advice of IC Markets or any form of personal or investment advice.
Any opinions, news, research, analyses, prices, other information, or links to third-party sites contained on this website are provided on an "as-is" basis, are intended to be informative only, and are not advice, a recommendation, research, a record of our trading prices, an offer of, or solicitation for, a transaction in any financial instrument and thus should not be treated as such. The information provided does not involve any specific investment objectives, financial situation, or needs of any specific person who may receive it. Please be aware that past performance is not a reliable indicator of future performance and/or results. Past performance or forward-looking scenarios based upon the reasonable beliefs of the third-party provider are not a guarantee of future performance. Actual results may differ materially from those anticipated in forward-looking or past performance statements. IC Markets makes no representation or warranty and assumes no liability as to the accuracy or completeness of the information provided, nor any loss arising from any investment based on a recommendation, forecast, or any information supplied by any third party.

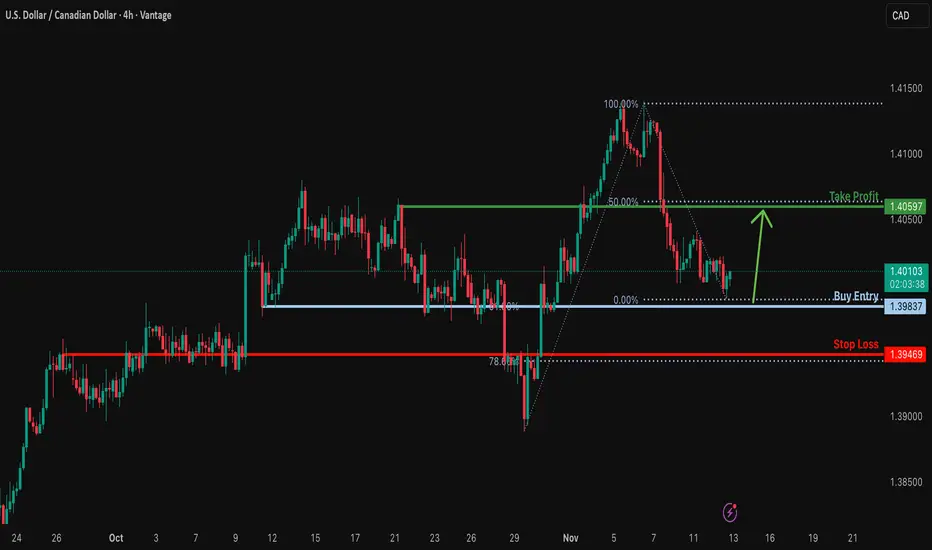
Bullish bounce off key support?USD/CAD is falling towards a support level, which is an overlap support that aligns with the 61.8% Fibonacci retracement. The pair could potentially bounce from this level toward our take-profit target.
Entry: 1.3983
Why we like it:
There is an overlap support that aligns with the 61.8% Fibonacci retracement level.
Stop Loss: 1.3946
Why we like it:
This level coincides with an overlap support and the 78.6% Fibonacci retracement, providing additional confluence.
Take Profit: 1.4059
Why we like it:
There is a pullback resistance that aligns with the 50% Fibonacci retracement level.
Enjoying your TradingView experience? Review us!
Please be advised that the information presented on TradingView is provided to Vantage (‘Vantage Global Limited’, ‘we’) by a third-party provider (‘Everest Fortune Group’). Please be reminded that you are solely responsible for the trading decisions on your account. There is a very high degree of risk involved in trading. Any information and/or content is intended entirely for research, educational and informational purposes only and does not constitute investment or consultation advice or investment strategy. The information is not tailored to the investment needs of any specific person and therefore does not involve a consideration of any of the investment objectives, financial situation or needs of any viewer that may receive it. Kindly also note that past performance is not a reliable indicator of future results. Actual results may differ materially from those anticipated in forward-looking or past performance statements. We assume no liability as to the accuracy or completeness of any of the information and/or content provided herein and the Company cannot be held responsible for any omission, mistake nor for any loss or damage including without limitation to any loss of profit which may arise from reliance on any information supplied by Everest Fortune Group.
GBP/CAD Rejection at Supply → Next Stop: 1.8350📉 GBP/CAD Analysis – Rising Wedge Breakdown in Motion
GBP/CAD has broken down from a Rising Wedge formation, signaling a potential bearish continuation. Price rejected strongly from the Key Zone (≈1.8550–1.8580), followed by a break + retest of the supporting trendline.
If downside pressure holds, we may see price move toward the Key Zone near 1.8350 (psychological level).
🔎 Technical Insights
✅ Rising Wedge breakdown confirms bearish structure
✅ Retest of support-turned-resistance
✅ Momentum shifting lower
🎯 Downside target → 1.8350 (Key Zone)
A clean continuation move could unfold if sellers sustain control below current structure.
🌍 Fundamental Outlook
• The Bank of Canada (BoC) remains cautious as inflation pressures ease, reducing expectations for aggressive tightening…supportive for CAD strength.
• The Bank of England (BoE) faces slower growth and uncertain monetary outlook, limiting GBP momentum.
• Softer UK business activity + Canada’s stable macro backdrop may help fuel further decline.
Overall fundamentals reinforce bearish sentiment on GBP/CAD.
✅ Support this analysis with a
LIKE 👍 | COMMENT 💬 | FOLLOW 🔔
Your engagement keeps the content flowing!
⚠️ Disclaimer:
This outlook is for educational purposes only. It is not financial advice. Please conduct your own analysis before trading.

Bearish drop off?EUR/CAD has rejected at the pivot and could drop to the 1st support, which acts as swing low support.
Pivot: 1.6249
1st Support: 1.61407
1st Resistance: 1.63091
Disclaimer:
The opinions given above constitute general market commentary and do not constitute the opinion or advice of IC Markets or any form of personal or investment advice.
Any opinions, news, research, analyses, prices, other information, or links to third-party sites contained on this website are provided on an "as-is" basis, are intended to be informative only, and are not advice, a recommendation, research, a record of our trading prices, an offer of, or solicitation for, a transaction in any financial instrument and thus should not be treated as such. The information provided does not involve any specific investment objectives, financial situation, or needs of any specific person who may receive it. Please be aware that past performance is not a reliable indicator of future performance and/or results. Past performance or forward-looking scenarios based upon the reasonable beliefs of the third-party provider are not a guarantee of future performance. Actual results may differ materially from those anticipated in forward-looking or past performance statements. IC Markets makes no representation or warranty and assumes no liability as to the accuracy or completeness of the information provided, nor any loss arising from any investment based on a recommendation, forecast, or any information supplied by any third party.

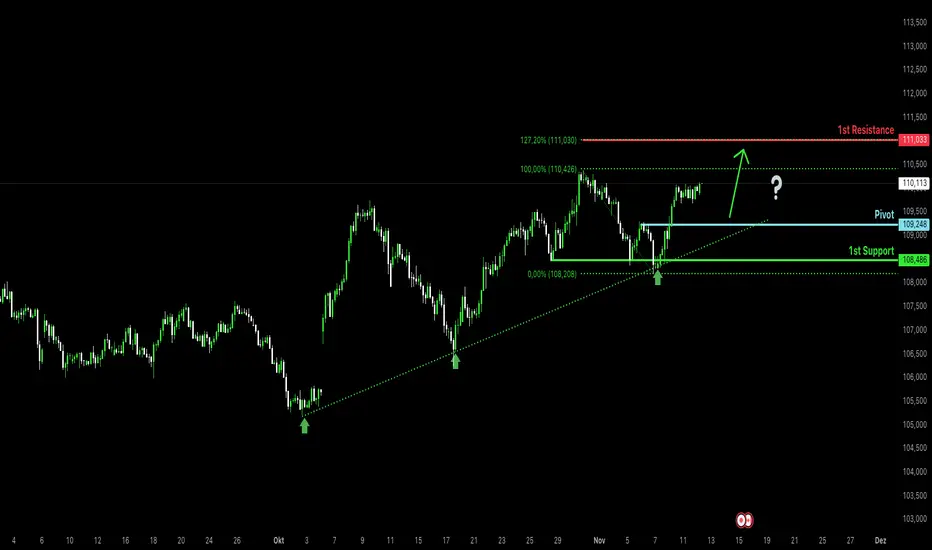
Bullish momentum to extend?CAD/JPY is declining toward the pivot level, which has been identified as a pullback support. A rebound from this area could target the first resistance level, aligning with the 127.2% Fibonacci extension.
Pivot: 109.24
1st Support: 108.8
1st Resistance: 111.03
Disclaimer:
The above opinions given constitute general market commentary, and do not constitute the opinion or advice of IC Markets or any form of personal or investment advice.
Any opinions, news, research, analyses, prices, other information, or links to third-party sites contained on this website are provided on an "as-is" basis, are intended only to be informative, is not an advice nor a recommendation, nor research, or a record of our trading prices, or an offer of, or solicitation for a transaction in any financial instrument and thus should not be treated as such. The information provided does not involve any specific investment objectives, financial situation and needs of any specific person who may receive it. Please be aware, that past performance is not a reliable indicator of future performance and/or results. Past Performance or Forward-looking scenarios based upon the reasonable beliefs of the third-party provider are not a guarantee of future performance. Actual results may differ materially from those anticipated in forward-looking or past performance statements. IC Markets makes no representation or warranty and assumes no liability as to the accuracy or completeness of the information provided, nor any loss arising from any investment based on a recommendation, forecast or any information supplied by any third-party.
Bullish reversal?Loonie (USD/CAD) has bounced off the pivot and could rise to the 1st resistance, which acts as a pullback resistance.
Pivot: 1.4004
1st Support: 1.3947
1st Resistance: 1.4095
Disclaimer:
The above opinions given constitute general market commentary, and do not constitute the opinion or advice of IC Markets or any form of personal or investment advice.
Any opinions, news, research, analyses, prices, other information, or links to third-party sites contained on this website are provided on an "as-is" basis, are intended only to be informative, is not an advice nor a recommendation, nor research, or a record of our trading prices, or an offer of, or solicitation for a transaction in any financial instrument and thus should not be treated as such. The information provided does not involve any specific investment objectives, financial situation and needs of any specific person who may receive it. Please be aware, that past performance is not a reliable indicator of future performance and/or results. Past Performance or Forward-looking scenarios based upon the reasonable beliefs of the third-party provider are not a guarantee of future performance. Actual results may differ materially from those anticipated in forward-looking or past performance statements. IC Markets makes no representation or warranty and assumes no liability as to the accuracy or completeness of the information provided, nor any loss arising from any investment based on a recommendation, forecast or any information supplied by any third-party.
USDCAD Breakout and Potential RetraceHey Traders, in tomorrow's trading session we are monitoring USDCAD for a buying opportunity around 1.40250 zone, USDCAD was trading in a downtrend and successfully managed to break it out. Currently is in a correction phase in which it is approaching the retrace area at 1.40250 support and resistance area.
Trade safe, Joe.
Bearish drop off?The Loonie (USD/CAD) has rejected the pivot level, which is acting as pullback resistance, and could decline toward the overlap support that aligns with the 38.2% Fibonacci retracement.
Pivot: 1.4148
1st Support: 1.3911
1st Resistance: 1.4301
Disclaimer:
The above opinions given constitute general market commentary, and do not constitute the opinion or advice of IC Markets or any form of personal or investment advice.
Any opinions, news, research, analyses, prices, other information, or links to third-party sites contained on this website are provided on an "as-is" basis, are intended only to be informative, is not an advice nor a recommendation, nor research, or a record of our trading prices, or an offer of, or solicitation for a transaction in any financial instrument and thus should not be treated as such. The information provided does not involve any specific investment objectives, financial situation and needs of any specific person who may receive it. Please be aware, that past performance is not a reliable indicator of future performance and/or results. Past Performance or Forward-looking scenarios based upon the reasonable beliefs of the third-party provider are not a guarantee of future performance. Actual results may differ materially from those anticipated in forward-looking or past performance statements. IC Markets makes no representation or warranty and assumes no liability as to the accuracy or completeness of the information provided, nor any loss arising from any investment based on a recommendation, forecast or any information supplied by any third-party.

Bearish drop off?USD/CAD could rise to he resistance level, which is a pullback resistance and could reverse from this level to our take profit.
Entry: 1.4069
Why we like it:
There is a pullback resistance level.
Stop loss: 1.4139
Why we like it:
There is a swing high resistance level.
Take profit: 1.3982
Why we like it:
There is a pullback support level that aligns with the 61.8% Fibonacci retracement.
Enjoying your TradingView experience? Review us!
Please be advised that the information presented on TradingView is provided to Vantage (‘Vantage Global Limited’, ‘we’) by a third-party provider (‘Everest Fortune Group’). Please be reminded that you are solely responsible for the trading decisions on your account. There is a very high degree of risk involved in trading. Any information and/or content is intended entirely for research, educational and informational purposes only and does not constitute investment or consultation advice or investment strategy. The information is not tailored to the investment needs of any specific person and therefore does not involve a consideration of any of the investment objectives, financial situation or needs of any viewer that may receive it. Kindly also note that past performance is not a reliable indicator of future results. Actual results may differ materially from those anticipated in forward-looking or past performance statements. We assume no liability as to the accuracy or completeness of any of the information and/or content provided herein and the Company cannot be held responsible for any omission, mistake nor for any loss or damage including without limitation to any loss of profit which may arise from reliance on any information supplied by Everest Fortune Group.
