EURUSDHello Traders! 👋
What are your thoughts on EURUSD?
EUR/USD has bounced strongly from the identified support zone and has now broken above the descending trendline, holding firmly above it .
In the current area, we expect some short-term consolidation, followed by a continued move higher toward the next resistance levels.
A breakout above 1.166 would act as a key confirmation signal, suggesting continuation of the bullish trend and opening the path toward higher targets.
As long as the price remains above the ascending trendline, the bullish scenario remains valid.
Don’t forget to like and share your thoughts in the comments! ❤️
J-DXY

TRADINGVIEW — NY SESSION UPDATELondon pushed the Dollar into 99.591, but DXY remains inside yesterday’s structure.
Compression unchanged.
Yields softer into NY — 10Y −1.11%, 2Y −1.27% — defensive tone with no directional commitment.
ES reclaimed the 6655.50 London low and trades back inside its range.
Gold steady above 4019.57.
Volatility stable.
NY opens into a tight Dollar and softer yields.
First expansion sets the tone.
— CORE5DAN
Institutional Logic. Modern Technology. Real Freedom.

EUR/USD Bearish Setup – 1hEUR/USD 15M Analysis:
Price is approaching marked seller zones. Expecting a potential retracement toward 1.15897–1.15986 before a bearish rejection. A clean break below 1.15832 could open the path toward 1.15728 and lower levels. Watching market structure, liquidity sweep, and bearish order blocks for confirmation. This is a technical outlook, not financial advice.

PRE-LONDON CONDITIONS — DXY Range-Bound, Yields Slide, ES HeavyU.S. Dollar Index (DXY) holds a tight 98.99–99.59 range in a third consecutive inside bar.
U.S. 10-year yield drops ~1.01% in Asia.
U.S. 2-year yield falls ~1.27%.
S&P 500 futures (ES) extend lower toward the 6.571 fractal.
Gold tests support after filling imbalance.
Volatility remains elevated.
DXY — Dollar Index
Dollar stays inside 98.991–99.591.
Inside-bar stack remains unbroken.
Price sits near the 0.6 premium zone.
Neutral until London breaks the range.
Yields — 10Y & 2Y
10Y yield: -1.01% in Asia → long-end compression.
2Y yield: -1.27% → dovish policy tone.
Curve: both ends lower → risk-off positioning.
ES — S&P 500 Futures
ES moves lower toward 6.571.
Yesterday’s high-volatility expansion continues.
Tone remains defensive.
Gold — Safety Premium
Gold fills imbalance and presses into support.
Break = active safety flows.
Hold = passive bid.
Volatility
VIX closed pre-London.
Futures hold elevated regime.
Conditions favor fast intraday expansions.
Calendar Risk
Medium-tier data ahead.
Yesterday’s partial data production repeats → limited visibility.
Expect flow-driven moves until major prints arrive.
Execution View
DXY bias neutral inside range.
Yields down + ES down = risk-off.
Gold support = key inflection.
London expansion outside 98.99–99.59 sets direction.
Trade second move, not first spike.
Summary:
Dollar trapped. Yields lower. ES heavy. Gold at support.
Fragile pre-London environment; London’s first expansion defines the session.
— CORE5DAN
Institutional Logic. Modern Technology. Real Freedom.

DXY FRGNT Daily Forecast - Q4 | W47| D18 | Y25 |📅 Q4 | W47| D18 | Y25 |
📊 DXY FRGNT Daily Forecast
🔍 Analysis Approach:
I’m applying Smart Money Concepts, focusing on:
Identifying Points of Interest on the Higher Time Frames (HTFs) 🕰️
Using those POIs to define a clear trading range 📐
Refining those zones on Lower Time Frames (LTFs) 🔎
Waiting for a Break of Structure (BoS) for confirmation ✅
This method allows me to stay precise, disciplined, and aligned with the market narrative, rather than chasing price.
💡 My Motto:
"Capital management, discipline, and consistency in your trading edge."
A positive risk-to-reward ratio, paired with a high win rate, is the backbone of any solid trading plan 📈🔐
⚠️ Losses?
They’re part of the mathematical game of trading 🎲
They don’t define you — they’re necessary, they happen, and we move forward 📊➡️
🙏 I appreciate you taking the time to review my Daily Forecast.
Stay sharp, stay consistent, and protect your capital
— FRNGT 🚀
TVC:DXY

Stop!Loss|Market View: EURUSD🙌 Stop!Loss team welcomes you❗️
In this post, we're going to talk about the near-term outlook for the EURUSD currency pair☝️
Potential trade setup:
🔔Entry level: 1.15351
💰TP: 1.14184
⛔️SL: 1.15903
"Market View" - a brief analysis of trading instruments, covering the most important aspects of the FOREX market.
👇 In the comments 👇 you can type the trading instrument you'd like to analyze, and we'll talk about it in our next posts.
💬 Description: The main scenario for selling via a breakout of the 1.15500 - 1.16000 support area remains. The USD is gaining momentum and is likely to continue strengthening in the medium term. Against this backdrop, a shorter-term sell-off is being looked for. The lows from early this week serving as a potential sell entry point. Downside targets are considered as low as 1.14000.
Thanks for your support 🚀
Profits for all ✅

EUR/USD - Ascending Triangle (17.11.2025)🧠 Setup Overview TICKMILL:EURUSD
EUR/USD has formed an ascending triangle, but instead of breaking upward, price failed at the horizontal resistance and slipped below the rising trendline — signaling potential bearish reversal. The pair is rejecting the 1.1650–1.1660 supply zone, and downside momentum is building as fundamentals shift in favor of USD strength.
📊 Trading Plan🔻 Bearish Scenario (Primary Bias)
Look for trendline retest rejection for confirmation
Expect continuation to the downside toward key support zones
🎯 Targets:
1st Support: 1.1581
2nd Support: 1.1561
🔰 Resistance Zone: 1.1650 – 1.1660
⚡ Fundamental Updates (Today – 17 Nov 2025)
1️⃣ Fed officials remain cautious about easing policy due to persistent inflation risks.
• This reduces the chances of a near-term rate cut → USD strengthens.
2️⃣ U.S. government bond yields rise as investors move into safer assets during stock market weakness.
• Higher yields = stronger USD → bearish pressure on EUR/USD.
These fundamentals align with the technical breakdown, supporting further downside.
#EURUSD #Forex #TechnicalAnalysis #PriceAction #AscendingTriangle #BearishSetup #USD #EUR #FundamentalAnalysis #ForexSignals #TradingView #KABHI_TA_TRADING #ChartsDontLieTradersDontQuit #FXMarket #TrendlineBreak #SupplyZone
⚠️ Disclaimer
This is not financial advice.All content is for educational purposes only. Always confirm signals and apply strict risk management before entering trades.
💬 Support My Work ❤️
If this analysis helps you —
👍 Like 💬 Comment 🔔 Follow
Your support motivates me to post more daily setups & clean chart analysis!

DXY firmed between the hawkish Fed and Waller call of cuts.
The dollar strengthened despite the contrast between the Fed’s overall hawkish tone and Waller’s support for rate cuts.
Cleveland Fed President Hammack noted that policy must remain somewhat restrictive to bring inflation back to target, while St. Louis Fed President Musalem also emphasized that any policy easing should proceed cautiously.
In contrast, Fed Governor Waller said he is not concerned about a renewed acceleration in inflation and argued that several months of labor-market softness justify additional rate cuts. He added that tariffs are unlikely to have a lasting impact on inflation and that restrictive policy is increasingly weighing on the economy, particularly on lower- and middle-income households.
DXY briefly tested the support at 99.30 before climbing above both EMAs. The converging EMAs indicate a potential shift toward a bullish trend.
If DXY closes above both EMAs, the index may advance toward 99.80.
Conversely, if DXY breaks below both EMAs and 99.30, the index could retreat toward the next support at 99.00.

Looking for the Sweep leading into a bigger Play! Price bled lower through the entire Asian session after yesterday’s late breakdown, continuing the move away from the prior value area. We’re now trading inside a cluster of intraday inefficiencies with clean liquidity sitting below at 4013 and the psychological 4000 level.
My focus going into London and NY is patience.
Asia’s slow descent is typically a continuation phase, not the actual entry. I want to see:
A sweep of 4013 or 4000
A clear displacement reaction
A retrace back into a fresh M5–M15 FVG
Then structure confirming continuation or reversal
Until that happens, this remains a bearish environment with untested Weekly imbalance still below. If buyers don’t defend 4013 with force, the algo will likely reach for the 4000 liquidity pocket next.
Staying reactive, not predictive.
London will reveal whether this breakdown continues or sets the trap for a reversal.

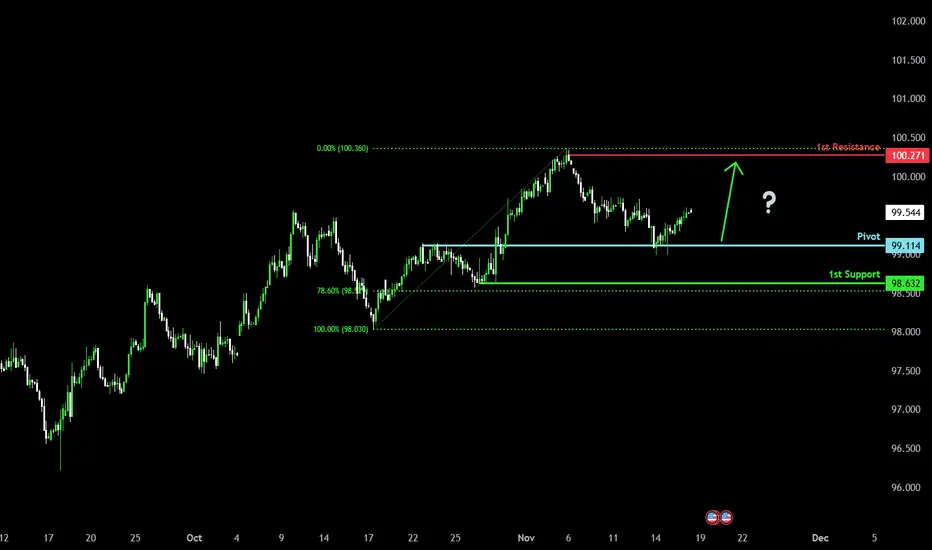
Bullish momentum to extend?US Dollar Index (DXY) has bounced off the pivot, which is a pullback support, and could potentially rise to the 1st resistance.
Pivot: 99.11
1st Support: 98.63
1st Resistance: 100.27
Disclaimer:
The opinions given above constitute general market commentary and do not constitute the opinion or advice of IC Markets or any form of personal or investment advice.
Any opinions, news, research, analyses, prices, other information, or links to third-party sites contained on this website are provided on an "as-is" basis, are intended to be informative only, and are not advice, a recommendation, research, a record of our trading prices, an offer of, or solicitation for, a transaction in any financial instrument and thus should not be treated as such. The information provided does not involve any specific investment objectives, financial situation, or needs of any specific person who may receive it. Please be aware that past performance is not a reliable indicator of future performance and/or results. Past performance or forward-looking scenarios based upon the reasonable beliefs of the third-party provider are not a guarantee of future performance. Actual results may differ materially from those anticipated in forward-looking or past performance statements. IC Markets makes no representation or warranty and assumes no liability as to the accuracy or completeness of the information provided, nor any loss arising from any investment based on a recommendation, forecast, or any information supplied by any third party.
Trading Idea: DXY — Potential Reversal PointsTrading Idea: DXY — Potential Reversal Points
Technical Overview
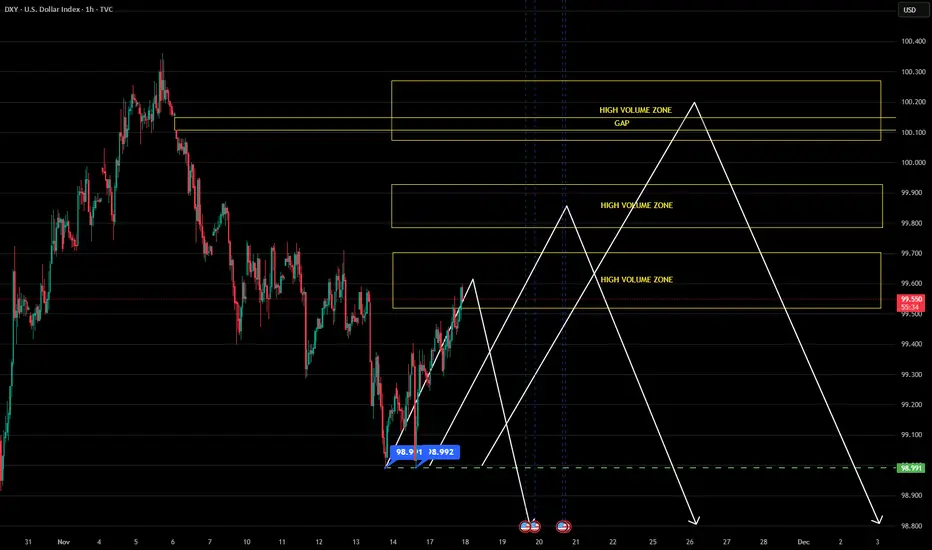
The Dollar Index has formed a significant resistance level, from which price has moved toward the first high-volume zone. The chart highlights three potential areas of volume concentration, each capable of acting as a reaction point.
Key Zones
Zone 1 — The nearest high-volume area, serving as the first potential support level.
Zone 2 — An intermediate volume accumulation area.
Zone 3 — The most compelling zone, featuring an unfilled gap. The presence of this gap creates an additional price magnet, as markets tend to fill price gaps over time.
Trading Scenario
The primary hypothesis anticipates price movement toward the third high-volume zone with the objective of filling the gap. This area is expected to produce the strongest reaction and potential reversal.
However, monitoring price behavior in the first two zones remains essential. A clear bounce with confirmation could indicate an earlier conclusion to the downward movement.
Risk Management
Wait for price reaction in each designated zone and seek confirming signals before entering a position. While the unfilled gap in the third zone increases the probability of price reaching that level, it does not guarantee a reversal.
PRE-LONDON CONDITIONS — 17 Nov 2025I. Market Environment
Dollar: Neutral overnight. No directional pressure in Asia.
Yields: US10Y and US2Y stable — policy expectations unchanged.
Risk: Equities firm but stretched. Volatility elevated from Friday.
Focus: Light session before a heavy macro week.
Liquidity: Cautious, headline-sensitive.
II. Six-Chart Snapshot
(All structural notes shown on your chart image — not repeated in text.)
III. Cross-Asset Signals
Yields keep the Dollar capped.
Equities supported but fragile.
Gold softer despite elevated volatility.
Flows lean cautious.
Global risk = neutral-to-defensive.
IV. Core Drivers
• Dollar behavior inside a neutral environment
• Yield stability across the curve
• Equity sensitivity with elevated volatility
• London open → London fix → U.S. session flow
V. Execution Notes — PEM Logic
Follow higher-timeframe direction
Ignore early-session noise
Wait for structure + flow alignment
Act only on confirmation
Summary
Neutral Dollar, stretched risk, elevated volatility — London opens in a cautious, event-driven environment.
— CORE5DAN
Institutional Logic. Modern Technology. Real Freedom.

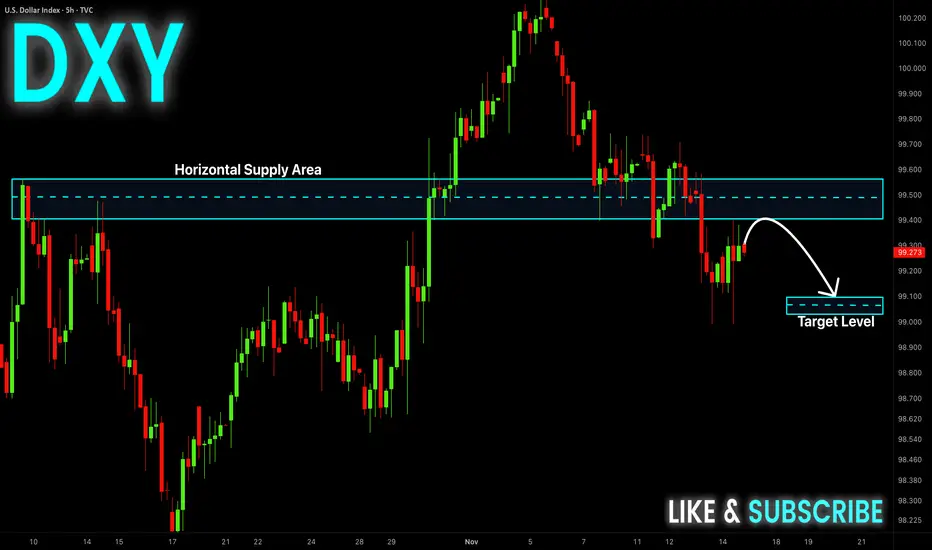
DXY Will Go Lower! Short!
Please, check our technical outlook for DXY.
Time Frame: 5h
Current Trend: Bearish
Sentiment: Overbought (based on 7-period RSI)
Forecast: Bearish
The market is approaching a significant resistance area 99.554.
Due to the fact that we see a positive bearish reaction from the underlined area, I strongly believe that sellers will manage to push the price all the way down to 99.097 level.
P.S
We determine oversold/overbought condition with RSI indicator.
When it drops below 30 - the market is considered to be oversold.
When it bounces above 70 - the market is considered to be overbought.
Like and subscribe and comment my ideas if you enjoy them!

AUDUSD FRGNT Daily Forecast -Q4 | W47| D17 | Y25 |📅 Q4 | W47| D17 | Y25 |
📊 AUDUSD FRGNT Daily Forecast
🔍 Analysis Approach:
I’m applying Smart Money Concepts, focusing on:
Identifying Points of Interest on the Higher Time Frames (HTFs) 🕰️
Using those POIs to define a clear trading range 📐
Refining those zones on Lower Time Frames (LTFs) 🔎
Waiting for a Break of Structure (BoS) for confirmation ✅
This method allows me to stay precise, disciplined, and aligned with the market narrative, rather than chasing price.
💡 My Motto:
"Capital management, discipline, and consistency in your trading edge."
A positive risk-to-reward ratio, paired with a high win rate, is the backbone of any solid trading plan 📈🔐
⚠️ Losses?
They’re part of the mathematical game of trading 🎲
They don’t define you — they’re necessary, they happen, and we move forward 📊➡️
🙏 I appreciate you taking the time to review my Daily Forecast.
Stay sharp, stay consistent, and protect your capital
— FRNGT 🚀
OANDA:AUDUSD

DXYU.S Dollar Index
- Completed " 12345 " Impulsive Waves and " AB " Corrective Wave
- Break of Structure
- Demand Zone
- Order Block
- Change of Characteristics

DXY FRGNT Daily Forecast -Q4 | W47| D17 | Y25 |📅 Q4 | W47| D17 | Y25 |
📊 DXY FRGNT Daily Forecast
🔍 Analysis Approach:
I’m applying Smart Money Concepts, focusing on:
Identifying Points of Interest on the Higher Time Frames (HTFs) 🕰️
Using those POIs to define a clear trading range 📐
Refining those zones on Lower Time Frames (LTFs) 🔎
Waiting for a Break of Structure (BoS) for confirmation ✅
This method allows me to stay precise, disciplined, and aligned with the market narrative, rather than chasing price.
💡 My Motto:
"Capital management, discipline, and consistency in your trading edge."
A positive risk-to-reward ratio, paired with a high win rate, is the backbone of any solid trading plan 📈🔐
⚠️ Losses?
They’re part of the mathematical game of trading 🎲
They don’t define you — they’re necessary, they happen, and we move forward 📊➡️
🙏 I appreciate you taking the time to review my Daily Forecast.
Stay sharp, stay consistent, and protect your capital
— FRNGT 🚀
TVC:DXY

Gold Week Opens Inside Daily FVG — Will We Drop Into the Weekly New week, and Gold opened inside last week’s Daily FVG, which was fully rebalanced.
No confirmation yet that this zone will act as support. The larger unmitigated Weekly FVG below may still be the draw on liquidity before any bullish move develops.
Plan for tonight:
Let Asia define the range
Watch for a sweep during London
Bearish continuation is favored if we break today’s open level (4174.9)
Bullish only if Asia low → sweep → displacement → retrace
Levels marked.
Patience. Let the algo show its hand.
#Futures #GC #Gold #FVG #ICT #SmartMoney #DayTrading #NOFOMO

EUR/USD – Falling Wedge Breakout | Bulls Eye Key Resistance ZoneTICKMILL:EURUSD The EUR/USD Pair , Price has been trading within a Wedge Pattern on the H1 chart, forming consistent higher highs and higher lows. Price action is now testing the upper boundary of the Pattern, signalling a possible breakout.
✅Market Context:
1️⃣Strong Upward Structure Inside the Pattern.
2️⃣Buyers are showing strength near Resistance.
3️⃣Breakout above the Trendline indicates Momentum continuation toward higher zones.
✅Trade Plan:
Entry: Buy after Confirmed Breakout above the Resistance (H1 candle close above trendline or retest of the breakout).
💰Take Profit (TP): At the Key Zone – a Major Resistance area identified ahead.
🛑Stop Loss (SL): Below the Pattern Structure.
🟢 Technical Outlook:
Pattern: Falling Wedge (Bullish Reversal)
Confirmation: Breakout & Retest
Targets: 1.1650 → 1.1770
Support Zone: 1.1500 – 1.1450
Momentum: Bullish bias gaining strength
✅Psychological Discipline :
1️⃣Stick to plan – No Revenge Trades.
2️⃣Accept losing trades as Part of the Strategy.
3️⃣Risk only 1–2% of your account balance per trade.
📊 Fundamental View:
The Euro is gaining momentum after recent comments from ECB officials indicating cautious optimism around inflation stability. Meanwhile, the USD faces mild pressure as traders anticipate possible rate cuts by the Federal Reserve in the coming months. Market sentiment currently favors risk assets, giving EUR/USD short-term upside potential.
✅ Support this analysis with a
LIKE 👍 | COMMENT 💬 | FOLLOW 🔔
It helps a lot & keeps the ideas coming!
⚠️ Disclaimer: This analysis is for educational purposes only and does not constitute financial advice. Forex trading involves high risk. Trade only with capital you can afford to lose and always do your own research.

Gold | Oil | Dollar | Silver | Natural Gas Price ForecastGold | Oil | Dollar | Silver | Natural Gas Price Forecast
NYMEX:NG1! NYMEX:CL1! COMEX:SI1! COMEX:GC1!

BITCOIN 2025 - MAKE OR BREAKBTC is coiling. Liquidity is tightening. Momentum is fading. The market is soon to decide whether we break higher toward the next resistance leg… or lose key support and trigger a broader correction.
Two key dates stand out: November 6 and November 17.

Bullish bounce off key support?The US Dollar Index (DXY) is declining toward the pivot level and may rebound toward the 1st resistance.
Pivot: 98.67
1st Support: 97.85
1st Resistance: 100.07
Disclaimer:
The opinions given above constitute general market commentary and do not constitute the opinion or advice of IC Markets or any form of personal or investment advice.
Any opinions, news, research, analyses, prices, other information, or links to third-party sites contained on this website are provided on an "as-is" basis, are intended to be informative only, and are not advice, a recommendation, research, a record of our trading prices, an offer of, or solicitation for, a transaction in any financial instrument and thus should not be treated as such. The information provided does not involve any specific investment objectives, financial situation, or needs of any specific person who may receive it. Please be aware that past performance is not a reliable indicator of future performance and/or results. Past performance or forward-looking scenarios based upon the reasonable beliefs of the third-party provider are not a guarantee of future performance. Actual results may differ materially from those anticipated in forward-looking or past performance statements. IC Markets makes no representation or warranty and assumes no liability as to the accuracy or completeness of the information provided, nor any loss arising from any investment based on a recommendation, forecast, or any information supplied by any third party.

DXY Will Fall! Sell!
Hello,Traders!
DXY price taps into a clean supply block, creating a shift in order flow as liquidity above the highs gets swept. A corrective push toward the next demand pocket is likely. Time Frame 5H.
Sell!
Comment and subscribe to help us grow!
Check out other forecasts below too!
Disclosure: I am part of Trade Nation's Influencer program and receive a monthly fee for using their TradingView charts in my analysis.
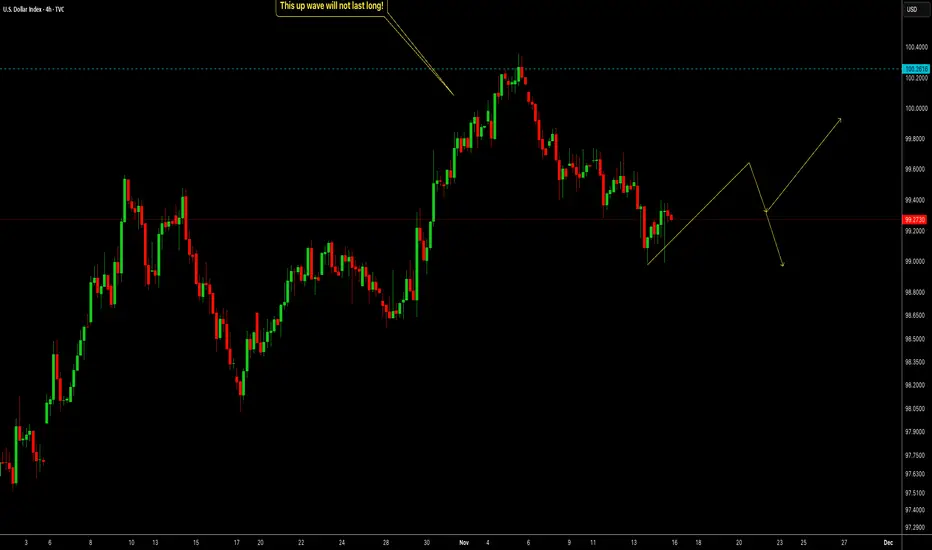
DXY - Short-Term Bounce, But the Bigger Drop Isn’t Done YetThe Dollar Index is forming a small corrective up-move on the 4H chart. This current rise still looks weak and is unlikely to last long. As long as price stays below the major zones above, the broader structure suggests one more push lower before any meaningful bullish reversal.
Short-term volatility is expected, but the higher-timeframe pressure remains to the downside. We’ll be watching for a final drop to complete the structure before the next big move.
Disclosure: We are part of Trade Nation's Influencer program and receive a monthly fee for using their TradingView charts in our analysis.