BUY DXYIn todays session we will be taking buys on the dollar. Our entry is at 97.677 and stops are below 97.480 targets are above 98.40. Use proper risk management.
J-DXY

EURUSD, GBPUSD and DXY Analysis todayHello traders, this is a complete multiple timeframe analysis of this pair. We see could find significant trading opportunities as per analysis upon price action confirmation we may take this trade. Smash the like button if you find value in this analysis and drop a comment if you have any questions or let me know which pair to cover in my next analysis.

Fibonacci confluence signals bullish reversalUS Dollar Index (DXY) is falling towards the pivot and could bounce to the 1st resistance.
Pivot: 97.17
1st Support: 96.75
1st Resistance: 97.86
Disclaimer:
The above opinions given constitute general market commentary, and do not constitute the opinion or advice of IC Markets or any form of personal or investment advice.
Any opinions, news, research, analyses, prices, other information, or links to third-party sites contained on this website are provided on an "as-is" basis, are intended only to be informative, is not an advice nor a recommendation, nor research, or a record of our trading prices, or an offer of, or solicitation for a transaction in any financial instrument and thus should not be treated as such. The information provided does not involve any specific investment objectives, financial situation and needs of any specific person who may receive it. Please be aware, that past performance is not a reliable indicator of future performance and/or results. Past Performance or Forward-looking scenarios based upon the reasonable beliefs of the third-party provider are not a guarantee of future performance. Actual results may differ materially from those anticipated in forward-looking or past performance statements. IC Markets makes no representation or warranty and assumes no liability as to the accuracy or completeness of the information provided, nor any loss arising from any investment based on a recommendation, forecast or any information supplied by any third-party.

BTCUSD outlook and walkthrough. 9/9/2025, MondayBITSTAMP:BTCUSD
CSD model. Expansion. Retracement Market Profile

DXY Analysis – Are Bad News Already Priced In?Since Trump entered the White House, the U.S. Dollar has taken a hard hit against its major counterparts, losing more than 10% overall.
But looking closer at the chart, we see a different story: since the April low around 97.80, the DXY has been stuck in a range-bound pattern, with the exception of July’s dip that was quickly reversed.
Lately, the USD has faced strong headwinds:
• Two weak NFP reports in a row.
• The Fed hinting at rate cuts.
• A constant flow of bearish headlines.
And yet, the Dollar did not collapse to fresh lows — instead, it simply revisited the same levels as before. This is a classic market signal that bad news may already be priced in.
From a technical standpoint, August was nothing but an annoying tight range:
• Support around 97.50.
• Resistance near 98.50.
Now, although the index looks like it’s breaking lower, I suspect this is another false breakdown, one that could be reversed quickly. If that plays out, the stage is set for a push higher — potentially to the 100 zone, a clean 3% rise from current levels.
Such a move would naturally translate into pressure on the majors:
• EUR/USD could slide back toward 1.14.
• GBP/USD could retreat near 1.35.
For now, I’m watching closely for reversal signals. The market has punished the USD for months, but if sellers are exhausted, the Dollar may surprise to the upside. 🚀

SELL NZDUSDIn todays session we are actively monitoring NZDUSD for selling opportunity. Our first entry in ASIA session is at 0.60478 we anticipate a short rally up to our second re-entry at 0.60750. Our stops are above 0.6100 and our targets are at 0.59540. Use your own risk management and entry criteria and best of luck.
New algo entry model is under testing.

New Week on Gold and we could continue strong!Im looking for price to give more indication on what it wants to do but we are bullish until proven otherwise. for now its is not in a position that I would like to enter cause it can go either way. All moves are scalps untill we get some more breaks on levels.

Bearish momentum to extend?The US Dollar Index (DXY) has rejected off the pivot and could drop to the 1st support.
Pivot: 98.63
1st Support: 97.12
1st Resistance: 100.21
Disclaimer:
The above opinions given constitute general market commentary, and do not constitute the opinion or advice of IC Markets or any form of personal or investment advice.
Any opinions, news, research, analyses, prices, other information, or links to third-party sites contained on this website are provided on an "as-is" basis, are intended only to be informative, is not an advice nor a recommendation, nor research, or a record of our trading prices, or an offer of, or solicitation for a transaction in any financial instrument and thus should not be treated as such. The information provided does not involve any specific investment objectives, financial situation and needs of any specific person who may receive it. Please be aware, that past performance is not a reliable indicator of future performance and/or results. Past Performance or Forward-looking scenarios based upon the reasonable beliefs of the third-party provider are not a guarantee of future performance. Actual results may differ materially from those anticipated in forward-looking or past performance statements. IC Markets makes no representation or warranty and assumes no liability as to the accuracy or completeness of the information provided, nor any loss arising from any investment based on a recommendation, forecast or any information supplied by any third-party.

Gold | Oil | Dollar | Silver | Natural Gas Price ForecastGold | Oil | Dollar | Silver | Natural Gas Price Forecast
COMEX:GC1! COMEX:SI1! AMEX:UNG NYMEX:CL1!

US Dollar: Still Bearish-Neutral, But Is The Correction Ending?Welcome back to the Weekly Forex Forecast for the week of Sept 8-12th.
In this video, we will analyze the following FX market: USD Dollar
The USD is still grinding sideways, but it did sweep the low of the consolidation Friday on bad NFP numbers. Worth mentioning is it finally made contact with a significant demand zone as well. As bearish-neutral as the DXY has looked over the past several weeks, there is potential here that if has finally found support for higher prices.
As long as the market maintains the protected low, we are still in correction territory. The potential for a move higher remains.
React and do not predict.
Enjoy!
May profits be upon you.
Leave any questions or comments in the comment section.
I appreciate any feedback from my viewers!
Disclaimer:
I do not provide personal investment advice and I am not a qualified licensed investment advisor.
All information found here, including any ideas, opinions, views, predictions, forecasts, commentaries, suggestions, expressed or implied herein, are for informational, entertainment or educational purposes only and should not be construed as personal investment advice. While the information provided is believed to be accurate, it may include errors or inaccuracies.
I will not and cannot be held liable for any actions you take as a result of anything you read here.
Conduct your own due diligence, or consult a licensed financial advisor or broker before making any and all investment decisions. Any investments, trades, speculations, or decisions made on the basis of any information found on this channel, expressed or implied herein, are committed at your own risk, financial or otherwise.

U.S. Dollar Index (DXY) Outlook | Gold (XAU/USD) Correlation📈 U.S. Dollar Index (DXY) at Key Support | 🪙 Gold at Record Highs
🔎 Quick Summary:
• DXY holding 97.70 support inside a descending channel.
• A rebound could push it back toward 98.25 – 98.50.
• Meanwhile, Gold is sitting near $3,600/oz, at all-time highs, fueled by safe-haven demand and central bank buying.
• The DXY’s next move will help decide if Gold keeps climbing or pauses.
⸻
💵 U.S. Dollar Index (DXY) Outlook
On the 4H chart, the Dollar Index remains inside a descending channel. It has been forming lower highs and lower lows, yet the 97.70 level has repeatedly held as strong support.
• 🔹 Buyers are defending this zone, showing demand.
• 🔹 A rebound could take price back to the 98.25 – 98.50 supply zone.
• 🔹 A breakout above 98.50 would be significant, opening room toward 99.00+.
This makes the 97.70 region a critical turning point for DXY.
⸻
🪙 Gold (XAU/USD) Context
Gold is trading at record highs around $3,600/oz 🚀 — a level never seen before.
• 🌍 Central banks continue to accumulate gold aggressively.
• 🏦 Expectations of Fed rate cuts reduce the opportunity cost of holding gold.
• ⚖️ Persistent economic and geopolitical uncertainty is fueling safe-haven demand.
Correlation with DXY:
• 📉 If the Dollar rebounds, Gold could slow down or consolidate after its massive rally.
• 📈 If the Dollar breaks below support, Gold could see further upside, possibly testing higher targets near $3,700/oz and beyond.
⸻
📊 Conclusion
The Dollar Index is sitting at make-or-break support. A bounce would show Dollar strength and may cool off Gold’s rally. But if DXY weakens further, Gold could extend its surge into new record territory.
At this point, Gold remains the undisputed leader in the market, with DXY’s next move likely deciding how fast momentum continues.
⸻
⚡ Summary in one line:
💵 DXY at critical support — 🪙 Gold shining at record highs, waiting for the Dollar’s next move.

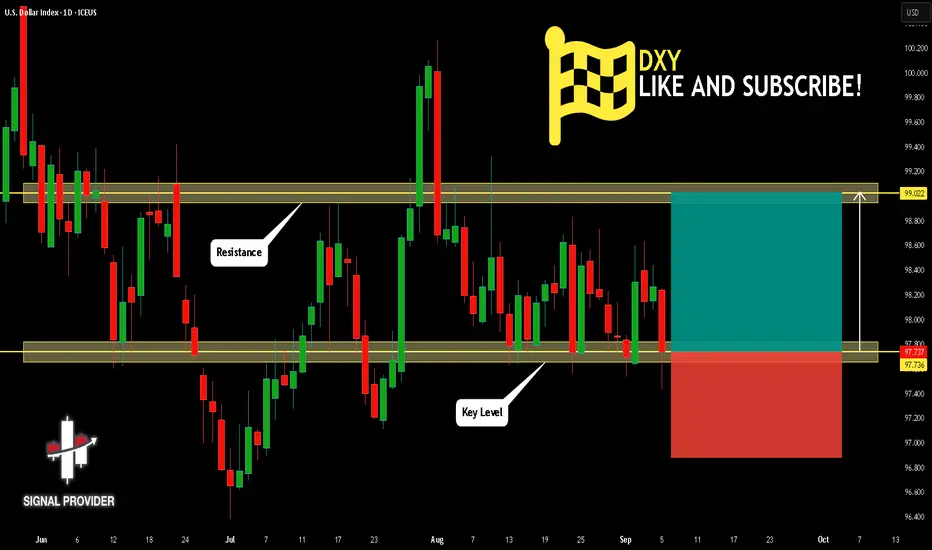
DXY Will Go Up! Long!
Please, check our technical outlook for DXY.
Time Frame: 1D
Current Trend: Bullish
Sentiment: Oversold (based on 7-period RSI)
Forecast: Bullish
The market is trading around a solid horizontal structure 97.736.
The above observations make me that the market will inevitably achieve 99.022 level.
P.S
Overbought describes a period of time where there has been a significant and consistent upward move in price over a period of time without much pullback.
Disclosure: I am part of Trade Nation's Influencer program and receive a monthly fee for using their TradingView charts in my analysis.
Like and subscribe and comment my ideas if you enjoy them!
Head & Shoulders Top Threatens GBPUSD Rally! Bearish Swing Trade🔮 GBPUSD Technical Forecast & Trading Strategy | Week of Sept 6th, 2025
Current Spot Price: 1.35064 | CFD | Date: Sept 6, 2025
🟢 Overall Bias: CAUTIOUSLY BEARISH | Primary analysis suggests a potential corrective pullback is imminent. However, the broader bullish trend on higher timeframes remains intact until key support breaks.
📊 Multi-Timeframe Technical Breakdown
1. Chart Pattern & Theory Convergence:
⚠️ Potential Head & Shoulders Top (H&S) Formation: On the 4H chart, a developing bearish reversal pattern is visible. The left shoulder, head, and a forming right shoulder suggest a pullback towards the neckline near 1.3420-1.3400 is possible.
📐 Gann Theory & Square of 9: Key Gann resistance was evident near 1.3520-1.3530. The current rejection from this zone adds credibility to the bearish short-term outlook. The next major Gann support level aligns with the H&S target around 1.3400.
🌊 Elliott Wave Theory: Price action from the recent low appears to be completing a 5-wave impulsive move up. We are likely entering a corrective Wave A or B pullback.
🦀 Harmonic Patterns: The rally has approached a potential Bearish Crab or Bat pattern completion zone, where PRZs (Potential Reversal Zones) often coincide with Fibonacci extensions (e.g., 1.618). This reinforces the resistance area.
2. Key Indicator Signals:
📶 RSI (14): On the 4H chart, the RSI is showing a clear bearish divergence 📉. Price made a higher high, but the RSI made a lower high. This is a classic warning sign of weakening bullish momentum.
📏 Bollinger Bands (20,2): Price has kissed the upper band and is pulling back towards the middle band (20 SMA ~1.3460), which will act as immediate support. A break below could target the lower band.
⚖️ VWAP & Anchored VWAP: The price is trading above the daily VWAP, indicating the average buyer is still in profit. However, a break below a key Anchored VWAP (from the last significant low) would signal a shift in medium-term momentum.
📈 Moving Averages: The 50 and 200 EMA's on the 4H are still bullishly aligned, providing dynamic support. A break below the 50 EMA (~1.3470) would be the first sign of bearish acceleration.
3. Critical Support & Resistance:
🎯 Immediate Resistance: 1.3520 - 1.3535 (Gann Level, Previous High)
🎯 Key Resistance: 1.3600 - 1.3650 (Psychological, Swing High)
🛡️ Immediate Support: 1.3470 (50 EMA)
🛡️ Strong Support: 1.3420 - 1.3400 (H&S Neckline, Psychological)
🛡️ Major Support: 1.3350 (200 EMA, Wave 4 base)
⚡ Trading Strategies & Setups
A. Intraday Trading (5M - 1H Charts):
Strategy: Look for short opportunities on any retest of the 1.3520 resistance area, especially if confirmed by a bearish candlestick pattern (e.g., Bearish Engulfing, Shooting Star) and RSI rejection from overbought (>70) territory.
Short Entry (Ideal): ~1.3515 | Stop Loss: 1.3545 | Take Profit 1: 1.3480 | Take Profit 2: 1.3440
Scalp Long: Only on a bounce from the 1.3470 (50 EMA) support with a tight stop.
B. Swing Trading (4H - D Charts):
Strategy: The confluence of the H&S pattern, RSI divergence, and Gann resistance provides a high-probability swing short setup.
Swing Short Entry: On a break below the 1.3470 support or a rejection from 1.3520. | Stop Loss: Above 1.3550 | Target 1: 1.3420 (Neckline) | Target 2: 1.3350
Bullish Invalidation: A decisive break and close above 1.3550 would invalidate the immediate bearish setup and open a path to 1.3650.
🌍 Market Context & Risk Factors
Geopolitical & Political Events: Monitor any developments related to UK-EU relations, BoE and Fed policy divergence, and global risk sentiment. Volatility is guaranteed around high-impact news events.
USD Strength: The forecast is partially contingent on a broader USD recovery. Watch the DXY (Dollar Index) for confirmation.
✅ Key Takeaways:
Confluence is Key! Multiple independent theories (Gann, Elliott, Harmonics) are pointing to a resistance zone.
Momentum is Waning. The RSI divergence is a critical red flag for bulls 🚩.
Respect the Levels. Trade the break of 1.3470 (support) or 1.3550 (resistance).
Manage Risk. Always use stop-loss orders. The market can remain irrational longer than you can remain solvent.
For individuals seeking to enhance their trading abilities based on the analyses provided, I recommend exploring the mentoring program offered by Shunya Trade. (Website: shunya dot trade)
I would appreciate your feedback on this analysis, as it will serve as a valuable resource for future endeavors.
Sincerely,
Shunya.Trade
Website: shunya dot trade
⚠️Disclaimer: This post is intended solely for educational purposes and does not constitute investment advice, financial advice, or trading recommendations. The views expressed herein are derived from technical analysis and are shared for informational purposes only. The stock market inherently carries risks, including the potential for capital loss. Therefore, readers are strongly advised to exercise prudent judgment before making any investment decisions. We assume no liability for any actions taken based on this content. For personalized guidance, it is recommended to consult a certified financial advisor.


GBPUSDHello Traders! 👋
What are your thoughts on GBPUSD?
After rejecting a resistance area, GBP/USD has entered a corrective phase and is now approaching a high-confluence support zone, where multiple technical elements align
Price is expected to show bullish reaction within the support zone after some short-term consolidation.
Holding above this area could trigger a new impulsive wave toward previous resistance levels
As long as price stays above the support, the bullish bias remains valid.
A break and close below 1.31300 would invalidate the bullish setup, potentially opening the door for a deeper correction.
Don’t forget to like and share your thoughts in the comments! ❤️

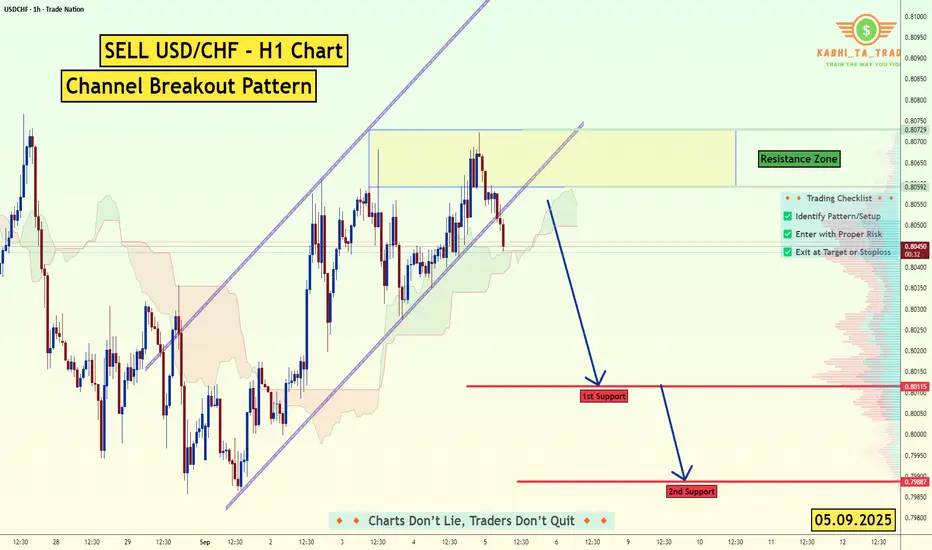
USD/CHF - H1 - Channel Breakout (NFP) (05.09.2025)The USD/CHF Pair on the H1 timeframe presents a Potential Selling Opportunity due to a recent Formation of a Channel Breakout Pattern. This suggests a shift in momentum towards the downside in the coming hours.
Possible Short Trade:
Entry: Consider Entering A Short Position around Trendline Of The Pattern.
Target Levels:
1st Support – 0.8011
2nd Support – 0.7988
🎁 Please hit the like button and
🎁 Leave a comment to support for My Post !
Your likes and comments are incredibly motivating and will encourage me to share more analysis with you.
Best Regards, KABHI_TA_TRADING
Thank you.
Disclosure: I am part of Trade Nation's Influencer program and receive a monthly fee for using their TradingView charts in my analysis.
DXY Analysis – Possible Fakeout Ahead of NFP?The Dollar Index (DXY) is currently consolidating within a large symmetrical triangle formation. Price is sitting around 98.00, testing both horizontal support and the ascending trendline.
We could see:
A fakeout to the downside around the upcoming NFP release, tapping into the demand zone near 97.50 – 97.00.
If this level holds, DXY may quickly reverse and break higher, leading to strong USD strength across major pairs.

USD/CAD - Bullish Pennant (04.09.2025)The USD/CAD pair on the M30 timeframe presents a Potential Buying Opportunity due to a recent Formation of a Bullish Pennant Breakout Pattern. This suggests a shift in momentum towards the upside and a higher likelihood of further advances in the coming hours.
Possible Long Trade:
Entry: Consider Entering A Long Position around Trendline Of The Pattern.
Target Levels:
1st Resistance – 1.3835
2nd Resistance – 1.3853
🎁 Please hit the like button and
🎁 Leave a comment to support for My Post !
Your likes and comments are incredibly motivating and will encourage me to share more analysis with you.
Best Regards, KABHI_TA_TRADING
Thank you.
Disclosure: I am part of Trade Nation's Influencer program and receive a monthly fee for using their TradingView charts in my analysis.

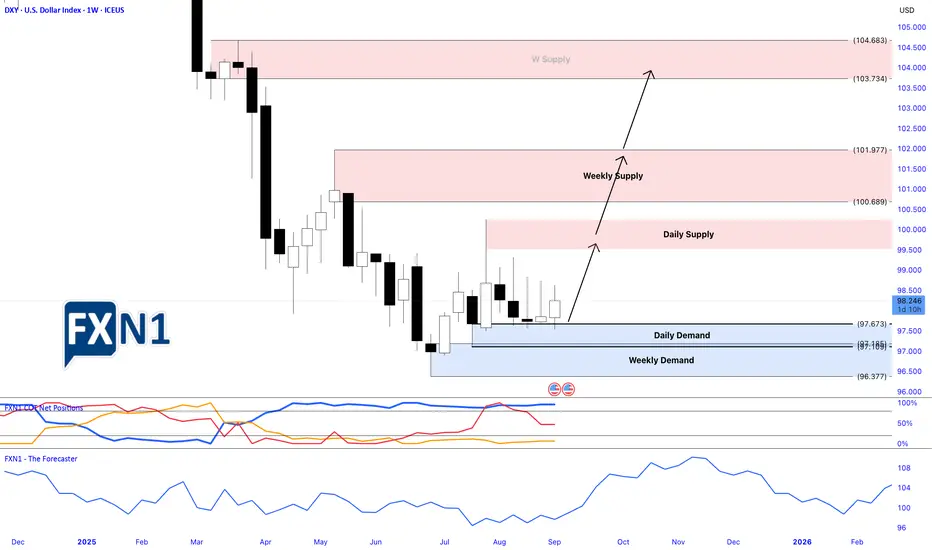
Is the DXY Poised for a Breakout?Analyzing the Bullish PotentialThe DXY (US Dollar Index) appears to be on the verge of a significant upward rally. Last week, I shared my analysis highlighting a potential trigger point for a long entry, which the price subsequently surpassed, confirming the setup. According to the latest COT reports, commercial traders have reached their highest net positions of 2023. Historically, whenever commercials hit new highs, it often signals the beginning of a bullish trend in the DXY.
Additionally, we observe that many currencies measured against the dollar have weakened recently, supporting my thesis of a continued upward move for the DXY. Seasonal patterns also point toward a potential bullish phase.
Is this the moment for the DXY to initiate a strong bullish trend? Only time will tell, but the technical and fundamental signals are aligning in favor of a possible rally.
✅ Please share your thoughts about Dollar index in the comments section below and HIT LIKE if you appreciate my analysis. Don't forget to FOLLOW ME; you will help us a lot with this small contribution.
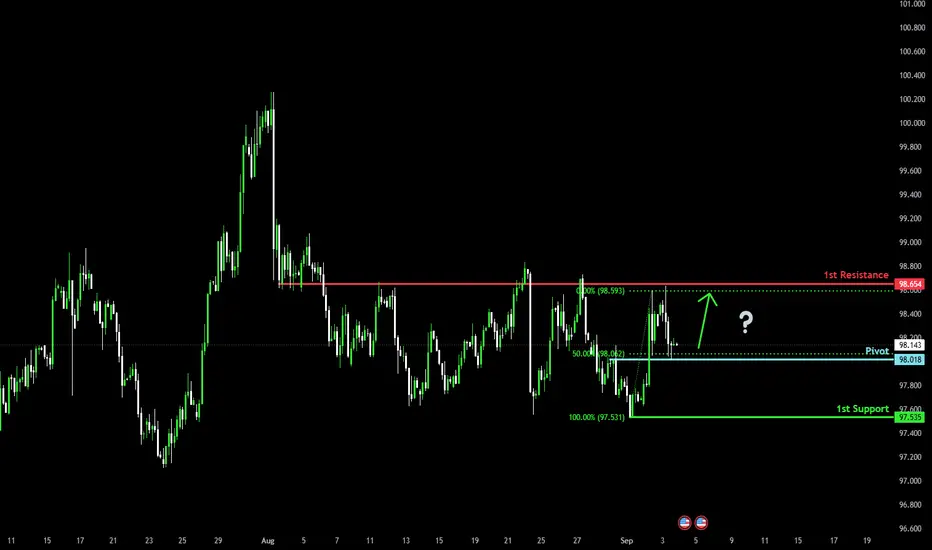
Bullish reversal at pullback support?The US Dollar Index (DXY) is falling towards the pivot, which acts as a pullback support that aligns with the 50% Fibonacci retracement and could bounce to the 1st resistance.
Pivot: 98.01
1st Support: 97.53
1st Resistance: 98.65
Risk Warning:
Trading Forex and CFDs carries a high level of risk to your capital and you should only trade with money you can afford to lose. Trading Forex and CFDs may not be suitable for all investors, so please ensure that you fully understand the risks involved and seek independent advice if necessary.
Disclaimer:
The above opinions given constitute general market commentary, and do not constitute the opinion or advice of IC Markets or any form of personal or investment advice.
Any opinions, news, research, analyses, prices, other information, or links to third-party sites contained on this website are provided on an "as-is" basis, are intended only to be informative, is not an advice nor a recommendation, nor research, or a record of our trading prices, or an offer of, or solicitation for a transaction in any financial instrument and thus should not be treated as such. The information provided does not involve any specific investment objectives, financial situation and needs of any specific person who may receive it. Please be aware, that past performance is not a reliable indicator of future performance and/or results. Past Performance or Forward-looking scenarios based upon the reasonable beliefs of the third-party provider are not a guarantee of future performance. Actual results may differ materially from those anticipated in forward-looking or past performance statements. IC Markets makes no representation or warranty and assumes no liability as to the accuracy or completeness of the information provided, nor any loss arising from any investment based on a recommendation, forecast or any information supplied by any third-party.
Gold Futures – Momentum Strong but Eyes on Jobs DataPrice pushed extremely bullish yesterday, with little chance for pullbacks. I admittedly got stopped out a few times from reacting too quickly to impulses, so today I’m focused on patience and waiting for confirmation.
Currently, Gold is holding above recent levels after breaking higher. There’s still a clean 4H/8H FVG below that price could revisit, but as long as momentum stays intact, buyers remain in control.
⚠️ Important: Tomorrow brings ADP Non-Farm Employment, Jobless Claims, and ISM Services PMI — all of which could drive volatility. Friday is the heavyweight NFP release. Until then, we may see liquidity hunts or choppy price action.
Scenarios I’m watching:
✅ Bullish continuation toward new highs if support holds.
🔄 Deeper pullback into the FVG if momentum stalls.
Staying patient, letting the market show its hand, and keeping risk tight ahead of news.

XAU/USD | Gold Breaks $3500 – New ATH Hit! What’s Next?By analyzing the gold chart on the 12-hour timeframe, we can see that today, gold finally managed to print a new All-Time High (ATH)! As anticipated, price broke above $3500 and rallied up to $3508, hitting our previous bullish target and sweeping the liquidity resting above the key $3500 level.
After reaching $3508, gold entered a correction phase, dropping to $3470, but quickly bounced back and climbed to $3494. At the time of writing, gold is trading around $3478, showing a bearish reaction — but it's best to wait and see whether price gets rejected again from this level or not.
If gold is to undergo a deeper correction, the next potential downside targets are $3465, $3454, and $3420. This analysis will be updated — stay tuned for more confirmations from the market!
MY LATEST ANALYSIS :

Gbpusd long ideaprevious ideas went extremely well and were very quick!
We have seen PDL and Asia sell-side taken during London then followed by a reversal.
I would like to see a bullish follow through going at least mid range.
Let see how that goes!
