ETH$ in uptrend ch ?!Ethereum is in an ascending channel, but it's undergoing a correction. The bottom of the channel, marked in orange, is an important point. Additionally, the green box indicates a key area that aligns with the weekly Fibonacci zone, as well as the 200 EMA. This is very significant and could lead to a price increase.
J-ETH

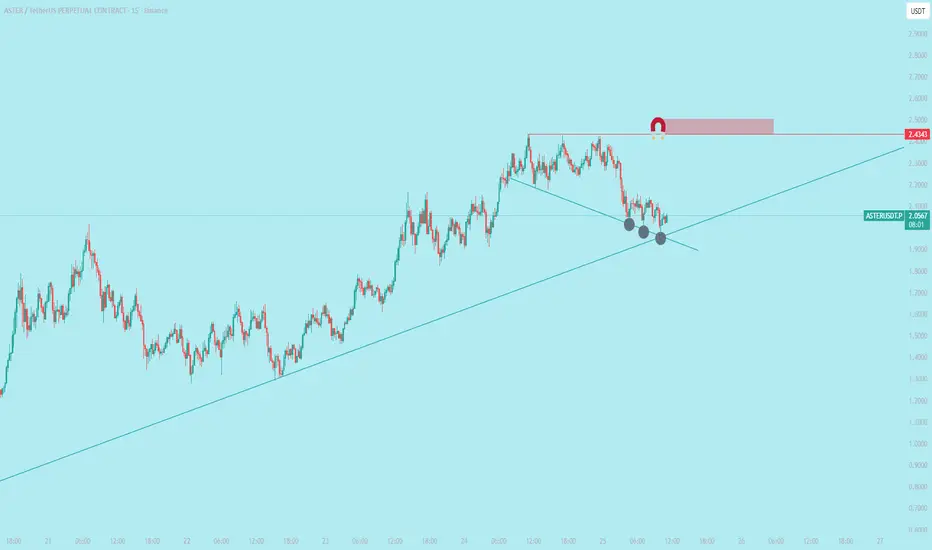
$ASTER is ready for ATH vibes again$ASTER is ready for ATH vibes again
Price Movement: The chart shows a significant uptrend from around $1,000 to a peak near $2,443, followed by a pullback to the current price of $2,049 (as of 10:44 UTC on September 25, 2025). This indicates a recent correction after hitting resistance.
Resistance Level: The horizontal red line at $2,443 acts as a key resistance level where the price struggled to break through, suggesting strong selling pressure at this point.
Support Zone: The intersection of the two trend lines (light blue upward trend and darker blue downward trend) around $2,000-$2,100 marks a potential support zone. The gray circles highlight this area where the price might find buying interest.
Trend Lines: The upward-sloping light blue line reflects the overall uptrend, while the downward-sloping darker blue line indicates a short-term correction or consolidation phase.
Volume and Momentum: While volume data isn't fully visible, the price action suggests momentum has slowed after the resistance test, with a 0.27% change indicating stability at the current level.
Outlook: The price is currently testing the support zone. A bounce from here could signal a retest of $2,443, while a break below $2,000 might lead to further downside toward $1,800-$1,900.
$ETH shows bullish hidden RSI divergence.A **bullish hidden RSI divergence** is a trading signal that suggests a continuation of an upward trend, often indicating that the price will keep rising. It occurs when the price action and the Relative Strength Index (RSI) show a specific pattern. Here's a simple explanation of how to identify and trade it:
### Step 1: Understand the Pattern
- **Price Action**: The price makes **higher lows** (each low point is higher than the previous one), indicating an uptrend.
- **RSI**: The RSI makes **lower lows** (the RSI is declining while the price is not), showing a divergence from the price trend.
- This mismatch suggests that the uptrend is still strong, and the dip in RSI is just a temporary slowdown in momentum, not a reversal.
### Step 2: Identify the Divergence
1. **Chart Setup**: Use a price chart (e.g., candlestick chart) with the RSI indicator (typically set to 14 periods) on a platform like TradingView .
2. **Spot Higher Lows in Price**: Look for a price chart where the recent low is higher than the previous low (e.g., $100 to $105).
3. **Check RSI for Lower Lows**: At the same time, check if the RSI is making a lower low (e.g., RSI drops from 50 to 45 while price makes a higher low).
4. **Confirm the Uptrend**: Ensure the overall trend is bullish (price is generally moving up with higher highs and higher lows).
### Step 3: Trading the Bullish Hidden RSI Divergence
1. **Entry Point**:
- Enter a **buy** trade when you confirm the divergence and see the price starting to rise again after the higher low.
- Look for additional confirmation, like a bullish candlestick pattern (e.g., a hammer or engulfing candle) or a break above a resistance level.
2. **Stop Loss**:
- Place a stop loss below the most recent higher low to protect against a potential trend reversal.
- For example, if the higher low is at $105, set the stop loss slightly below, like $103.
3. **Take Profit**:
- Target a take-profit level based on previous highs, support/resistance levels, or a risk-reward ratio (e.g., 1:2, meaning you aim for twice the profit compared to your risk).
- For instance, if your stop loss is $2 below entry, aim for a $4 profit target.
### Step 4: Manage the Trade
- **Monitor RSI**: Ensure RSI doesn’t drop into oversold territory (below 30) or show signs of a bearish reversal.
- **Adjust Stop Loss**: As the price moves up, consider trailing your stop loss to lock in profits.
- **Exit Strategy**: Exit the trade if the price hits your target, or if you see signs of a trend reversal (e.g., a bearish divergence or break of key support).
### Example
- **Price**: Stock XYZ makes a low at $100, then a higher low at $105.
- **RSI**: RSI drops from 50 to 45 during the same period.
- **Action**: You enter a buy trade at $106 after a bullish candle. Set a stop loss at $103 and aim for a take-profit at $110 (1:2 risk-reward).
- **Outcome**: If the price continues its uptrend to $110, you take profit. If it drops below $103, you exit with a small loss.
### Tips
- **Timeframes**: Use higher timeframes (e.g., 1-hour, 4-hour, or daily) for more reliable signals.
- **Confirmation Tools**: Combine with other indicators like moving averages or trendlines for stronger signals.
- **Practice**: Test this strategy on a demo account before using real money to understand how it works in different market conditions.
- **Risk Management**: Never risk more than 1-2% of your trading account on a single trade.
This strategy works best in trending markets, so always confirm the broader trend before trading.


Ethereum $ETH similar price action to late JuneIt's not perfect look to see CRYPTOCAP:ETH losing the daily range
However, the current PA oddly reminds me of one from late June
RSI and AO are similar as well
The next few days will be interesting to see if they are trying to scare the paper hands before the generation run, or the generational run is getting postponed for now

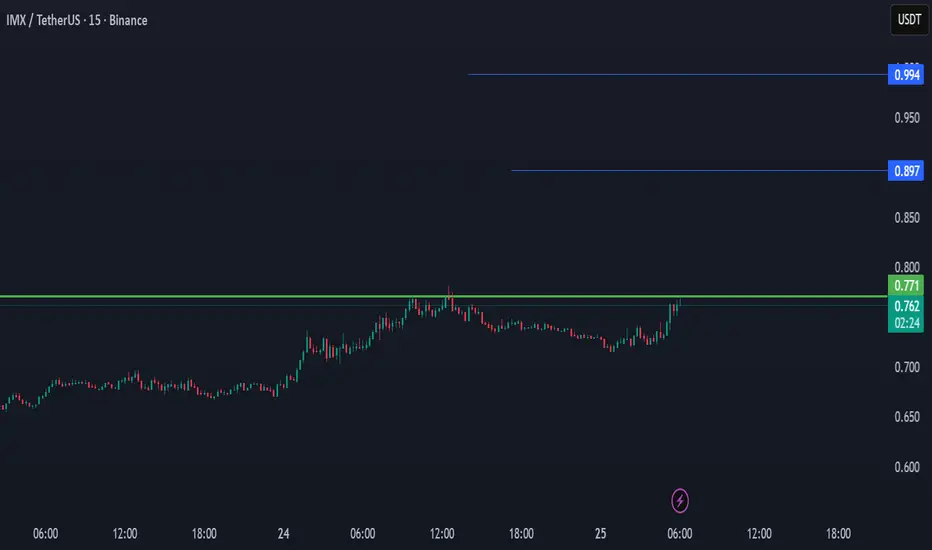
IMX NEW INCREASE VOLUME📊IMX has a pre-scan increase, which could build to a real increase in the coming time frame.
With the View of 2 levels, what IMX can target
Between $0,73 and $0,75, possibility of new uptrend volume
With the data study, this coin comes out as a coin that can show a new increase, even with the breakdown of the main market.
We will follow it to see what the possibilities are
ETHUSD H4 | Falling towards pullback supportEthereum (ETH/USD) is falling towards the buy entry at 3,895.02, which is a pullback support that is slightly above the 38.2% Fibonacci retracement and could bounce from this level to the take profit.
Stop loss is at 3,551.04, which is a pullback support that aligns with the 50% Fibonacci retracement.
Take profit is at 4,386.55, which is a pullback resistance.
High Risk Investment Warning
Trading Forex/CFDs on margin carries a high level of risk and may not be suitable for all investors. Leverage can work against you.
Stratos Markets Limited (tradu.com ):
CFDs are complex instruments and come with a high risk of losing money rapidly due to leverage. 65% of retail investor accounts lose money when trading CFDs with this provider. You should consider whether you understand how CFDs work and whether you can afford to take the high risk of losing your money.
Stratos Europe Ltd (tradu.com ):
CFDs are complex instruments and come with a high risk of losing money rapidly due to leverage. 66% of retail investor accounts lose money when trading CFDs with this provider. You should consider whether you understand how CFDs work and whether you can afford to take the high risk of losing your money.
Stratos Global LLC (tradu.com ):
Losses can exceed deposits.
Please be advised that the information presented on TradingView is provided to Tradu (‘Company’, ‘we’) by a third-party provider (‘TFA Global Pte Ltd’). Please be reminded that you are solely responsible for the trading decisions on your account. There is a very high degree of risk involved in trading. Any information and/or content is intended entirely for research, educational and informational purposes only and does not constitute investment or consultation advice or investment strategy. The information is not tailored to the investment needs of any specific person and therefore does not involve a consideration of any of the investment objectives, financial situation or needs of any viewer that may receive it. Kindly also note that past performance is not a reliable indicator of future results. Actual results may differ materially from those anticipated in forward-looking or past performance statements. We assume no liability as to the accuracy or completeness of any of the information and/or content provided herein and the Company cannot be held responsible for any omission, mistake nor for any loss or damage including without limitation to any loss of profit which may arise from reliance on any information supplied by TFA Global Pte Ltd.
The speaker(s) is neither an employee, agent nor representative of Tradu and is therefore acting independently. The opinions given are their own, constitute general market commentary, and do not constitute the opinion or advice of Tradu or any form of personal or investment advice. Tradu neither endorses nor guarantees offerings of third-party speakers, nor is Tradu responsible for the content, veracity or opinions of third-party speakers, presenters or participants.

Ethereum (ETH/USDT) Weekly Chart UpdateEthereum (ETH/USDT) Weekly Chart Update
ETH is currently trading around $4026, down approximately 9.5% this week.
A long-term triangle breakout has occurred, and the price is now retesting this breakout zone.
Support levels: $3800 and $3500 (with the moving average).
Resistance levels: $ 4,500–$ 4,800 (short-term); if the momentum continues, the next major target would be $ 5,500–$ 6,000.
The overall trend remains bullish as long as ETH stays above $3500–$3600.
⚡ Summary:
ETH is currently experiencing a mid-term correction, but the long-term outlook remains bullish. Staying above support could pave the way for a move towards $5000+ in the coming months.
#crypto #ETH #BTC

MARKET UPDATE BTC/USDT 25/09/2025📊BTC/USDT Update
On the low time frame, BTC has broken down and failed to reclaim the 113,223 – 114,019 zone.
This breakdown signals loss of the cycle structure, confirming that the previous bullish cycle has ended.
Key levels:
113,223 – 114,019 → resistance zone. As long as BTC remains below this, the structure stays bearish.
111,900 → current trading area, under pressure.
Upside scenario: BTC would need to reclaim 113,223 first, and then confirm above 114,019, to even consider restarting an uptrend cycle. Without that, upside potential remains very limited.
Downside risk: Staying below 113,223 keeps BTC in breakdown mode, with increased probability of further decline toward 110,000 – 108,000.
📌 Summary
BTC lost the cycle support → bearish confirmation.
Reclaim above 114,019 is required to regain bullish momentum.
As long as BTC trades below 113,223, the bias remains bearish with downside risk.

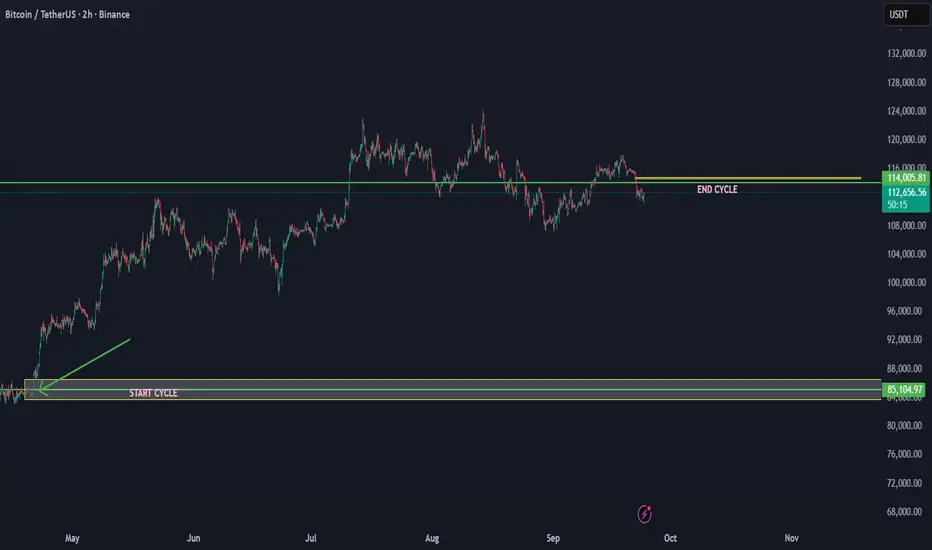
AFTER END OF CYCLE BTC CAN RETURN BELOW 110K - 90K📊 BTC/USDT Market Update
Current Price: ~$113,509
Cycle Recap: From the $84,000 low to the $114,000 high, BTC has completed what looks like an end of cycle phase (as marked on chart).
We did explain here the end of the cycle
There is a high chance in the coming time that BTC will break down below 110K and enter the correction zone.

solana to the depthsthere is a scenario where we could go for an sfp, but there have been many within this higher time frame one, so not sure if it'll come again before heading lower

This Volatility Period:Around September 24th(September 23rd-25)
Hello, traders!
Follow us to get the latest information quickly.
Have a great day!
-------------------------------------
(ETHUSDT 1D Chart)
This Volatility Period: Around September 24th (September 23rd-25th)
Before this volatility period began, the price fell below 4403.87 and then fell to the 3900.73-4107.80 range.
The 4403.87-1749.30 range, which corresponds to the HA-High ~ DOM (60) range, is likely to act as resistance, as it represents a high point.
The 3900.73-4107.80 range represents the previous all-time high (ATH). If the price remains above this range, the uptrend is likely to continue.
Therefore, the key question is whether the price can find support in the 3900.73-4107.80 range and rise above the 4403.87-4749.30 range.
After this volatility period, we should examine whether the price can find support in the 3900.73-4107.80 range.
If not, support around 3265.0-3438.16 is crucial.
-
If the OBV indicator falls below the Low Line, the price is likely to decline again.
Therefore, support around 3900.73-4107.80 is crucial.
-
The basic trading strategy is to buy in the DOM(-60) ~ HA-Low range and sell in the HA-High ~ DOM(60) range.
Considering this basic trading strategy, it may be natural for the price to decline since it failed to rise above 4403.87-4749.30.
Since it fell in the HA-High ~ DOM(60) range, it is likely to decline until it meets the DOM(-60) or HA-Low indicator.
However, since important support and resistance points or zones have formed, the trend can reverse at any time depending on whether support is found at those points or zones.
In this sense, the K value of the StochRSI indicator is in the oversold zone, suggesting a potential uptrend in the near future.
While the K value of the StochRSI indicator is in the oversold zone, the possibility of further decline is high. However, the established support and resistance zones increase the likelihood of turning this crisis into an opportunity.
In this situation, what we can do is confirm the signs of an uptrend.
Otherwise, if we anticipate a new trade in advance, we may face another crisis as the volatility period progresses.
-
If you are currently trading, there is an opportunity to sell in the first installment when resistance is encountered in the 4403.87-4749.30 zone.
As mentioned earlier, this is based on the basic trading strategy.
Depending on whether support is found in the 3900.73-4107.72 range, you'll decide whether to sell in two installments or buy.
Since the stock market trades in single-share increments, selling before the price has more than doubled from the purchase price makes it difficult to buy again.
However, the coin market allows for decimal trading, making trading easier than in the stock market.
This freedom of buying and selling is the biggest advantage of the coin market.
If your buy price is below 3900.73, buying when the 3900.73-4107.80 range shows signs of support will increase your average buy price, potentially putting you under psychological pressure.
However, as mentioned earlier, the coin market allows for decimal trading, making it possible to separate your buy price into separate trades.
Therefore, you can record the purchase price and purchase amount separately, differentiating them from the existing average purchase price, and then trade them separately.
If you understand this principle, you'll find the coin market much easier to trade than the stock market.
This is one of the reasons why even those who have successfully traded in the stock market often fail in their initial trading in the coin market.
-
Thank you for reading to the end.
I wish you successful trading.
--------------------------------------------------
- Here's an explanation of the big picture.
(3-year bull market, 1-year bear market pattern)
I'll explain more in detail when the bear market begins.
------------------------------------------------------

ETHUSDT 1D chart Review1. Trendline (orange) - was clearly pierced down → it is a signal of weakening the growth moment.
2. Horizers of support / resistance:
• Resistance: $ 4,604 (strong), above $ 4,960.
• Support: $ 4 150 (currently tested), next $ 3,958 and $ 3,696.
3. Price - currently ~ 4 169 $, i.e. right with the support of $ 4 150.
4. Candles - a strong inheritance candle after piercing the trend → weakness signal.
5. STOCHASTIC RSI - in the sales zone (<20), which may suggest the possibility of short -term reflection.
⸻
🔹 Application:
• Short date: possible reflection from $ 4 150 thanks to the sale (technical bounce).
• average date: If level $ 4 150 breaks and the candle closes below → the road opens to $ 3,958 and even $ 3,696.
• Only a return above $ 4 272 and a retest trendline from below would give a signal of buyers.
⸻
👉 To sum up: The market is in the critical zone - support $ 4 150 decides.
• Bull: keeping the defense of this level + reflection from the sale.
• Bear: loss $ 4 150 = greater correction in the direction of $ 3 950–3 700.

XRP deadcat bounce?Today Bulls had their fun on XRP. The fall was only the beginning. This was a test of supply. In my opinion I believe demand for next month is $1.30 in that range. We shall see. We are still in a Wyckoff distribution pattern and haven't broke any eyes if we break higher than my green box we remain bullish.

ETHERUM FREE SIGNAL|LONG|
✅ETHUSD reacts from higher-timeframe support, running sell-side liquidity before shifting orderflow bullish. Entry at discount seeks draw on liquidity above, targeting imbalance fill near 4360$.
—————————
Entry: 4,169$
Stop Loss: 4,050$
Take Profit: 4,360$
Time Frame: 7H
—————————
LONG🚀
✅Like and subscribe to never miss a new idea!✅

USDT.D - Watch the Blue Zone: Break = Bullish for CryptoUSDT dominance ripped into the 4.55–4.60 supply and stalled. Price is hovering on the blue support zone at 4.44–4.48.
This area is key 🔑. If the blue zone breaks down and holds below 4.44–4.48, that’s bullish for crypto (alts + BTC) as dominance rotates lower toward 4.30–4.25, even 4.22.
If the zone holds and 4.60 is reclaimed, dominance can push higher and keep pressure on risk assets.
What’s your plan => wait for a confirmed break of the blue zone to flip risk-on, or fade the first rejection at 4.60? 🤔
⚠️ Disclaimer: This is not financial advice. Always do your own research and manage risk properly.
📚 Stick to your trading plan regarding entries, risk, and management.
Good luck! 🍀
All Strategies Are Good; If Managed Properly!
~Richard Nasr

STABLECOIN SUPERCYCLE CAN SEND AAVE TO $5,000We have a #HVF forming that is yet to breakout.
The fundamental driver is of course stablecoin growth. Namely the ones that the United States allow to dominate in this space. Permissioned quasi CBDC's like USDT and USDC.
So what is AAVE if you don't know;
Aave (AAVE) is a decentralized finance (DeFi) protocol enabling users to lend, borrow, and earn interest on crypto assets without intermediaries through automated liquidity pools.
Liquidity Markets – Users deposit assets into pools to earn yield or borrow against collateral.
Flash Loans – Pioneered uncollateralized loans executable within a single blockchain transaction.
Community Governance – AAVE token holders vote on protocol upgrades, risk parameters, and expansions.
So there we have it ... congrats to hodler's of this protocol that was once called ETHLend.
Theres still plenty meat left on the bone for these next few years.

ETH/USD: The Perfect Time to Buy?! (PART II)Over the last four and a half years, the price range around $4000 has played an important role in ETH movements.
It first acted as support for a short period after ETH made its all-time high back in 2021. More importantly, this level has worked multiple times as strong support. Each touch has only reinforced its importance.
At the beginning of August 2025, COINBASE:ETHUSD made a strong breakthrough — a confirmed breakout. Heavy buying power smashed through the zone.
And now comes the best part: price is currently retesting that breakout zone, a classical Break & Retest setup.
So, this strong price level is now starting to act as support, and technically, this is a very solid setup.
I don’t post crypto that often, but the last time I shared an ETH/USD chart was just before the current rally started. Let’s call this Part II. 😉
Keep an eye on the current price levels — technically, it’s a very clean setup.
Good luck,
Vaido

The BTC cycle that started at 84K is projected end at 114K This is a cycle update for BTC/USDT. Based on the cycle data, the cycle that started at 84K has ended at 114K. This indicates that we are now entering a new major trend breakdown in the cycle. It can take time, but when there is a new uptrend cycle, we will add.
This time frame and action made the end of the cycle that started from 84K
This could mean that btc can enter below 110K in the coming time. We have seen more times in the history of BTC that by the cycle end, the trend breaks down in steps.
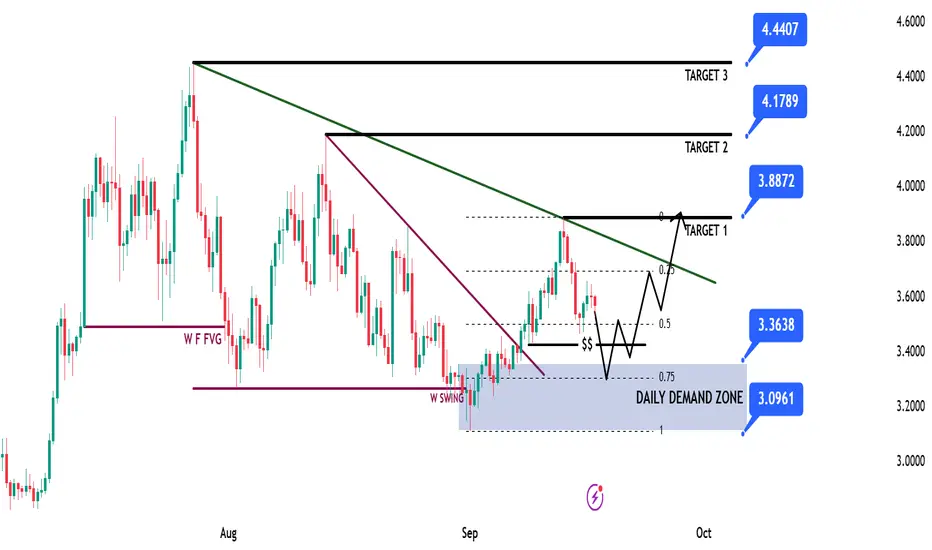
SUI Game Plan - Suinetwork📊 Market Sentiment
Market sentiment remains strongly bullish as the FED is expected to deliver a 0.25% rate cut, with speculation building for a possible 0.5% cut in September. Monetary policy shifts are being driven by both inflation trends and weakening labor market data. The latest August and September job reports were soft, signaling that the economy is cooling rapidly. This environment continues to fuel expectations for a major bullish run in the weeks ahead.
📈 Technical Analysis
Price is on HTF bullish trend so we will be looking only long setups.
Price ran HTF liquidity and closed above then broke the market on daily-weekly timeframe, creating the Daily Demand Zone.
Moreover, price broke the bearish trendline and closed above, giving strong upward momentum. Now price is retracing back into the Daily Demand Zone.
📌 Game Plan
1-Price to hit back to Daily Demand Zone
2-Price to hit possibly 0.75 max discount range zone. If not, I’ll still enter with LTF confirmation.
🎯 Setup Trigger
4H break of structure after hitting 3.36$ level. I won’t enter unless I see the 4H BOS.
📋 Trade Management
Stoploss: Below 4H swing low responsible for BOS
Targets:
TP1: 3.88$
TP2: 4.17$
TP3: 4.44$
💬 Like, follow, and comment if you find this setup valuable!
⚠️ Disclaimer: This content is for informational and educational purposes only and does not constitute financial, investment, or trading advice. Always DYOR before making any financial decisions.
$AVNT Perform of a bullish pennantWhat the pattern indicates
A bullish pennant is a continuation pattern, meaning that it signals the market is likely to continue its current trend after a brief pause. It suggests that the buying pressure that caused the initial rally is gathering strength for another push upward.
How to trade the pattern
Traders can use this pattern to plan entry and exit points:
Entry: A common strategy is to enter a long position (buy) when the price breaks above the pennant's resistance trendline.
Profit target: The typical price target for the trade is determined by measuring the height of the initial flagpole and projecting that distance from the breakout point.
Stop-loss: To manage risk, a stop-loss order can be placed just below the pennant's lower trendline.

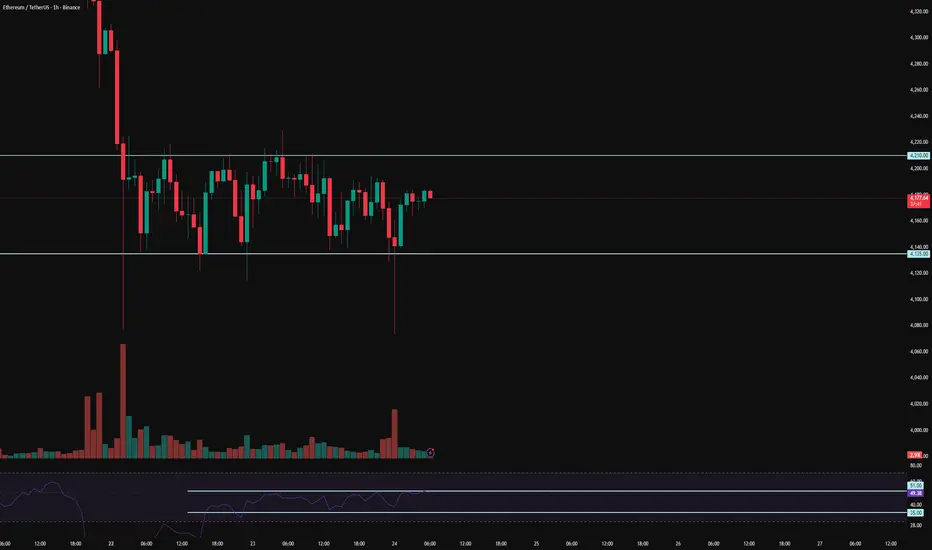
ETH 1H Analysis - Key Triggers Ahead | Day 26❄️ Welcome to the cryptos winter , I hope you’ve started your day well.
⏰ We’re analyzing ETH on the 1-Hour timeframe.
👀 On the 1-hour timeframe, Ethereum is currently ranging after its recent drop, sitting in a decision-making zone. It already faked the range low once and bounced back up, creating a clean trading structure. If ETH breaks above the $4,210 resistance, it could complete its correction and push higher. On the other hand, if ETH continues its deeper correction, a break and confirmation below the $4,135 support would open the way to lower levels.
🧮 Looking at the RSI oscillator, it’s now hovering around the 50 zone. A cross above 51 could trigger a bullish breakout, while a cross below 35 would suggest Ethereum is heading for a deeper correction.
🕯 Candle size and volume have shrunk inside this range, showing clear consolidation. Buyers and sellers are in a tug-of-war, and we’d prefer not to trade in these tight squeezes with heavy volume until a clear winner emerges. A breakout of the range will likely need strong “whale candles” to confirm direction.
💸 The ETH/BTC pair also shows a similar structure — after its recent drop, it has entered a tight consolidation pattern that mirrors the price action seen against USDT.
🧠 For trading ETH, patience is key. Wait to see which side Ethereum chooses to break out from. Once the range high or low (outlined above) is taken out with confirmation, we can look for a position in that direction.
❤️ Disclaimer : This analysis is purely based on my personal opinion and I only trade if the stated triggers are activated .
ETH - Near ATH… Price Discovery Reload?BINANCE:ETHUSDT ETH has marched back to its cycle ceiling on the weekly after a long range. We’re now pressing the final resistance band around $4,880–$5,000—where a clean breakout would shift ETH into price discovery again.
Confluence is strong here: prior ATH supply + round-number magnet + momentum structure. If buyers clear $5K with a weekly close, I’ll look for the next leg toward $6.5K–$7.25K, then a stretch path into five digits as discovery unfolds. If rejected, a healthy retest toward $4,100–$3,550 would keep the uptrend intact while the range persists.
What’s your plan => buy the weekly breakout above $5K, or wait for a dip into $4.1K for better risk–reward? 🤔
⚠️ Disclaimer: This is not financial advice. Always do your own research and manage risk properly.
📚 Stick to your trading plan regarding entries, risk, and management.
Good luck! 🍀
All Strategies Are Good; If Managed Properly!
~Richard Nasr
