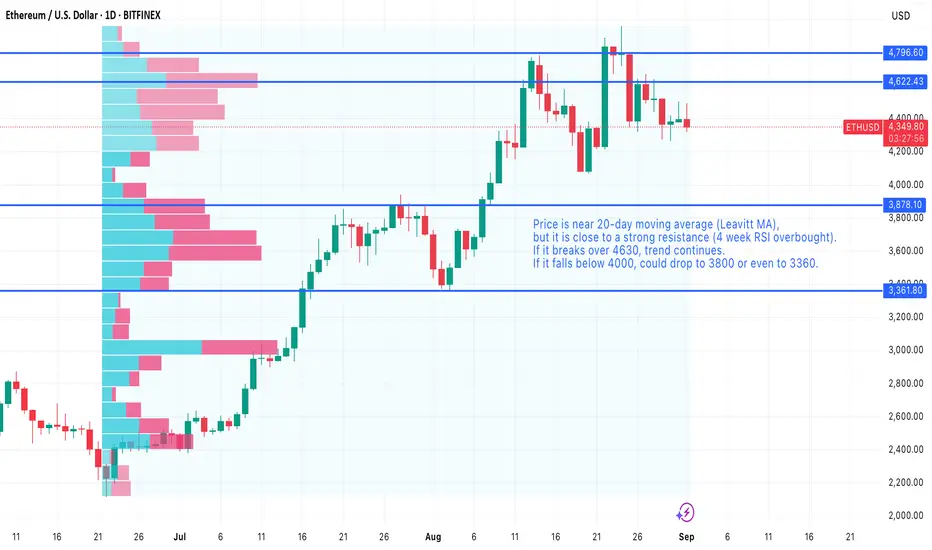
Break or Bust — ETH betwen Support vs. Overbought 4‑WeekETH sitting at the 20‑day Leavitt MA while hitting strong resistance — overbought of 4‑week RSI.
If price breaks and closes above $4,630, trend continuation is likely.
If price breaks below $4,000, expect a drop toward $3,800 and possibly $3,360.
Technical notes:
Use the 20‑day Leavitt MA as your short‑term trend anchor.
Watch for a confirmed daily close above $4,630 to signal continuation (entry on retest or momentum breakout).
A daily close below $4,000 invalidates the bullish case; targets: $3,800 then $3,360 (scale stops and size accordingly).
Manage risk with stops outside breakout levels and position sizing for potential volatility.
J-ETH
Be careful with ETHEREUM !!!If the price intends to complete the Head and Shoulders pattern. it should first undergo a slight correction and then rise. However, after breaking the wedge, the price should experience a significant increase.

$ETH – Trend Still IntactCRYPTOCAP:ETH has been overall bullish after breaking above the $4,230 neckline and retesting it as support.
We’ll be looking for trend-following longs as long as the red trendline holds, expecting the bullish momentum to continue toward the $4,800 resistance and potentially the $5,000 psychological level.
A break below the trendline would signal a short-term correction before the next leg higher.
⚠️ Disclaimer: This is not financial advice. Always do your own research and manage risk properly.
📚 Stick to your trading plan regarding entries, risk, and management.
Good luck! 🍀
All Strategies Are Good; If Managed Properly!
~Richard Nasr

BTC HOLDS LEVELS FOR MORE..BTC/USDT — Main Trend Holds Strong at $112K, Confirmation Near
Bitcoin is currently trading just below the low time frame zone around $124.5K, showing slight resistance before a potential confirmation breakout. Despite this minor pullback, the main trend remains firmly intact around $112K, which continues to act as the key structural support.
⚙️ Main trend updated to $112K: This level defines Bitcoin’s long-term bullish structure — as long as BTC stays above it, momentum remains positive.
📉 Below low time frame: BTC is temporarily consolidating under local resistance, but proximity to this level suggests a potential re-test and confirmation soon.
🚀 Upside target: Once the low time frame confirms, Bitcoin could aim for the next resistance zone near $132K.
Technical Outlook:
🟢 Main Trend (Support): $112K
🟡 Low Time Frame Resistance: $124.5K
🎯 Next Target: $132K (upon confirmation)
Summary:
BTC remains structurally bullish above the $112K main trend. While still slightly below the short-term confirmation zone, it’s positioned well for a potential continuation — provided support holds and price regains momentum above $124.5K.
📊 Bias: Cautiously Bullish
📈 Key Levels: Support $112K | Resistance $124.5K | Target $132K

TOTAL2 & ETH – On the Edge of Price DiscoveryTOTAL2 & ETH – The Next in Line for Price Discovery
Today, TOTAL2 has officially broken above its previous all-time high, while ETH is still just below it, getting closer with each daily candle.
This tells an interesting story: altcoins as a whole have already entered price discovery, but ETH being the largest component of TOTAL2, hasn’t quite joined yet. This usually means one of two things: either smaller-cap altcoins are currently outperforming ETH, or ETH is simply building strength for a delayed breakout, a move that often pulls the entire market even higher once it happens.
Still, confirmation matters: TOTAL2 needs a daily close above its ATH, while ETH’s reaction around its own ATH in the coming days will likely decide whether it joins the move.
And let’s not forget: we’ve just entered Q4, and this one might be the strongest Q4 the crypto market has ever seen. Everything that once stood against crypto, from regulation to sentiment, is now turning in its favour, across the US, Asia, and even Europe.
That’s why I believe ETH will soon follow TOTAL2 into price discovery, potentially marking the start of the next major leg up for the entire market.
Bias:
Bullish! TOTAL2 confirmed breakout, ETH close behind. Q4 momentum could be the catalyst that sends both into new territory.
Always take profits and manage risk.
Interaction is welcome.

Ethereum ATH Incoming - As soon as BTC goes back to sleep.
Our BINANCE:ETHUSDT.P algorithm triggered a long position.
All of our technical indicators calculate a 77.8% arithmetic average long signal strength . The most important piece of "evidence" for our speculation that Ethereum will reach new ATH levels within the next month is the fact that Extreme Trend BREAKOUTS and the High-Volatility TREND FOLLOWER conditions triggered the trade together and sit at 100% long signal strength at the time of writing.
Our other breakout condition - Double-Filtered Channel BREAKOUTS sits at 80% long signal strength too. Why is all that relevant? Because these conditions (made up out of 5-6 technical indicators each) are meant to detect and enter breakouts, following the trend from the very start.
While it is programmed to exit at 2%, we believe that a bigger move is in preparation. We recently saw BINANCE:BTCUSDT.P reach unprecedented highs. Historically, when Bitcoin stops it's parabolic growth and money starts flowing back into fiat and other cryptos - ETH benefits first.
Fundamentally, Ethereum is the backbone of the smart-contract and Web3 revolution. Solana, PolkaDot, BNB and other alt-coins are all derived from and inspired by the Ethereum virtual machine. This makes us ask the question - why is Ethereum lagging behind so much behind Bitcoin?
Well, there are a couple of possible answers and they all lead to the same conclusion:
- Solana, with it's lower barriers for entry, profited the most from the retail excitement around meme-coins. The easy coding language and simple, but functional and cheap websites for creating these "meme-coins" took away a large chunk of the retail volume that would otherwise go towards Ethereum.
- Ethereum's switch from proof-of-work to proof-of-stake is just now completing. The release of pre-PoS era staked ETH to large investors over the last year is finally reaching a point in time and price where it is more profitable for large ETH stakers to be incentivized to start keeping their original investment. Basically - there is less and less incentive to sell your staked Ethereum and more incentives to stake more (and therefore buy on Spot).
From the picture above we can see that the $4700 level is a major resistance level. Once that is broken, we have very little historical references for what may happen.
Or in other words - 4700 is the level from which we will bounce into price discovery after hopefully turning into support.
Not a lot of time is left in this crypto cycle. And Ethereum tends to finish it's parabolic increase towards the end of the classical 4-year cycle.

ETHEREUM BULLISH BREAKOUT|LONG|
✅ETHUSD shows a clean breakout above the key level as ICT traders anticipate continuation toward the next liquidity pool near 4,760$. Price may retest the breakout zone before pushing higher. Time Frame 2H.Setup Risk: High!
LONG🚀
✅Like and subscribe to never miss a new idea!✅

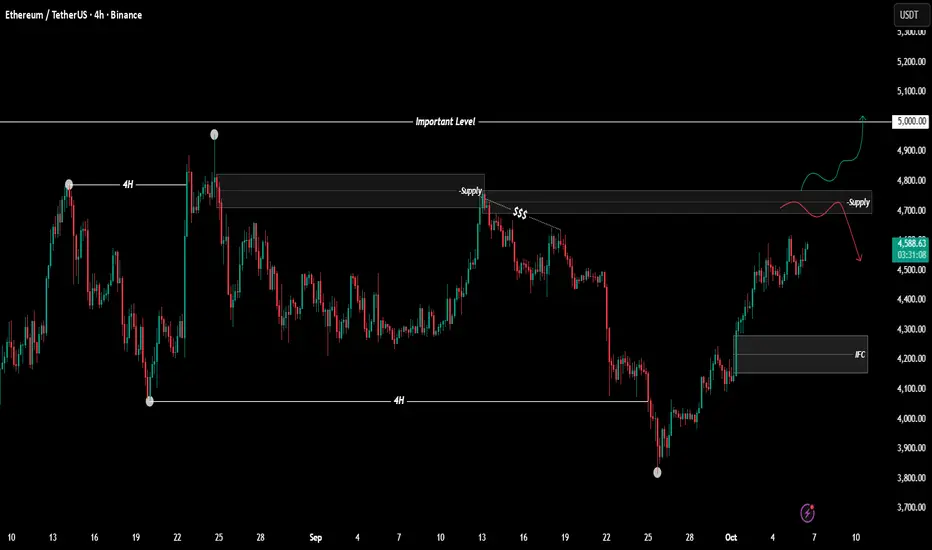
$ETHUSDT Analysis - Oct 6 | 4H Time FrameBINANCE:ETHUSDT Analysis - 4H
Hello and welcome to another analysis from the Satoshi Frame team!
I’m Abolfazl, and today we’re going to analyze Ethereum on the 4-hour timeframe.
As you know, USDT dominance has been trending downward, and the overall market structure is bullish. On the other hand, Bitcoin has set a new all-time high! Considering these factors, it’s clear that Ethereum also has the potential to move toward $5,000, which isn’t unrealistic.
From another perspective, Ethereum has shown a change of character (CHOCH) on the 4-hour timeframe, and the marked supply zone could create a pullback in price.
When the price reaches the supply zone, make sure to look for proper entry confirmations, and keep in mind that there’s a higher chance of the zone being broken and I’m personally looking for long positions.
See you in the next analyses!
Stay tuned with the Satoshi Frame team...
#ETH/USDT LONG CHART ANALIYSIS !!🔹 Ethereum (ETH/USDT) Analysis
Ethereum has shown a strong recovery from the $3,800 support zone, bouncing sharply and now trading above the 50-day moving average (50MA) — a key bullish sign.
You can see from the chart that ETH has broken out of the descending wedge pattern that had been forming for weeks. This breakout, along with the reclaim of the 50MA, indicates a shift in momentum from bearish to bullish.
Additionally, price is currently sitting above the Ichimoku Cloud, which further strengthens the bullish bias. When ETH is trading above both the 50MA and Ichimoku Cloud, it often signals the start of a potential trend continuation move.
Bullish Structure – ETH has consistently made higher lows since hitting $3,800.
MA Confirmation – The move above the 50MA suggests renewed buyer strength.
Ichimoku Cloud Breakout – Indicates improving sentiment and trend reversal.
Volume Support – The recovery was backed by healthy buying volume.
Key Levels to Watch:
Support: $4,270 – $4,300 zone (previous resistance now support)
Resistance: $4,800 – $4,850 zone (next major target area)
Invalidation: Below $4,200 (would weaken bullish momentum)
If ETH holds above $4,270 and consolidates, we could see a continuation toward the $4,800–$5,000 range in the coming sessions.

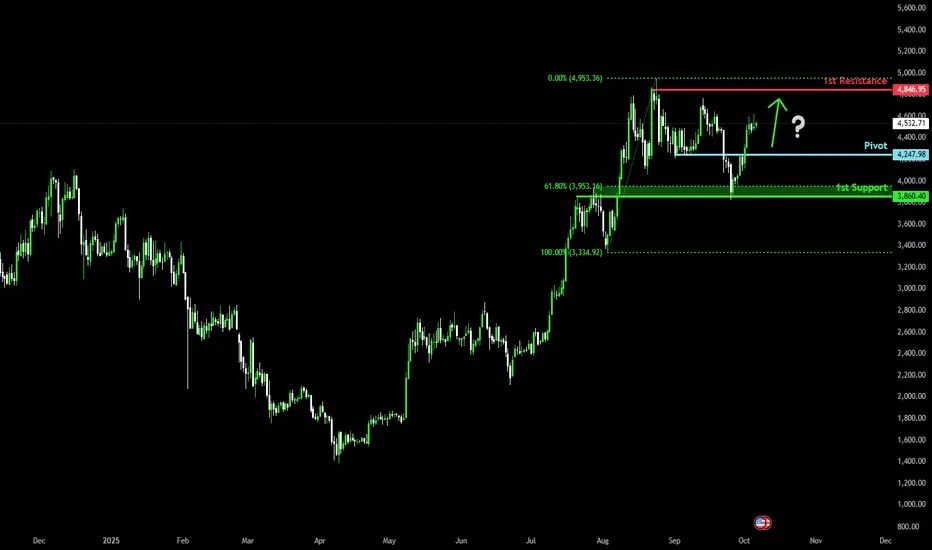
Bullish bounce from support?The Ethereum (ETH/USD) is falling towards the pivot which acts as a pullback support and could bounce to the 1st resistance.
Pivot: 4,247.98
1st Support: 3,860.40
1st Resistance: 4,846.95
Disclaimer:
The above opinions given constitute general market commentary, and do not constitute the opinion or advice of IC Markets or any form of personal or investment advice.
Any opinions, news, research, analyses, prices, other information, or links to third-party sites contained on this website are provided on an "as-is" basis, are intended only to be informative, is not an advice nor a recommendation, nor research, or a record of our trading prices, or an offer of, or solicitation for a transaction in any financial instrument and thus should not be treated as such. The information provided does not involve any specific investment objectives, financial situation and needs of any specific person who may receive it. Please be aware, that past performance is not a reliable indicator of future performance and/or results. Past Performance or Forward-looking scenarios based upon the reasonable beliefs of the third-party provider are not a guarantee of future performance. Actual results may differ materially from those anticipated in forward-looking or past performance statements. IC Markets makes no representation or warranty and assumes no liability as to the accuracy or completeness of the information provided, nor any loss arising from any investment based on a recommendation, forecast or any information supplied by any third-party.
ETHEREUM WILL GROW|LONG|
✅ETHUSD price is respecting the demand area and forming bullish structure. A reaction from this level could fuel continuation toward the 4,560$ target zone. Time Frame 4H.
LONG🚀
✅Like and subscribe to never miss a new idea!✅

ETHUSDT 1D chart review📊 1. Main trend
• The chart shows a long -term movement in the inheritance trend channel in which the price is currently fighting for the mountain, but here you can see that the inferior canal limit is a strong resistance for the price.
⸻
🧠 2. Medium walking
• We see the cut SMA 50 and SMA 200 (so -called Golden Cross) - this is an upward signal in day interval.
• EMA 50 (green) is approaching the intersection of EMA 200 (red) - if the growth cross is confirmed, it may mean further growth time.
⸻
💹 3. Horizers of support and resistance
Support:
• 4,034 USDT - strong level, defended after the last inheritance.
• 4,252 USDT - short -term support (after breaking above trendline).
Resistance:
• 4 720 USDT - local resistance, previously rejected several times.
• 4,966 USDT - next strong resistance (local peak).
If ETH pierces 4 720 with a volume, the road opens towards 4,950-5,000 USDT.
⸻
⚙️ 4. Indicators
Macd:
• The histogram grows green → growth momentum.
• The MacD line cut the signal line from the bottom → buy signal.
RSI:
• RSI around 60, which indicates the advantage of bulls, but without buying out.
• If the RSI pierces 70, a short -term pullback may occur.

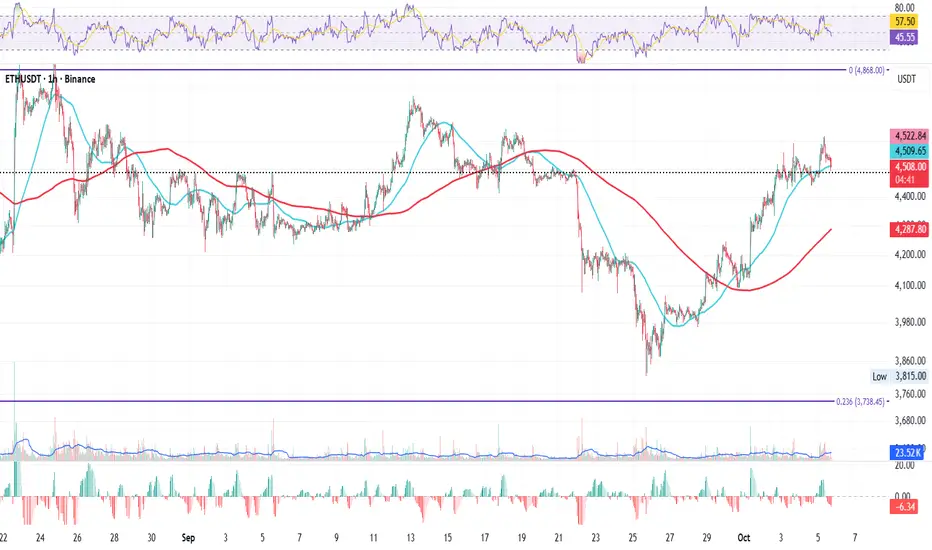
ETH 1H – Holding the Line or Breaking It?ETH 1H – Holding the Line or Breaking It?
Just like BTC, ETH on the 1H is currently testing the 50MA, the short-term line between strength and weakness.
The question now: will it hold as support, or will price break below and look for shelter near the 200MA?
Right under the 50MA sits yesterday’s close, adding an extra layer of support for the short-term structure.
Today’s close could be decisive for next week’s momentum. 👀
Key notes:
ETH testing the 50MA on 1H
200MA below as next support
Yesterday’s close acting as buffer
Close today could shape next week’s direction
Bias:
Neutral-bullish — momentum intact as long as the 50MA holds.
Always take profits and manage risk.
Interaction is welcome.
BRIEFING Week #40 : What could cause VIX>100Here's your weekly update ! Brought to you each weekend with years of track-record history..
Don't forget to hit the like/follow button if you feel like this post deserves it ;)
That's the best way to support me and help pushing this content to other users.
Kindly,
Phil

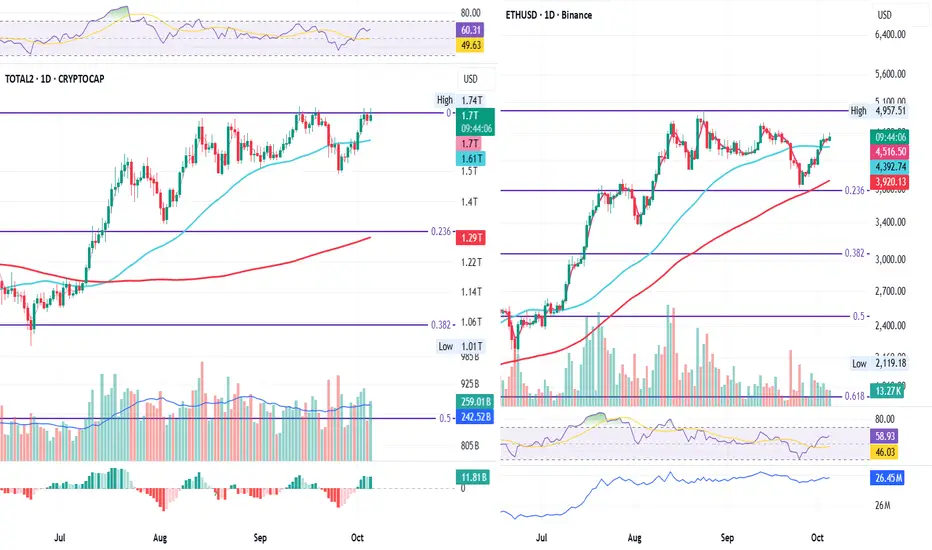
TOTAL2 Battles ATH While ETH Lags BehindTOTAL2 & ETH Daily – Testing the Edge of Structure
On the daily chart, TOTAL2 and ETH are showing a slight divergence.
TOTAL2 is battling its all-time high, while ETH is lagging slightly, hovering just above the 50MA.
If ETH manages to hold this level, it could build strength for another attempt at the highs. But if it loses the 50MA, this current high might turn into a lower high, risking a short-term break in bullish structure.
Today’s close will be key, it might offer the first clue about where momentum wants to flow next.
Key Notes:
TOTAL2 retesting all-time high
ETH consolidating over the 50MA
A hold could fuel another push up
A break below risks a lower high formation
Daily close likely to set short-term direction
Bias:
Cautiously bullish, structure holds, but confirmation depends on ETH defending the 50MA.
Always take profits and manage risk.
Interaction is welcome.
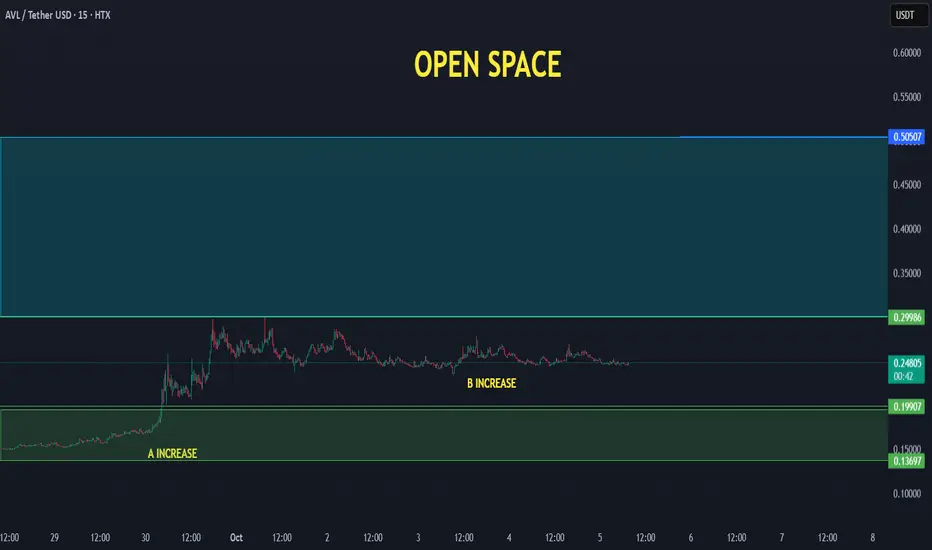
AVL Set to Surprise Investors with Massive Breakout $0,50+AVL Set to Surprise Investors with Massive Breakout Potential — Target $0.50 🚀
We are going to follow it as we did follow BTC below 110K to up to 124K
AVL/USDT continues to build strength after confirming its B increase phase, holding firm around the $0.24 – $0.26 range. This consolidation is happening just below a large open space zone, suggesting that a strong move could follow once momentum returns.
✅ A & B increase structure confirmed: The market shows a repeating cycle pattern, preparing for a C leg breakout.
✅ Open space to $0.50: Once AVL breaks above $0.30, there is very little resistance until $0.50, creating room for a powerful rally.
✅ Volume stability: Current sideways accumulation supports the potential for a sudden move as liquidity builds.
Technical Outlook:
As long as AVL holds above $0.24, bullish momentum remains intact. A breakout above $0.30 could ignite a sharp move toward the $0.50 target zone — aligning with prior high-volume cycles.
📈 Bias: Bullish
🎯 Targets: $0.30 → $0.42 → $0.50
#BTCUSDT Let Bitcoin make a new ATH#BTC
The price is moving in a descending channel on the 1-hour frame and is expected to break and continue upward.
We have a trend to stabilize above the 100 moving average once again.
We have a downtrend on the RSI indicator that supports the upward move with a breakout.
We have a major support area in green that pushed the price higher at 121,500.
Entry price: 122,200.
First target: 122,800.
Second target: 123,400.
Third target: 124,200.
To manage risk, don't forget stop loss and capital management.
When you reach the first target, save some profits and then change your stop order to an entry order.
For inquiries, please comment.
Thank you.

$ETH going to $10k The major downtrend breakout and retest that began at the 2021 ATH level has been successfully completed.
Ethereum position yourself

ETHSimple chart :
- Don’t fight the trend, just stick to your strategy.
- follow the signs.
- Never go all in and always DCA.
Only this way we will learn to master our emotions.
Happy Tr4Ding !

Ethereum Not Dead- i know some peoples think ETH will go to 250$ or 500$, so wait for it...
- I've always maintained that I'm not a fan of ETH because of its scalability limitations and centralization, for that reason ETH needs some messy L1...L2...etc..
- That said, my opinion doesn’t matter much, ETH is here to stay. The Ethereum ecosystem hosts thousands of projects; I’d say it’s too big to fail.
- i used Bitstamp exchange to look further back in the chart's history.
- i simplified this monthly chart so much that even a 10 year old kid could understand it, just check the RSI low levels and compare it with previous years. Again, check the max RSI level for the previous ATHs.
- i won't discuss where to buy because, whether you get ETH at $1,800 or $1,500, the bull run for ETH and Altcoins hasn't started yet.
Happy Tr4Ding !

ETH 2020\2025Ethereum Parabolic run is coming.
same vibes \ same setup \ different cycle
CRYPTOCAP:ETH ⟠

BITCOIN STILL IN THE ZONE - UPDATE 03-10-2025📊 Market Update
BTC remains positive on the lower time frame at 119.8, while the main trend is holding at 110.3. In the next BTC update, we’ll see whether BTC is still maintaining its positive structure — any new changes will be added.

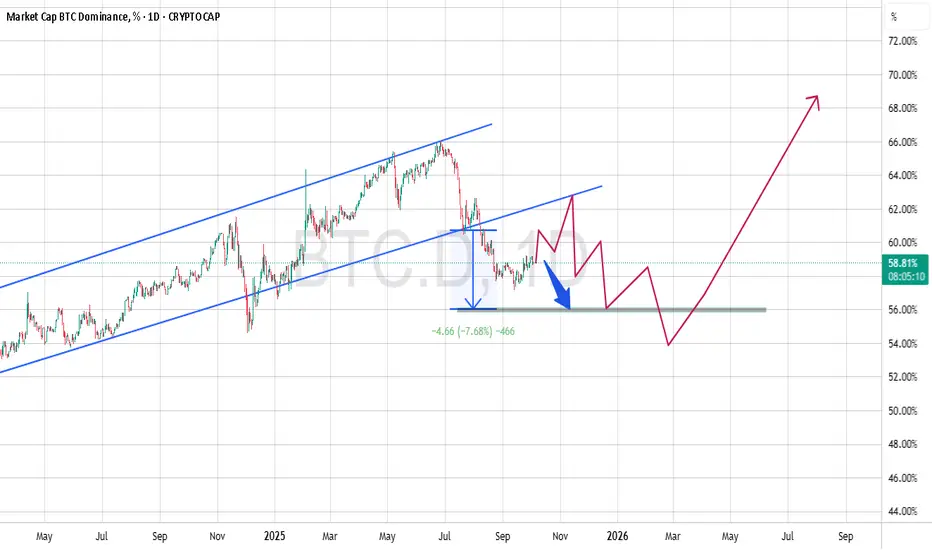
BTC Dominance: Short-Term Dip or Long-Term Rally?📊 Bitcoin dominance has been cruising in an uptrend channel for a while, but it recently broke below the channel's floor, dropping to around 58%. Right now, it’s bouncing around in a key zone between the 60% resistance and 56% support.
What’s Coming Next?
🔴 Short-Term Bearish Scenario: If dominance can’t hold above 60%, we might see it slide back to the critical 56% support. This could give altcoins some breathing room and maybe even spark a decent rally. Perfect opportunity for those eyeing altcoin trades!
🟢 Long-Term Bullish Scenario: If dominance builds a solid base at 56% and starts climbing again, it could aim for 64% and even push toward 68–70%. If this plays out, Bitcoin’s gonna take charge of the market again, and altcoins might feel the heat.
The Bottom Line:
Short-Term: A drop to 56% could mean altcoins steal the show. Keep an eye on this level!
Long-Term: If Bitcoin flexes its muscles and dominance climbs to 68–70%, it’s probably time to lean heavier into BTC in your portfolio.
✍️ This analysis can be a solid guide for balancing your portfolio between Bitcoin and altcoins. Watch those 56% and 60% levels closely to make smart moves!