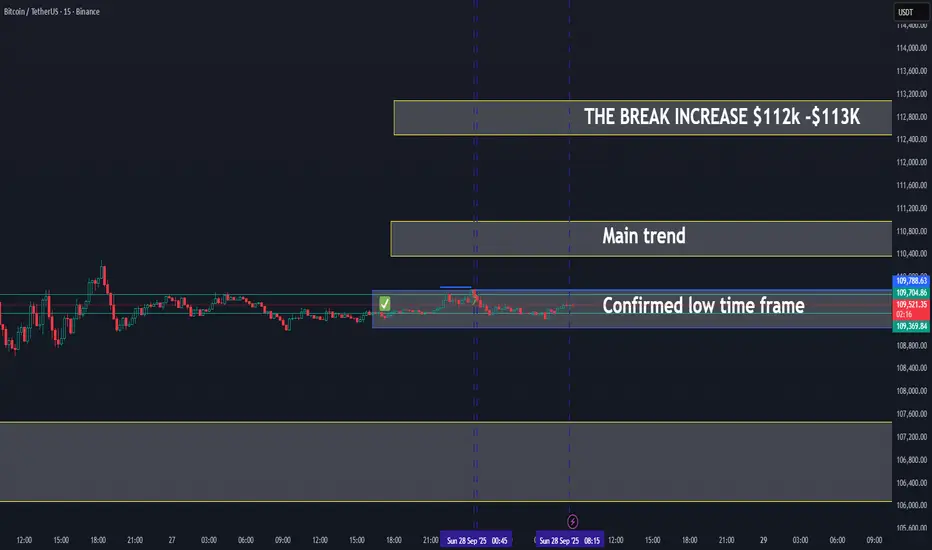
FINALLY LIGHT CONFIRMS THE LOW TIME FRAME - BREAK UP $1.40Based on trend analysis, the chart shows a confirmed low-timeframe activation. This setup suggests that ALPINE could, with time, break above the $1.40 level and potentially move toward the main target around $2.
The trend is going in waves, we expect there will come a moment when this token will go out the normal trend of waves and against BTC to break up the $1.40
J-ETH

BTC Still IN GREEN ZONE - UPDATE 01-10-2025BTC/USDT Update
✅ Bitcoin has reclaimed the low time frame zone, showing renewed strength after the recent dip.
📊 As long as BTC continues holding above $113.6K support, the short-term trend remains bullish.
🚀 The next target sits around the $116K zone, where resistance could be tested in the coming sessions.
🔑 The main trend remains far below, meaning the broader structure is still secured and positive.
📌 Summary:
BTC is holding strong above the low time frame support, with momentum building toward the $116K target zone. Holding this structure keeps the outlook bullish.

Symplegades Part II – Ethereum at the Threshold of Breakout or B⚔️🌉 Symplegades Part II – Ethereum at the Threshold of Breakout or Breakdown 💥🧭
In the previous post, we explored Ethereum’s mythical challenge — the Symplegades, or Clashing Rocks. That post resonated, and now… here comes Part II.
ETH is once again caught in a narrowing passage, this time defined by:
📌 $2,805 – $2,911 resistance overhead
📌 $2,616 – $2,565 support just below
💡 Pectra could be the fuel to break out — or just another wave that crashes on the rocks. The chart shows the potential for both:
➡️ A clean breakout could spark a move to “Destination 1” (~$4.8K)
⚠️ A rejection here might drag us back under $2.6K, even toward $2.1K and $1.8K zones
The Pectra breakout box is clear. But the market won’t hand it to us easily. It rarely does.
🧠 With Vitalik still “asleep,” it’s a tight spot. But if this move gathers momentum? We could be at the very start of Ethereum’s next wave.
📽️ The full video posted earlier today dives into this thesis and why macro + micro signals are conflicting but critical.
📊 Stay tuned — Bitcoin post is up next.
One Love,
The FXPROFESSOR 💙
Disclosure: I am happy to be part of the Trade Nation's Influencer program and receive a monthly fee for using their TradingView charts in my analysis. Awesome broker, where the trader really comes first! 🌟🤝📈

Be careful with ETHEREUM !!!Currently, our only dynamic support is the bottom of the channel. If the price respects this level, it could move upward. However, if this support is lost, the next support for Ethereum would be the PRZ (Potential Reversal Zone) area.

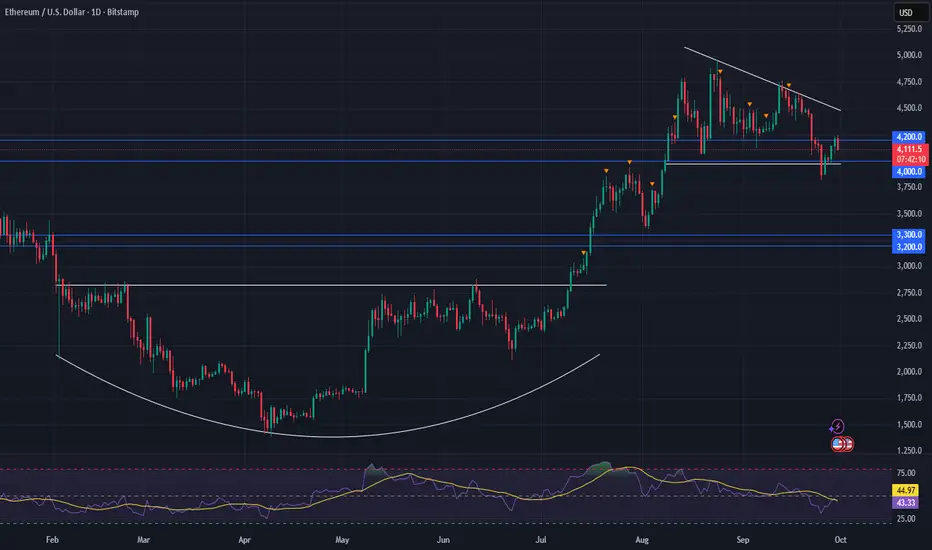
Ethereum Outlook – Key Levels in Play Amid Market JittersAfter a turbulent week across the crypto space—with volatility even bleeding into traditional equities—it's clear just how fragile sentiment remains. We’re seeing the usual overreactions: every minor selloff triggers calls that the bull market is over, despite the broader structure holding up... for now.
🔍 ETH Technical Outlook
Ethereum is retesting a major support zone between 4000–4200. This area has acted as a springboard before, but if it breaks decisively, it could flip to resistance, introducing more headwinds for bullish momentum.
Still, this may be shaping up as another dip-buying opportunity—if macro conditions remain stable and Bitcoin doesn't lead a broader breakdown.
🧱 Next Support Zone
If 4000–4200 doesn’t hold, the next major support zone is 3200–3300. This aligns with previous accumulation levels and would likely draw interest from larger buyers if price gravitates down there.
🔺 Chart Pattern Watch: Triangle Shift
We’ve been tracking a triangle formation, which now appears to be shifting from a symmetrical triangle to a descending triangle—a change in tone, but not yet a deal-breaker for the bulls.
The longer-term target remains intact: we’re still eyeing the 5700–5800 range, assuming structural support zones continue to hold and volume confirms any breakout.
usdt.d 30minHello friends
I am Mehdi, according to the Tether Dominance chart and the full targeting of the previous analysis in the 4-hour timeframe
According to the new analysis, I think the price is expected to reach the range of 4.49
1 Because the 4.57 level was broken with a strong candle in the 4-hour timeframe and now the price is rejecting this level
2 We are at the 382 fibo level
3 RSI divergence
Thank you for supporting me by liking and commenting and sharing this analysis

We're setting up for the greatest Q4 for Ethereum $ETH so farMy CRYPTOCAP:ETH thesis is slowly playing out
Waiting for one more confirmation (reclaiming 4250 resistance), and we're setting up for the greatest Q4 so far for Ethereum
I'll be buying the dips with SL below the current HTF deviation low at ~3830
A bit more patience here, let it play out, don't rush it

Will Ripple (XRP) continue to sell XRP – Distribution Pattern & Elliott Wave Roadmap
We’ve now tapped this support line five times. The structure looks like another Lower High (LH) forming inside a distribution pattern.
• Bullish scenario: If price breaks above the LH structure, we could see continuation toward a new all-time high.
• Bearish scenario: If lower highs persist, I don’t expect a sixth touch of this support. Instead, a decisive break lower would confirm the top of Wave (5) and start a larger correction.
That correction should complete as a 3-wave structure, setting up the Super Cycle Wave (1) top. From there, leg 2 develops before a true leg 3 rally begins. Based on my count, that rally zone could emerge from $0.05 – $0.14.
This chart is part of my overall Elliott Wave view (see my first post). I’ll update that main chart when a minor leg one within this corrective phase is confirmed.
⚠️ CRYPTO:XRPUSD Stay tuned—updates will follow as CRYPTO:XRPUSD defines its path.

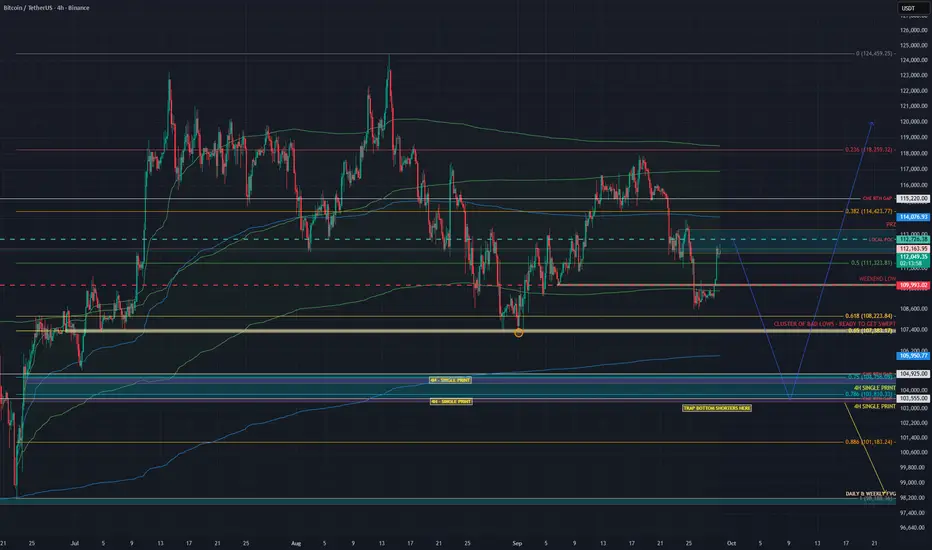
SHORT BITCOIN – THE TRAP IS BELOW, NOT ABOVE!Traders,
From the current levels around $112.8K–$113K, I believe Bitcoin is setting up for another leg down into the $104K region.
Why? Because at current levels we already have multiple Anchored VWAPs (AVWAPs) lining up from different swing high → low auctions, which makes this area heavy resistance.
That means the probability of retracing higher is limited, and instead, the market is more likely to drop into $104K — where there’s significant unfinished business — before a proper bounce can occur.
🔮 Hypothesis
From current levels ($112.8K–$113K), price will reject and move down toward $104K.
Retracement higher than $113K is unlikely given AVWAP confluence + resistance stack.
The $104K region will act as a bounce zone, potentially with a Swing Failure Pattern (SFP) wick.
📊 Data & Confluence
🔻 Why $104K Is a Magnet
HTF Point of Control (POC): The high-volume node where markets naturally seek equilibrium.
HTF AVWAP: Anchored VWAP from major pivots aligns here, marking fair value.
4H TPO Single Prints + Fib Retracements (0.75–0.786): Gaps in auction structure converge with key Fibonacci levels.
CME Gap: The $104K CME RTH gap still needs filling — markets often return here for balance.
Sept 1st Low (Weekly TPO): Poor excess signals unfinished auction business, pulling price back down.
🔼 Why Current Levels Won’t Hold
Clustered AVWAPs (different swing high → low auctions): Acting as strong dynamic resistance.
Multiple POCs at current zone: Volume saturation suggests exhaustion.
Fibonacci confluence + harmonic pattern: Pointing to lower continuation.
💵 Macro Flows
USDT Dominance (USDT.D): Breaking higher → capital shifting to stablecoins → bearish BTC.
Aggregated CVD: Spot CVD drifting slightly higher, but futures CVD flat with no OI expansion.
→ No real demand behind the move.
📌 My Take
Bitcoin is most likely to:
Reject from current AVWAP resistance ($112.8K–$113K).
Drop into $104K, clearing imbalances and luring in shorts below the 0.786 fib.
Trigger a wick/squeeze move up (Swing Failure Pattern) to trap those late shorters.
⚠️ If $104K fails to hold, next target is the imbalance zone around $98.5K.
✅ Conclusion
The market is loaded with resistance at current levels. Until that’s broken with conviction, the path of least resistance is down into $104K.
That’s where the real battle will be.
Trade safe, manage risk, and don’t get trapped on the wrong side of the wick.
Ethereum New Update (12H)On the chart, we have a bearish CH and a resistance SWAP zone has formed. This SWAP zone has been broken downward, and now on the pullback to this area, we can look for sell/short positions. As long as the price does not reclaim and hold above this zone, the bearish outlook on Ethereum remains valid
If the price strongly breaks TP1 to the downside, a much deeper drop may occur
A daily candle closing above the invalidation level would invalidate this analysis
For risk management, please don't forget stop loss and capital management
When we reach the first target, save some profit and then change the stop to entry
Comment if you have any questions
Thank You

Never miss Eth on 4160 !I am all eyes on Eth to break my trigger line (around 4230). then the buy setup on 4160 will be activated :)
First midterm target --> 6300

ETHUSD - Weekly Indicator ShiftWeekly chart for ETHUSD, it can be seen that the Gaussian Channel indicator has shifted from bearish to bullish or red to green on this timeframe.
Looking really good for Ethereum heading into a possible strong alt coin season.

#ETHUSDT (4H Chart)#ETHUSDT
(4H Chart)
🔹️ Ethereum Analysis 🔹️
For Ethereum, we have two important resistance levels that could lead to a significant correction:
🔴 Resistances (marked with red boxes):
🎯 First range: 4260 to 4352 USD
🎯 Second range: 4550 to 4635 USD
Supports:
🟡 Yellow box (short-term support): 3525 to 3445 USD — likely to be touched if Bitcoin reaches 100,000 USD
🟢 Green box (main support): 2800 to 2700 USD
💡 Summary:
We expect a small initial rise, then a correction down to the yellow box, and after the yellow box is touched, this analysis will be updated.
🚀 If you enjoyed this analysis, please give it a boost 💙
And to not miss any new analyses or setups, make sure to follow me 📊
🆔️ @Rasoolahmadi

DGB CAN ENTER 40% TREND INCREASE - Update 29-09-2025DGB/USDT Trading Update
🔹 Main trend support: DGB is currently holding around its main trend level, showing early signs of stability after a strong correction.
We have seen before similar trend
🔄 New cycle forming: A recovery setup is visible, with the market potentially entering a new cycle if momentum continues upward.
🎯 First target: The next significant target lies at $0.0106, aligning with resistance from the previous cycle.
📈 Upside potential: If this cycle gains confirmation, there is a 40% increase potential from current levels, making this a key area to watch.
📌 Summary:
DGB is stabilizing at the main trend, showing promising signs of a new cycle activation. If the upward push holds, the first target of $0.0106 could mark a potential 40% increase in price.
The previous increase from the start to now until the target took 14 days.

IMX HOLDING THE MAIN TREND AND CAN RETURN HUGE - UPDATE 28-05IMX/USDT Trading Update
🔹 Main trend holding: IMX is holding its main trend support, which is a very important signal for keeping the broader uptrend intact.
🔻 It did lose the low time frame trend and corrected from $0.83 down to the $0.70–$0.75 zone.
🔄 However, holding the main trend gives strong potential that the low time frame trend may return in the coming sessions.
🎯 First target: If recovery continues, the first upside target is set at $1.00, marking a full rebound from this cycle.
📌 Summary:
Despite losing momentum on the low time frame, IMX remains positive as long as it holds the main trend. Expectation stays bullish with the next target toward $1.00.

BITCOIN ON WAY TO MAINTREND - UPDATE 28-09-2025📊BTC/USDT Trading Update
✅ Low time frame confirmed: Bitcoin has established support in the $109.3K – $109.7K zone, which now acts as a strong base.
📈 Price is moving toward the main trend zone ($110.8K – $111.5K). This will be the key resistance area to watch.
🔑 Breakout potential:
If BTC clears the main trend zone, momentum could accelerate with the next target around $112K – $113K.
This would confirm a stronger continuation of the short-term uptrend.
Scenarios:
Bullish case: Hold above $109.3K and break $111.5K → expansion toward $112K – $113K.
Bearish case: Failure to break the main trend could lead to sideways action or retest of $109K support.
📌 Summary:
BTC has confirmed its low time frame breakout and is now targeting the main trend zone. A break above this range will likely fuel a push toward $112K – $113K.
usdt.d 4hHello friends
I am Mehdi and I wanted to say that if you are currently in profit compared to the position we announced
It is better to have a save profit and move the stop loss to the entry point
I would appreciate it if you support me with likes and comments

BTCUSD | Wedge Pattern | 1D🔺 Price Structure: Rising wedge formation unfolding in Elliott Wave count.
🔄 Current Phase: Wave (iv) correction → retesting wedge support.
📍 Demand Zone: $100K – $104K (blue box) = key accumulation area.
📈 Bullish Outlook: Holding support = launchpad for wave (v) rally.
🎯 Target Zone: $140K – $160K (potential ATH breakout).
⚠️ Invalidation: Breakdown below wedge base = structure compromised.
🧠 Mindset: Patience. Precision. Profit.

BTC TREND CHANNEL - BITCOIN TRENDING UPTRENDBitcoin is in a new uptrend on the lower time frames. There is a high chance BTC will target between $112K and $113K in the short term. From there, we could see the daily trend of Bitcoin develop further.
Follow this channel for daily BTC updates
Thank you

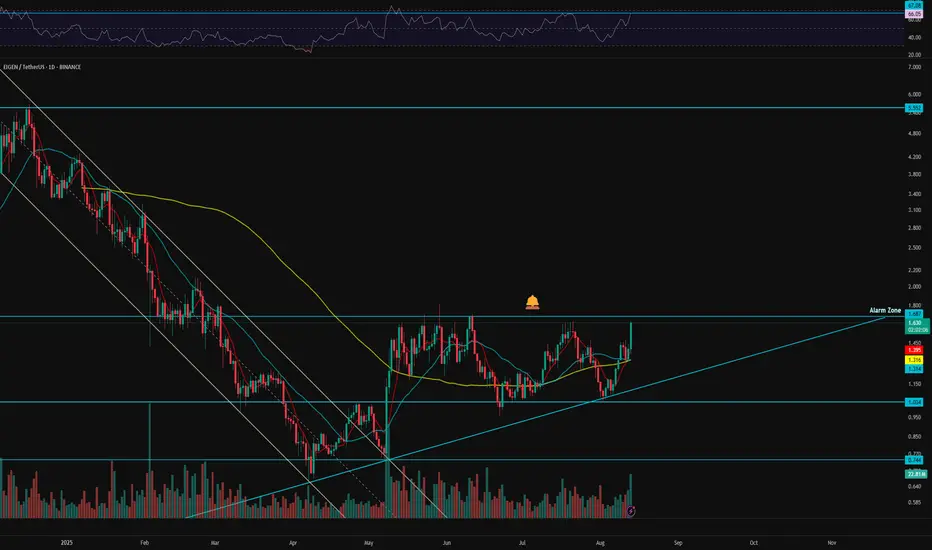
EigenLayer Daily view| DeFi’s Ethereum Restaking Power💀 Hey , how's it going ? Come over here — Satoshi got something for you !
⏰ We’re analyzing EIGEN on the 1-Day timeframe , this coin ranks 132 on CoinMarketCap. It’s a restaking project on the Ethereum network, highly valued and reputable in the DeFi space, and backed by well-known Ethereum developers .
👀 After breaking out of a strong descending channel, this coin moved toward its resistance zone at 1.687 within just three days under strong buying pressure. It was then rejected from this level and formed a bottom at 1.034. This bottom is close to a drawn trendline, and the latest touch of this trendline triggered many buy orders, bringing in significant buying momentum. The key zone for entering a trade is the resistance area that has seen roughly five reactions, each time resulting in rejection. If this daily box breaks, the coin could move to higher price levels.
👑 The 7-day moving average has crossed above both the 25-day and 99-day moving averages, indicating strong buyer power and upward momentum. Moving averages are often used for martingale strategies and as setup confirmations.
⚙️ On the RSI, the key resistance lies around 67.08. A breakout above this level increases the chance of entering the overbought zone, though the major strong resistance is at 70.
🕯 Both trading volume and transaction count are rising, and usually, for coins considered “Ethereum ecosystem projects,” volumes can spike sharply when Ethereum dominance falls.
🔔 We’ve set an alert zone at the 1.687 resistance level. When the price reaches this zone, you can watch the price action and, with confirmation, consider entering a trade.
🖥 Summary : If EigenLayer breaks the 1.687 zone, it could reach much higher price levels. Since it offers a restaking product to the crypto community, it has the potential for strong price surges, as most of its past pumps have happened within just a few candles—even one candle. Don’t forget to set your alert at 1.687 .
❤️ Disclaimer : This analysis is purely based on my personal opinion and I only trade if the stated triggers are activated .
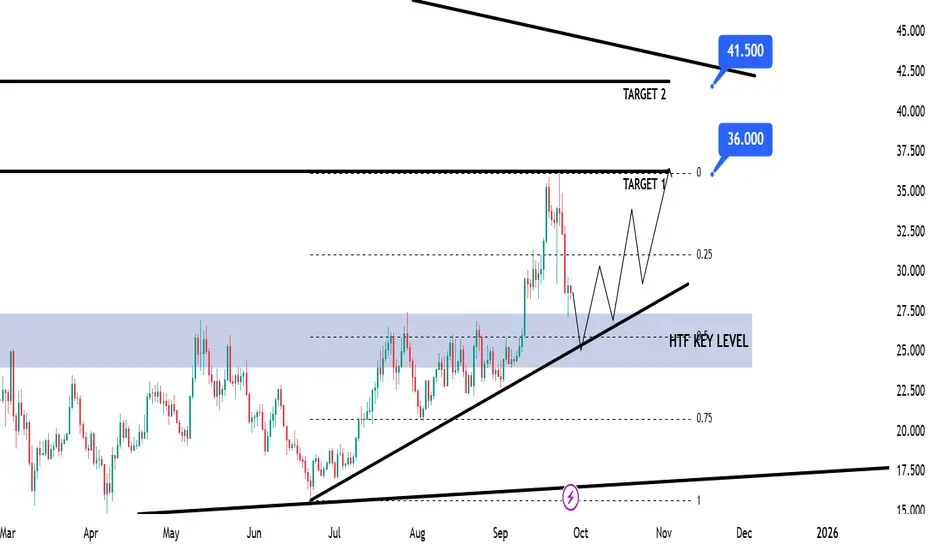
AVAX Swing Long Idea – TTKZD ModelAVAX Swing Long Idea – TTKZD Model
📊 Market Sentiment
FED has resumed its rate-cutting cycle, starting with a 0.25% cut in September, with two more expected. Institutional liquidity inflows have accelerated as the U.S. officially adopts crypto as part of its reserves. Despite elevated inflation, a weakening labor market is forcing the FED to ease, pushing more capital into risk-on assets.
📈 Technical Analysis
Price remains in a HTF bullish trend, signaling continuation potential.
Price broke the HTF Key Zone and closed aggressively above → strong buyer defense.
Supported by the HTF Bullish Trendline → potential retest & rejection.
Approaching the Fibonacci 0.5 equilibrium (discount) → ideal for long positioning.
📘 Model to be used – TTKZD (Trendline + Key Zone + Discount)
In this model, we look for 3 confluences:
1-Clear HTF bullish trendline supporting structure
2-HTF Key Zone defense after aggressive break
3-Fibonacci 0.5 discount zone as entry alignment
📌 Game Plan
Price to test bullish trendline
Retest of HTF Key Zone
Confluence at 0.5 discount → long entry
🎯 Setup Trigger
12H Break of Structure → confirmation for entry.
📋 Trade Management
Stoploss: Below 12H swing low that creates BOS
Targets:
TP1 → $36
TP2 → $41.5
Move stop to breakeven after TP1.
💬 Like, follow, and comment if this breakdown supports your trading! More setups and insights coming soon — stay connected!
⚠️ Disclaimer: This content is for educational purposes only and does not constitute financial advice. Always DYOR before trading.
usdt.d 4husdt.d 4h
🔎 A few notes from the chart:
The chart is located on the PRZ (Potential Reversal Zone) or the harmonic pattern completion zone.
The candles have reached an important resistance zone after rising.
At PRZ, we usually expect a reversal (return to the bottom), especially when it overlaps with Fibonacci levels and the trend line.
It is characteristic that a green rectangle (probably a sell position) has been drawn on the chart, which indicates that we expect a decline.
📌 Conclusion:
Due to the harmonic structure + PRZ support, the probability of a price reversal and a downward move is higher ✅

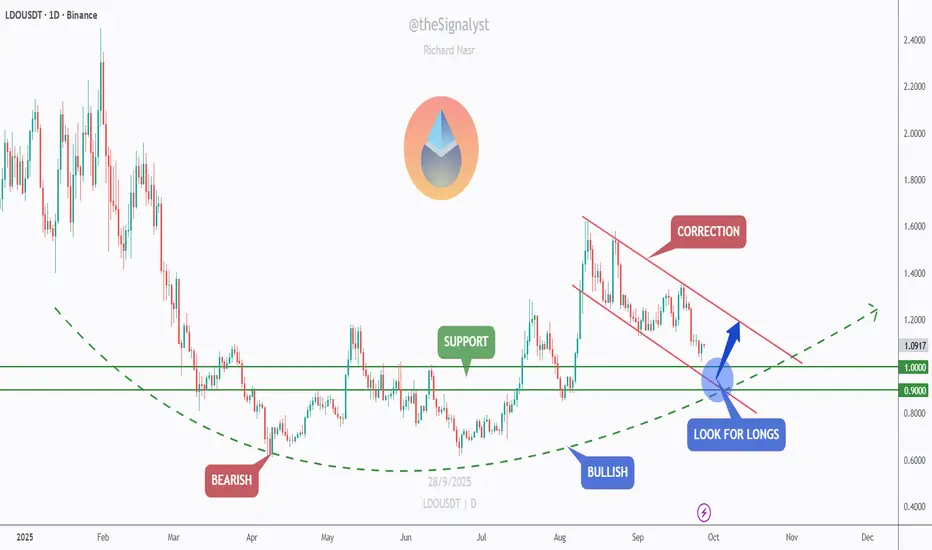
LDO – Waiting at the $1 ConfluenceLDO is overall bullish and currently in a correction phase inside a falling red channel. I’m waiting for price to reach the confluence of the support zone + round number $1.00 + lower red trendline. That intersection is where I’ll look for longs if we get a clear bullish reaction.
If we bounce: first targets $1.15–$1.20, then $1.30–$1.40 (channel top). A clean break/retest above $1.10 would add confirmation.
Invalidation: a daily close below $0.90 would put the setup on hold.
Does the $1 confluence hold and kick off the next leg up? 🤔
⚠️ Disclaimer: This is not financial advice. Always do your own research and manage risk properly.
📚 Stick to your trading plan regarding entries, risk, and management.
Good luck! 🍀
All Strategies Are Good; If Managed Properly!
~Richard Nasr