EUR/USD Hints At Swing LowA small doji formed on Wednesday, snapping a three-day losing streak for EUR/USD. The session low respected the 100-day EMA as support, while the brief dip below the monthly S1 pivot proved to be a false break.
The bias remains bullish while prices hold above the 1.1544 swing low. Bulls could look to buy dips towards the monthly S1 pivot in anticipation of a move up towards the 1.17 handle and monthly pivot point (1.1754).
Matt Simpson, Market Analyst at City Index and Forex.com
J-USD

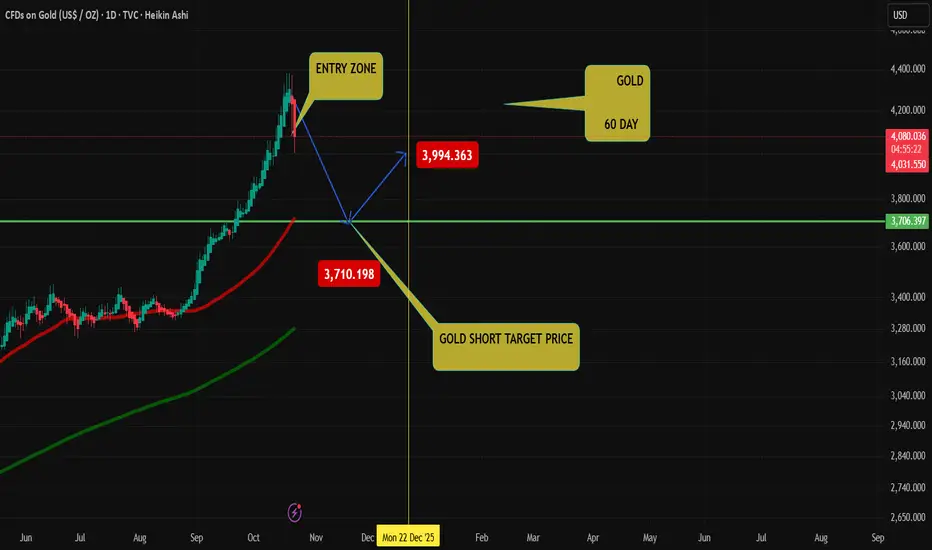
GOLD US SHORTGOLD 60 DAY Target point
You try! Easy Money,
The gold Only long position after!!!
check my profile gold / play button
Gold Consolidates After Biggest One-Day Drop Since 2013GOLD | Price Slips After Tuesday’s Massive Selloff
Gold remains under pressure after recording its largest one-day drop since 2013, falling more than 6% (≈ $250).
Despite the steep decline, long-term fundamentals such as central-bank demand and geopolitical uncertainty continue to provide underlying support.
For now, the metal is consolidating between $4,011 and $4,056, awaiting a decisive breakout.
A 15-minute close below $4,011 would confirm continuation toward $3,979 → $3,945 → $3,894.
A close above $4,057–$4,074 would trigger a bullish reversal, targeting $4,101 → $4,162.
Pivot Line: 4,011
Support: 3,979 · 3,945 · 3,894
Resistance: 4,056 · 4,075 · 4,101
previous idea:

EURUSD, technical analysis 1WHellou traders,
We bring you an important technical analysis of the EURUSD currency pair.
The value of this asset reached the key level of 1.19, where was a significant reaction. According to Elliott waves, we can see that the abc structure is complete, absolutely perfectly 1:1 = A:C. The RSI indicator also indicates a bearish divergence. The downtrend in the long term also persists. Liquidity was taken.
One unclear fact in the chart is still unfilled price GAP - we must be careful and cannot just ignore it, it is theoretically possible that the price will come through it.
The conclusion is that the chart shows all the parameters leading to a downtrend.
What do you think about it?
We will gradually bring you more current analyses from other charts and time frames.
So don't forget to follow us!
Thanks
WavePulse

USDCAD H1 | Bullish Bounce Off SupportBased on the H1 chart analysis, we can see that the price has bounced off the buy entry which is a pullback support and could rise from this level to the upside.
Buy entry is at 1.3998, whichis a pullback support.
Stop loss is at 1.3983, whichis a pullback support that aligns with the 138.2% Fibonacci extension.
Take profit is at 1.4028, whichis a pullback resistance that aligns with the 50% Fibonacci retracement.
Stratos Markets Limited (tradu.com ):
CFDs are complex instruments and come with a high risk of losing money rapidly due to leverage. 68% of retail investor accounts lose money when trading CFDs with this provider. You should consider whether you understand how CFDs work and whether you can afford to take the high risk of losing your money.
Stratos Europe Ltd (tradu.com ):
CFDs are complex instruments and come with a high risk of losing money rapidly due to leverage. 70% of retail investor accounts lose money when trading CFDs with this provider. You should consider whether you understand how CFDs work and whether you can afford to take the high risk of losing your money.

NZDUSD H1 | Potential Bearish Reversal off Key Fibonacci LevelKIWI (NZD/USD) is rising towards the sell entry which is a pullback resistance that aligns with the 138.2% Fibonacci extension and could reverse from this level to the take profit.
Sell entry is at 0.5767, whichis a pullback resistance that lines up with the 138.2% Fibonacci extension.
Stop loss is at 0.5782, whichis a pullback resistance.
Take profit is at 0.5727, whichis a pullback support.
Stratos Markets Limited (tradu.com):
CFDs are complex instruments and come with a high risk of losing money rapidly due to leverage. 68% of retail investor accounts lose money when trading CFDs with this provider. You should consider whether you understand how CFDs work and whether you can afford to take the high risk of losing your money.
Stratos Europe Ltd (tradu.com ):
CFDs are complex instruments and come with a high risk of losing money rapidly due to leverage. 70% of retail investor accounts lose money when trading CFDs with this provider. You should consider whether you understand how CFDs work and whether you can afford to take the high risk of losing your money.

AUDUSD H1 | Sharp Bearish DropAussie (AUD/USD) has rejected off the sell entry which is a pullback resistance that aligns with the 61.8% Fibonacci retracement and could drop from this level to the downside.
Sell entry is at 0.6508, which is a pullback resistance that lines up with the 61.8% Fibonacci retracement.
Stop loss is at 0.6542, which is a pullback resistance that lines up with the 127.2% Fibonacci extension.
Take profit is at 0.6459, whichis a pullback support.
Stratos Markets Limited (tradu.com ):
CFDs are complex instruments and come with a high risk of losing money rapidly due to leverage. 68% of retail investor accounts lose money when trading CFDs with this provider. You should consider whether you understand how CFDs work and whether you can afford to take the high risk of losing your money.
Stratos Europe Ltd (tradu.com ):
CFDs are complex instruments and come with a high risk of losing money rapidly due to leverage. 70% of retail investor accounts lose money when trading CFDs with this provider. You should consider whether you understand how CFDs work and whether you can afford to take the high risk of losing your money.

USDJPY H1 | Bullish Bounce off Pullback SupportUSD/JPY is falling towards the buy entry which is a pullback support and could bounce from this level to the upside.
Buy entry is at 151.30, whichis a pullback support.
Stop loss is at 150.60, which is a pullback support that is slightly above the 61.8% Fibonacci retracement.
Take profit is at 152.50, which is an overlap resistance that aligns with the 78.6% Fibonacci retracement.
Stratos Markets Limited (tradu.com ):
CFDs are complex instruments and come with a high risk of losing money rapidly due to leverage. 68% of retail investor accounts lose money when trading CFDs with this provider. You should consider whether you understand how CFDs work and whether you can afford to take the high risk of losing your money.
Stratos Europe Ltd (tradu.com ):
CFDs are complex instruments and come with a high risk of losing money rapidly due to leverage. 70% of retail investor accounts lose money when trading CFDs with this provider. You should consider whether you understand how CFDs work and whether you can afford to take the high risk of losing your money.

Bearish reversal for Bitcoin?The price is rising towards the pivot and could reverse to the pullback support.
Pivot: 108,846.88
1st Suport: 104,701.40
1st Resistance: 113,431.55
Disclaimer:
The above opinions given constitute general market commentary, and do not constitute the opinion or advice of IC Markets or any form of personal or investment advice.
Any opinions, news, research, analyses, prices, other information, or links to third-party sites contained on this website are provided on an "as-is" basis, are intended only to be informative, is not an advice nor a recommendation, nor research, or a record of our trading prices, or an offer of, or solicitation for a transaction in any financial instrument and thus should not be treated as such. The information provided does not involve any specific investment objectives, financial situation and needs of any specific person who may receive it. Please be aware, that past performance is not a reliable indicator of future performance and/or results. Past Performance or Forward-looking scenarios based upon the reasonable beliefs of the third-party provider are not a guarantee of future performance. Actual results may differ materially from those anticipated in forward-looking or past performance statements. IC Markets makes no representation or warranty and assumes no liability as to the accuracy or completeness of the information provided, nor any loss arising from any investment based on a recommendation, forecast or any information supplied by any third-party.

GBP/JPY Short Trade Setup – H1 TimeframeFollowing last week’s gap open after the Japanese elections, GBP/JPY has shown significant signs of distribution on the 1-hour chart. Many traders entered short positions prematurely during the immediate post-gap volatility, resulting in widespread stop-outs and losses.
Today, the UK CPI print came in at 4.0%, marking the highest inflation level since 2020. This stronger-than-expected inflation data initially supported the pound, but price action now appears to be exhausting into key resistance, suggesting a potential short opportunity.
I initiated a short position at 203.30—an early entry anticipating further weakness. However, based on the current structure and my technical levels, there is still a valid opportunity to enter now with proper confirmation and alignment to my key levels.
Note: Risk management remains paramount. Ensure your position sizing, stop placement, and trade plan are consistent with your overall trading strategy.

GBP/USD – Sell Entry (H1 – Channel Pattern)
The GBP/USD Pair, Price has been trading within a Channel Pattern on the H1 chart, forming consistent lower highs and lower lows. Price action is now testing the lower boundary of the pattern, signalling a possible breakdown.
✅Market Context:
1️⃣Downward structure building inside the pattern.
2️⃣Sellers are showing strength near support levels.
3️⃣Breakdown below the trendline indicates momentum continuation toward lower zones.
✅Trade Plan:
Entry: Sell after confirmed breakdown below the support (Candle close below trendline or retest of the breakout).
💰Take Profit (TP): At the Key Zone – major support area identified ahead.
🛑Stop Loss (SL): Above the pattern structure / recent swing high.
✅Psychological Discipline:
1️⃣Stick to plan – No Revenge Trades.
2️⃣Accept losing trades as part of the strategy.
3️⃣Risk only 1–2% of your account balance per trade.
💬 Support the community: If you found this useful, drop a 👍 like and share your thoughts in the comments!
⚠️ Disclaimer: This analysis is for educational purposes only and does not constitute financial advice. Forex trading involves high risk. Trade only with capital you can afford to lose and always do your own research.

GBP/USD - Fundamental Drive Ahead! (21.10.2025)🧠 Setup Overview:
GBP/USD has broken below its rising trendline after testing the 1.3470 resistance zone multiple times. The pair is under fundamental selling pressure, fueled by risk aversion and renewed U.S. dollar strength.
Fundamental Drivers:
1️⃣ U.S. markets gained as President Trump decided not to impose very high tariffs on Chinese goods, which temporarily boosted sentiment.
2️⃣ However, investors are now digesting U.S. credit risks and US–China trade tensions, both adding safe-haven demand to the USD.
3️⃣ Meanwhile, the UK economy faces uncertainty from softer consumer spending and weak housing data — further limiting GBP’s upside potential.
📉 Technical Plan:
Bias: Bearish below 1.3400
Structure: Trendline breakdown confirmed
Cloud Resistance: Adds confluence to downside momentum
Next Levels to Watch:
🟥 1st Support: 1.3349
🟥 2nd Support: 1.3310
📊 If price closes below 1.3349 on the 30-min chart, further selling pressure may extend toward 1.3310 and possibly deeper if fundamentals align.
#GBPUSD #Forex #TechnicalAnalysis #PriceAction #Ichimoku #TrendlineBreak #FXMarket #BearishSetup #TradingView #KABHI_TA_TRADING
⚠️ Disclaimer:
This analysis is for educational purposes only — not financial advice. Always manage your risk and use proper position sizing before entering any trade.
📣 Support My Work
If you found this analysis useful — LIKE 👍, COMMENT 💬, and FOLLOW 🔔 to stay updated with daily Forex setups!

USDCHF H1 | Possible Uptrend AheadSwissie (USD/CHF) has bounced off the buy entry which is an overlap support and could rise from this level to the take profit.
Buy entry is at 0.7937, whichis an overlap support.
Stop loss is at 0.7907, which is a pullback support.
Take profit is at 0.7986, which is an overlap resistance that aligns with the 61.8% Fibonacci retracement.
High Risk Investment Warning
Trading Forex/CFDs on margin carries a high level of risk and may not be suitable for all investors. Leverage can work against you.
Stratos Markets Limited (tradu.com ):
CFDs are complex instruments and come with a high risk of losing money rapidly due to leverage. 65% of retail investor accounts lose money when trading CFDs with this provider. You should consider whether you understand how CFDs work and whether you can afford to take the high risk of losing your money.
Stratos Europe Ltd (tradu.com ):
CFDs are complex instruments and come with a high risk of losing money rapidly due to leverage. 66% of retail investor accounts lose money when trading CFDs with this provider. You should consider whether you understand how CFDs work and whether you can afford to take the high risk of losing your money.
Stratos Global LLC (tradu.com ):
Losses can exceed deposits.
Please be advised that the information presented on TradingView is provided to Tradu (‘Company’, ‘we’) by a third-party provider (‘TFA Global Pte Ltd’). Please be reminded that you are solely responsible for the trading decisions on your account. There is a very high degree of risk involved in trading. Any information and/or content is intended entirely for research, educational and informational purposes only and does not constitute investment or consultation advice or investment strategy. The information is not tailored to the investment needs of any specific person and therefore does not involve a consideration of any of the investment objectives, financial situation or needs of any viewer that may receive it. Kindly also note that past performance is not a reliable indicator of future results. Actual results may differ materially from those anticipated in forward-looking or past performance statements. We assume no liability as to the accuracy or completeness of any of the information and/or content provided herein and the Company cannot be held responsible for any omission, mistake nor for any loss or damage including without limitation to any loss of profit which may arise from reliance on any information supplied by TFA Global Pte Ltd.
The speaker(s) is neither an employee, agent nor representative of Tradu and is therefore acting independently. The opinions given are their own, constitute general market commentary, and do not constitute the opinion or advice of Tradu or any form of personal or investment advice. Tradu neither endorses nor guarantees offerings of third-party speakers, nor is Tradu responsible for the content, veracity or opinions of third-party speakers, presenters or participants.

GBPUSD H1 | Bearish Continuation SetupCable (GBP/USD) has rejected off the sell entry which is a pullback resistance and could potentially drop from this level to the downside.
Sell entry is at 1.3390, which is a pullback resistance.
Stop loss is at 1.3439, whichis a pullback resistance.
Take profit is at 1.3327, which is an overlap support that is slightly below the 61.8% Fibonacci retracement.
High Risk Investment Warning
Trading Forex/CFDs on margin carries a high level of risk and may not be suitable for all investors. Leverage can work against you.
Stratos Markets Limited (tradu.com ):
CFDs are complex instruments and come with a high risk of losing money rapidly due to leverage. 65% of retail investor accounts lose money when trading CFDs with this provider. You should consider whether you understand how CFDs work and whether you can afford to take the high risk of losing your money.
Stratos Europe Ltd (tradu.com ):
CFDs are complex instruments and come with a high risk of losing money rapidly due to leverage. 66% of retail investor accounts lose money when trading CFDs with this provider. You should consider whether you understand how CFDs work and whether you can afford to take the high risk of losing your money.
Stratos Global LLC (tradu.com ):
Losses can exceed deposits.
Please be advised that the information presented on TradingView is provided to Tradu (‘Company’, ‘we’) by a third-party provider (‘TFA Global Pte Ltd’). Please be reminded that you are solely responsible for the trading decisions on your account. There is a very high degree of risk involved in trading. Any information and/or content is intended entirely for research, educational and informational purposes only and does not constitute investment or consultation advice or investment strategy. The information is not tailored to the investment needs of any specific person and therefore does not involve a consideration of any of the investment objectives, financial situation or needs of any viewer that may receive it. Kindly also note that past performance is not a reliable indicator of future results. Actual results may differ materially from those anticipated in forward-looking or past performance statements. We assume no liability as to the accuracy or completeness of any of the information and/or content provided herein and the Company cannot be held responsible for any omission, mistake nor for any loss or damage including without limitation to any loss of profit which may arise from reliance on any information supplied by TFA Global Pte Ltd.
The speaker(s) is neither an employee, agent nor representative of Tradu and is therefore acting independently. The opinions given are their own, constitute general market commentary, and do not constitute the opinion or advice of Tradu or any form of personal or investment advice. Tradu neither endorses nor guarantees offerings of third-party speakers, nor is Tradu responsible for the content, veracity or opinions of third-party speakers, presenters or participants.

EURUSD H1 | Bullish Reversal from Pullback SupportEUR/USD is falling towards the buy entry which is a pullback support and could bounce from this level to the upside.
Buy entry is at 1.1591, which is a pullback support.
Stop loss is at 1.1560, which is a pullback support.
Take profit is at 1.1646, whichis an overlap resistance.
High Risk Investment Warning
Trading Forex/CFDs on margin carries a high level of risk and may not be suitable for all investors. Leverage can work against you.
Stratos Markets Limited (tradu.com ):
CFDs are complex instruments and come with a high risk of losing money rapidly due to leverage. 65% of retail investor accounts lose money when trading CFDs with this provider. You should consider whether you understand how CFDs work and whether you can afford to take the high risk of losing your money.
Stratos Europe Ltd (tradu.com ):
CFDs are complex instruments and come with a high risk of losing money rapidly due to leverage. 66% of retail investor accounts lose money when trading CFDs with this provider. You should consider whether you understand how CFDs work and whether you can afford to take the high risk of losing your money.
Stratos Global LLC (tradu.com ):
Losses can exceed deposits.
Please be advised that the information presented on TradingView is provided to Tradu (‘Company’, ‘we’) by a third-party provider (‘TFA Global Pte Ltd’). Please be reminded that you are solely responsible for the trading decisions on your account. There is a very high degree of risk involved in trading. Any information and/or content is intended entirely for research, educational and informational purposes only and does not constitute investment or consultation advice or investment strategy. The information is not tailored to the investment needs of any specific person and therefore does not involve a consideration of any of the investment objectives, financial situation or needs of any viewer that may receive it. Kindly also note that past performance is not a reliable indicator of future results. Actual results may differ materially from those anticipated in forward-looking or past performance statements. We assume no liability as to the accuracy or completeness of any of the information and/or content provided herein and the Company cannot be held responsible for any omission, mistake nor for any loss or damage including without limitation to any loss of profit which may arise from reliance on any information supplied by TFA Global Pte Ltd.
The speaker(s) is neither an employee, agent nor representative of Tradu and is therefore acting independently. The opinions given are their own, constitute general market commentary, and do not constitute the opinion or advice of Tradu or any form of personal or investment advice. Tradu neither endorses nor guarantees offerings of third-party speakers, nor is Tradu responsible for the content, veracity or opinions of third-party speakers, presenters or participants.

USDCADNot financial advice. The essence of investing & trading is the intelligent and patient preying on the greed, fear, impatience, addiction and ignorance of the majority. It's definitionally Darwinian.

USDJPY Had its 1st 1D Golden Cross since Dec 2024.The USDJPY pair has been trading within a Channel Up pattern since the April 22 2025 market bottom and just last week, it formed the first 1D Golden Cross since December 16 2024. As you can see, all three 1D Golden Crosses since June 2023 have been strong Buy Signals.
All have been formed within Channel Up patterns that formed Higher Highs just after the crosses. The target of the current Channel Up is 154.000, which represents a +6.06% rise, similar to both previous Bullish Legs of this pattern. The uptrend is so far restricted by the presence of the Lower Highs trend-line that started back on the July 03 2024 market Top.
This time however we may see this break as the 1W RSI has already broken above its own Lower Highs trend-line, signaling an early bullish warning. As a result, if the July 2024 Lower Highs trend-line breaks, we expect the pair to eye the upper Resistance at 159.000.
-------------------------------------------------------------------------------
** Please LIKE 👍, FOLLOW ✅, SHARE 🙌 and COMMENT ✍ if you enjoy this idea! Also share your ideas and charts in the comments section below! This is best way to keep it relevant, support us, keep the content here free and allow the idea to reach as many people as possible. **
-------------------------------------------------------------------------------
💸💸💸💸💸💸
👇 👇 👇 👇 👇 👇

Bearish reversal off 61.8% FIbonacci resistance?AUD/USD is rising towards the resistance level, which is a pullback resistance that aligns with the 61.8% Fibonacci retracement and could reverse from this level to our take profit.
Entry: 0.6508
Why we like it:
Why we like it:
There is a pullback resistance level that lines up with the 61.8% Fibonacci retracement.
Stop loss: 0.6542
Why we like it:
There is a pullback resistance that lines up with the 127.2% Fibonacci extension.
Take profit: 0.6443
Why we like it:
There is a multi-swing low support level.
Enjoying your TradingView experience? Review us!
Please be advised that the information presented on TradingView is provided to Vantage (‘Vantage Global Limited’, ‘we’) by a third-party provider (‘Everest Fortune Group’). Please be reminded that you are solely responsible for the trading decisions on your account. There is a very high degree of risk involved in trading. Any information and/or content is intended entirely for research, educational and informational purposes only and does not constitute investment or consultation advice or investment strategy. The information is not tailored to the investment needs of any specific person and therefore does not involve a consideration of any of the investment objectives, financial situation or needs of any viewer that may receive it. Kindly also note that past performance is not a reliable indicator of future results. Actual results may differ materially from those anticipated in forward-looking or past performance statements. We assume no liability as to the accuracy or completeness of any of the information and/or content provided herein and the Company cannot be held responsible for any omission, mistake nor for any loss or damage including without limitation to any loss of profit which may arise from reliance on any information supplied by Everest Fortune Group.

Bullish momentum set to continue?USD/JPY is falling towards the support level, which is an overlap support that lines up with the 38.2% Fibonacci retracement and could bounce from this level to our take profit.
Entry: 151.21
Why we like it:
There is an overlap support that lines up with the 38.2% Fibonacci retracement.
Stop loss: 150.41
Why we like it:
There is a pullback support that aligns with the 61.8% Fibonacci retracement.
Take profit: 153.13
Why we like it:
There is a swing high resistance level.
Enjoying your TradingView experience? Review us!
Please be advised that the information presented on TradingView is provided to Vantage (‘Vantage Global Limited’, ‘we’) by a third-party provider (‘Everest Fortune Group’). Please be reminded that you are solely responsible for the trading decisions on your account. There is a very high degree of risk involved in trading. Any information and/or content is intended entirely for research, educational and informational purposes only and does not constitute investment or consultation advice or investment strategy. The information is not tailored to the investment needs of any specific person and therefore does not involve a consideration of any of the investment objectives, financial situation or needs of any viewer that may receive it. Kindly also note that past performance is not a reliable indicator of future results. Actual results may differ materially from those anticipated in forward-looking or past performance statements. We assume no liability as to the accuracy or completeness of any of the information and/or content provided herein and the Company cannot be held responsible for any omission, mistake nor for any loss or damage including without limitation to any loss of profit which may arise from reliance on any information supplied by Everest Fortune Group.

Potential bullish rise?USD/CHF is reacting off the support level which is a pullback support and could rise from this level to our take profit.
Entry: 0.7942
Why we like it:
There is a pullback support level.
Stop loss: 0.7893
Why we like it:
There is a pullback support level.
Take profit: 0.8010
Why we like it:
There is a pullback resistance that is slightly above the 61.8% Fibonacci retracement.
Enjoying your TradingView experience? Review us!
Please be advised that the information presented on TradingView is provided to Vantage (‘Vantage Global Limited’, ‘we’) by a third-party provider (‘Everest Fortune Group’). Please be reminded that you are solely responsible for the trading decisions on your account. There is a very high degree of risk involved in trading. Any information and/or content is intended entirely for research, educational and informational purposes only and does not constitute investment or consultation advice or investment strategy. The information is not tailored to the investment needs of any specific person and therefore does not involve a consideration of any of the investment objectives, financial situation or needs of any viewer that may receive it. Kindly also note that past performance is not a reliable indicator of future results. Actual results may differ materially from those anticipated in forward-looking or past performance statements. We assume no liability as to the accuracy or completeness of any of the information and/or content provided herein and the Company cannot be held responsible for any omission, mistake nor for any loss or damage including without limitation to any loss of profit which may arise from reliance on any information supplied by Everest Fortune Group.

GBPUSD: Breakout and Potential RetraceHey Traders, in today's trading session we are monitoring GBPUSD for a buying opportunity around 1.33600 zone, GBPUSD was trading in a downtrend and successfully managed to break it out. Currently is in a correction phase in which it is approaching the retrace area at 1.33600 support and resistance zone.
Trade safe, Joe.

Bearish drop off?EUR/USD is reacting off the resistance level which is an overlap resistance that is slightly below the 23.6% Fibonacci retracement and could drop from this level to our take rpofit.
Entry: 1.1622
Why we like it:
There is an overlap resistance that is slightly below the 23.6% Fibonacci retracement.
Stop loss: 1.1669
Why we like it:
There is a pullback resistance that is slightly above the 50% Fibonacci retracement.
Take profit: 1.1560
Why we like it:
There is a pullback support level.
Enjoying your TradingView experience? Review us!
Please be advised that the information presented on TradingView is provided to Vantage (‘Vantage Global Limited’, ‘we’) by a third-party provider (‘Everest Fortune Group’). Please be reminded that you are solely responsible for the trading decisions on your account. There is a very high degree of risk involved in trading. Any information and/or content is intended entirely for research, educational and informational purposes only and does not constitute investment or consultation advice or investment strategy. The information is not tailored to the investment needs of any specific person and therefore does not involve a consideration of any of the investment objectives, financial situation or needs of any viewer that may receive it. Kindly also note that past performance is not a reliable indicator of future results. Actual results may differ materially from those anticipated in forward-looking or past performance statements. We assume no liability as to the accuracy or completeness of any of the information and/or content provided herein and the Company cannot be held responsible for any omission, mistake nor for any loss or damage including without limitation to any loss of profit which may arise from reliance on any information supplied by Everest Fortune Group.

#035: USD/JPY Long Investment Opportunity
In recent days, the USD/JPY pair has experienced a period of considerable uncertainty, alternating between impulsive movements and periods of consolidation. Hello, I'm Andrea Russo, an independent Forex trader and prop trader with $200,000 in capital under management. Thank you in advance for your time.
At first glance, it may seem like a confusing market, but behind this apparent calm lies a delicate balance between monetary policy, relative strength, and the positioning of the largest operators.
My attention has focused on a specific price area where the market has shown signs of absorbing bearish pressure. The latest candlesticks have highlighted a slowdown in selling and, more importantly, increased buying in moments of weakness—a typical behavior of strong hands in the accumulation phase.
The macroeconomic context remains clear: the United States maintains an advantage in terms of interest rates and yields, while Japan continues to demonstrate accommodative policies. This divergence, although already known to the market, continues to support the dollar at key moments. However, it's not so much the overall direction that matters, but the timing with which the price shows its willingness to resume its rally after a natural pause.
I chose to position myself early, not to chase the movement, but to wait for the market to catch me at the point where demand exceeds supply. It's a strategy that requires patience and composure: it's not about predicting, but knowing how to wait for institutional pressure to confirm your intention.
