USDJPY - 2000pip Reversal Incoming!USDJPY is setting up for a 2000pip impulse!
We've seen a bearish impulse at the start of this year and since then we've been in a correction. We are expecting another impulse very soon, rivalling the first one!
Trade Idea:
- Watch for price to move into our reversal zone
- once there, look for trendline break, BOS or other reversal signs
- Take profit: 140 (1500pips), 135 (2000pips)
Short Term Buys:
In the meantime, we can look to trade the move up into the sell zone. Expecting a bounce off the fibonacci. Invalidation level is 145.4. A break below that level will invalidation this short term buys.
See below for the short term buys.
USDJPY 12H
Goodluck and as always, trade safe!
J-USD

GBPUSD Breakout and Potential RetraceHey Traders, in today' trading session we are monitoring GBPUSD for a buying opportunity around 1.33600 zone, GBPUSD was trading in downtrend and successfully managed to break it out, Currently is in a correction phase in which it is approaching the retrace area at 1.33600 support and resistance zone.
Trade safe, Joe.

LTCUSD H4 | Bearish drop offLitecoin (LTC/USD) is reacting off the sell entry which is an overlap resistance that aligns with the 38.2% Fibonacci retracement and could reverse from this levle to he take profit.
Entry is at 107.36, which is an overlap resistance that aligns with the 38.2% Fibonacci retracement.
Stop loss is at 111.31, which is a pullback resistance that is slightly below the 61.8% Fibonacci retracement.
Take profit is at 101.34, which is a multi swing low support.
High Risk Investment Warning
Trading Forex/CFDs on margin carries a high level of risk and may not be suitable for all investors. Leverage can work against you.
Stratos Markets Limited (tradu.com ):
CFDs are complex instruments and come with a high risk of losing money rapidly due to leverage. 65% of retail investor accounts lose money when trading CFDs with this provider. You should consider whether you understand how CFDs work and whether you can afford to take the high risk of losing your money.
Stratos Europe Ltd (tradu.com ):
CFDs are complex instruments and come with a high risk of losing money rapidly due to leverage. 66% of retail investor accounts lose money when trading CFDs with this provider. You should consider whether you understand how CFDs work and whether you can afford to take the high risk of losing your money.
Stratos Global LLC (tradu.com ):
Losses can exceed deposits.
Please be advised that the information presented on TradingView is provided to Tradu (‘Company’, ‘we’) by a third-party provider (‘TFA Global Pte Ltd’). Please be reminded that you are solely responsible for the trading decisions on your account. There is a very high degree of risk involved in trading. Any information and/or content is intended entirely for research, educational and informational purposes only and does not constitute investment or consultation advice or investment strategy. The information is not tailored to the investment needs of any specific person and therefore does not involve a consideration of any of the investment objectives, financial situation or needs of any viewer that may receive it. Kindly also note that past performance is not a reliable indicator of future results. Actual results may differ materially from those anticipated in forward-looking or past performance statements. We assume no liability as to the accuracy or completeness of any of the information and/or content provided herein and the Company cannot be held responsible for any omission, mistake nor for any loss or damage including without limitation to any loss of profit which may arise from reliance on any information supplied by TFA Global Pte Ltd.
The speaker(s) is neither an employee, agent nor representative of Tradu and is therefore acting independently. The opinions given are their own, constitute general market commentary, and do not constitute the opinion or advice of Tradu or any form of personal or investment advice. Tradu neither endorses nor guarantees offerings of third-party speakers, nor is Tradu responsible for the content, veracity or opinions of third-party speakers, presenters or participants.

DOTUSD H4 | Bearish continuation in playDOT/USD is rising towards the sell entry, which is a pullback resistance that is slightly above the 23.6% Fibonacci retracement and could drop from this level to the downside.
Sell entry is at 3.937, which is an overlap resistance.
Stop loss is at 4.119, which is a pullback resistance that is slightly below the 50% Fibonacci retracement.
Take profit is at 3.617, which is a pullback support.
High Risk Investment Warning
Trading Forex/CFDs on margin carries a high level of risk and may not be suitable for all investors. Leverage can work against you.
Stratos Markets Limited (tradu.com ):
CFDs are complex instruments and come with a high risk of losing money rapidly due to leverage. 65% of retail investor accounts lose money when trading CFDs with this provider. You should consider whether you understand how CFDs work and whether you can afford to take the high risk of losing your money.
Stratos Europe Ltd (tradu.com ):
CFDs are complex instruments and come with a high risk of losing money rapidly due to leverage. 66% of retail investor accounts lose money when trading CFDs with this provider. You should consider whether you understand how CFDs work and whether you can afford to take the high risk of losing your money.
Stratos Global LLC (tradu.com ):
Losses can exceed deposits.
Please be advised that the information presented on TradingView is provided to Tradu (‘Company’, ‘we’) by a third-party provider (‘TFA Global Pte Ltd’). Please be reminded that you are solely responsible for the trading decisions on your account. There is a very high degree of risk involved in trading. Any information and/or content is intended entirely for research, educational and informational purposes only and does not constitute investment or consultation advice or investment strategy. The information is not tailored to the investment needs of any specific person and therefore does not involve a consideration of any of the investment objectives, financial situation or needs of any viewer that may receive it. Kindly also note that past performance is not a reliable indicator of future results. Actual results may differ materially from those anticipated in forward-looking or past performance statements. We assume no liability as to the accuracy or completeness of any of the information and/or content provided herein and the Company cannot be held responsible for any omission, mistake nor for any loss or damage including without limitation to any loss of profit which may arise from reliance on any information supplied by TFA Global Pte Ltd.
The speaker(s) is neither an employee, agent nor representative of Tradu and is therefore acting independently. The opinions given are their own, constitute general market commentary, and do not constitute the opinion or advice of Tradu or any form of personal or investment advice. Tradu neither endorses nor guarantees offerings of third-party speakers, nor is Tradu responsible for the content, veracity or opinions of third-party speakers, presenters or participants.

SOLUSD Based on the H4 chart analysis, we could see the price rising towards the sell entry which lines up with the 38.2% Fibonacci retracement and could reverse from this level to the take profit.
Sell entry is at 216.43, which is an overlap resistance that lines up with the 38.2% Fibonacci retracement.
Stop loss is at 230.50, which is a pullback resistance that lines up with the 61.8% Fibonacci retracement.
Take profit is at 194.30, which is a pullback support.
High Risk Investment Warning
Trading Forex/CFDs on margin carries a high level of risk and may not be suitable for all investors. Leverage can work against you.
Stratos Markets Limited (tradu.com ):
CFDs are complex instruments and come with a high risk of losing money rapidly due to leverage. 65% of retail investor accounts lose money when trading CFDs with this provider. You should consider whether you understand how CFDs work and whether you can afford to take the high risk of losing your money.
Stratos Europe Ltd (tradu.com ):
CFDs are complex instruments and come with a high risk of losing money rapidly due to leverage. 66% of retail investor accounts lose money when trading CFDs with this provider. You should consider whether you understand how CFDs work and whether you can afford to take the high risk of losing your money.
Stratos Global LLC (tradu.com ):
Losses can exceed deposits.
Please be advised that the information presented on TradingView is provided to Tradu (‘Company’, ‘we’) by a third-party provider (‘TFA Global Pte Ltd’). Please be reminded that you are solely responsible for the trading decisions on your account. There is a very high degree of risk involved in trading. Any information and/or content is intended entirely for research, educational and informational purposes only and does not constitute investment or consultation advice or investment strategy. The information is not tailored to the investment needs of any specific person and therefore does not involve a consideration of any of the investment objectives, financial situation or needs of any viewer that may receive it. Kindly also note that past performance is not a reliable indicator of future results. Actual results may differ materially from those anticipated in forward-looking or past performance statements. We assume no liability as to the accuracy or completeness of any of the information and/or content provided herein and the Company cannot be held responsible for any omission, mistake nor for any loss or damage including without limitation to any loss of profit which may arise from reliance on any information supplied by TFA Global Pte Ltd.
The speaker(s) is neither an employee, agent nor representative of Tradu and is therefore acting independently. The opinions given are their own, constitute general market commentary, and do not constitute the opinion or advice of Tradu or any form of personal or investment advice. Tradu neither endorses nor guarantees offerings of third-party speakers, nor is Tradu responsible for the content, veracity or opinions of third-party speakers, presenters or participants.

DOGEUSD H4 | Bearish drop offBased on the H4 chart analysis, we can see that the price has rejected off the sell entry which is an overlap resistance that aligns with the 61.8% Fibonacci retracement and could drop from this level to our take profit.
Sell entry is at 0.23848, which is an overlap resistance that aligns with the 61.8% Fibonacci retracement.
Stop loss is at 0.25869, which is a pullback resistance that is slightly below the 61.8% Fibonacci retracement.
Take profit is at 0.2184, which is a pullback support.
High Risk Investment Warning
Trading Forex/CFDs on margin carries a high level of risk and may not be suitable for all investors. Leverage can work against you.
Stratos Markets Limited (tradu.com ):
CFDs are complex instruments and come with a high risk of losing money rapidly due to leverage. 65% of retail investor accounts lose money when trading CFDs with this provider. You should consider whether you understand how CFDs work and whether you can afford to take the high risk of losing your money.
Stratos Europe Ltd (tradu.com ):
CFDs are complex instruments and come with a high risk of losing money rapidly due to leverage. 66% of retail investor accounts lose money when trading CFDs with this provider. You should consider whether you understand how CFDs work and whether you can afford to take the high risk of losing your money.
Stratos Global LLC (tradu.com ):
Losses can exceed deposits.
Please be advised that the information presented on TradingView is provided to Tradu (‘Company’, ‘we’) by a third-party provider (‘TFA Global Pte Ltd’). Please be reminded that you are solely responsible for the trading decisions on your account. There is a very high degree of risk involved in trading. Any information and/or content is intended entirely for research, educational and informational purposes only and does not constitute investment or consultation advice or investment strategy. The information is not tailored to the investment needs of any specific person and therefore does not involve a consideration of any of the investment objectives, financial situation or needs of any viewer that may receive it. Kindly also note that past performance is not a reliable indicator of future results. Actual results may differ materially from those anticipated in forward-looking or past performance statements. We assume no liability as to the accuracy or completeness of any of the information and/or content provided herein and the Company cannot be held responsible for any omission, mistake nor for any loss or damage including without limitation to any loss of profit which may arise from reliance on any information supplied by TFA Global Pte Ltd.
The speaker(s) is neither an employee, agent nor representative of Tradu and is therefore acting independently. The opinions given are their own, constitute general market commentary, and do not constitute the opinion or advice of Tradu or any form of personal or investment advice. Tradu neither endorses nor guarantees offerings of third-party speakers, nor is Tradu responsible for the content, veracity or opinions of third-party speakers, presenters or participants.

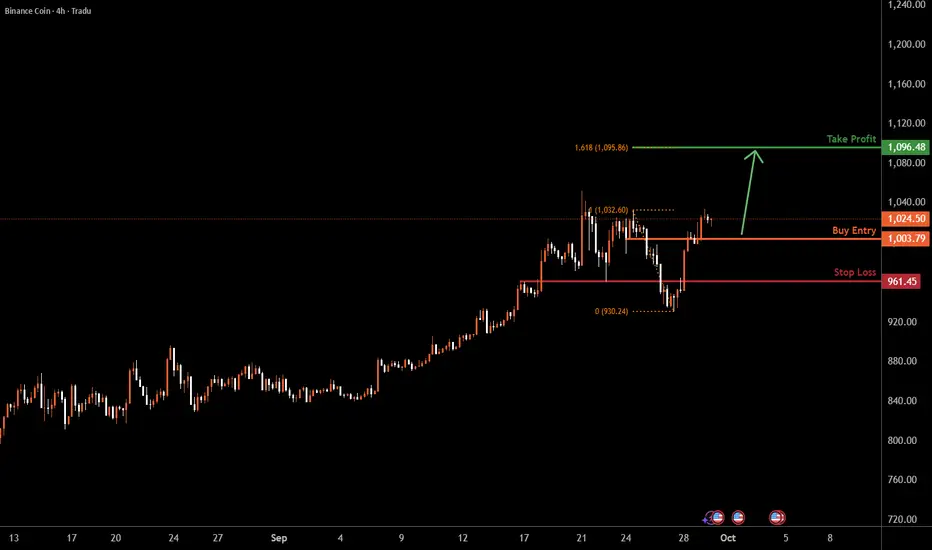
BNBUSD H4 | Bullish bounceBNB/USD is falling towards the buy entry which is a pullback uport and could bounce from this level to the upside.
Buy entry is at 1,003.79, which is a pullback support.
Stop loss is at 961.45, which is a pullback support.
Take profit is at 1,096.48, which aligns with the 161.8% Fibonacci extension.
High Risk Investment Warning
Trading Forex/CFDs on margin carries a high level of risk and may not be suitable for all investors. Leverage can work against you.
Stratos Markets Limited (tradu.com ):
CFDs are complex instruments and come with a high risk of losing money rapidly due to leverage. 65% of retail investor accounts lose money when trading CFDs with this provider. You should consider whether you understand how CFDs work and whether you can afford to take the high risk of losing your money.
Stratos Europe Ltd (tradu.com ):
CFDs are complex instruments and come with a high risk of losing money rapidly due to leverage. 66% of retail investor accounts lose money when trading CFDs with this provider. You should consider whether you understand how CFDs work and whether you can afford to take the high risk of losing your money.
Stratos Global LLC (tradu.com ):
Losses can exceed deposits.
Please be advised that the information presented on TradingView is provided to Tradu (‘Company’, ‘we’) by a third-party provider (‘TFA Global Pte Ltd’). Please be reminded that you are solely responsible for the trading decisions on your account. There is a very high degree of risk involved in trading. Any information and/or content is intended entirely for research, educational and informational purposes only and does not constitute investment or consultation advice or investment strategy. The information is not tailored to the investment needs of any specific person and therefore does not involve a consideration of any of the investment objectives, financial situation or needs of any viewer that may receive it. Kindly also note that past performance is not a reliable indicator of future results. Actual results may differ materially from those anticipated in forward-looking or past performance statements. We assume no liability as to the accuracy or completeness of any of the information and/or content provided herein and the Company cannot be held responsible for any omission, mistake nor for any loss or damage including without limitation to any loss of profit which may arise from reliance on any information supplied by TFA Global Pte Ltd.
The speaker(s) is neither an employee, agent nor representative of Tradu and is therefore acting independently. The opinions given are their own, constitute general market commentary, and do not constitute the opinion or advice of Tradu or any form of personal or investment advice. Tradu neither endorses nor guarantees offerings of third-party speakers, nor is Tradu responsible for the content, veracity or opinions of third-party speakers, presenters or participants.
BCHUSD H4 | Bearish drop offBCH/USD is reacting off the sell entry which is a pullback resitance that ailgns with the 23.6% Fibonacci retracement and oculd drop from this level to tour take profit.
Sell entry is at 559, whic is a pullback resistance that aligsn with the 23.6% Fibonacci retracement.
Stop loss is at 576.77, which is a pullback resitance that lines up with the 38.2% Fibonacci retracement.
Take profit is at 526.72, which is a pullback support.
High Risk Investment Warning
Trading Forex/CFDs on margin carries a high level of risk and may not be suitable for all investors. Leverage can work against you.
Stratos Markets Limited (tradu.com ):
CFDs are complex instruments and come with a high risk of losing money rapidly due to leverage. 65% of retail investor accounts lose money when trading CFDs with this provider. You should consider whether you understand how CFDs work and whether you can afford to take the high risk of losing your money.
Stratos Europe Ltd (tradu.com ):
CFDs are complex instruments and come with a high risk of losing money rapidly due to leverage. 66% of retail investor accounts lose money when trading CFDs with this provider. You should consider whether you understand how CFDs work and whether you can afford to take the high risk of losing your money.
Stratos Global LLC (tradu.com ):
Losses can exceed deposits.
Please be advised that the information presented on TradingView is provided to Tradu (‘Company’, ‘we’) by a third-party provider (‘TFA Global Pte Ltd’). Please be reminded that you are solely responsible for the trading decisions on your account. There is a very high degree of risk involved in trading. Any information and/or content is intended entirely for research, educational and informational purposes only and does not constitute investment or consultation advice or investment strategy. The information is not tailored to the investment needs of any specific person and therefore does not involve a consideration of any of the investment objectives, financial situation or needs of any viewer that may receive it. Kindly also note that past performance is not a reliable indicator of future results. Actual results may differ materially from those anticipated in forward-looking or past performance statements. We assume no liability as to the accuracy or completeness of any of the information and/or content provided herein and the Company cannot be held responsible for any omission, mistake nor for any loss or damage including without limitation to any loss of profit which may arise from reliance on any information supplied by TFA Global Pte Ltd.
The speaker(s) is neither an employee, agent nor representative of Tradu and is therefore acting independently. The opinions given are their own, constitute general market commentary, and do not constitute the opinion or advice of Tradu or any form of personal or investment advice. Tradu neither endorses nor guarantees offerings of third-party speakers, nor is Tradu responsible for the content, veracity or opinions of third-party speakers, presenters or participants.

Potential bearish drop?WTI Oil (XTI/USD) is rising towards the pivot and could reverse to the 1st support.
Pivot: 64.72
1st Support: 62.67
1st Resistance: 66.82
Disclaimer:
The above opinions given constitute general market commentary, and do not constitute the opinion or advice of IC Markets or any form of personal or investment advice.
Any opinions, news, research, analyses, prices, other information, or links to third-party sites contained on this website are provided on an "as-is" basis, are intended only to be informative, is not an advice nor a recommendation, nor research, or a record of our trading prices, or an offer of, or solicitation for a transaction in any financial instrument and thus should not be treated as such. The information provided does not involve any specific investment objectives, financial situation and needs of any specific person who may receive it. Please be aware, that past performance is not a reliable indicator of future performance and/or results. Past Performance or Forward-looking scenarios based upon the reasonable beliefs of the third-party provider are not a guarantee of future performance. Actual results may differ materially from those anticipated in forward-looking or past performance statements. IC Markets makes no representation or warranty and assumes no liability as to the accuracy or completeness of the information provided, nor any loss arising from any investment based on a recommendation, forecast or any information supplied by any third-party.

Gold Futures (MGCZ5) – H4 Gap in PlayPrice pushed aggressively bullish all day yesterday with little to no pullbacks. That momentum left behind a fresh H4 Fair Value Gap (FVG) sitting just above the Weekly High (WH) level.
If we see a pullback into this area, it could offer a solid setup for continuation higher.
⚠️ Key considerations:
If buyers stay strong, price may run liquidity above 3863.7 (D-H) before any meaningful retracement.
If sentiment shifts, a deeper draw into the Daily FVG below 3764 remains on the table.
With global uncertainty (military meetings, de-dollarization, possible U.S. shutdown), volatility risk is elevated.
🎯 Game Plan:
Watch the H4 FVG near WH for rejection / entry signals.
Bias remains bullish while above 3785 (D-L).
Break below D-L opens the door toward the Daily FVG.

NZDUSD to continue in the downward move?NZDUSD - 24h expiry
There is no clear indication that the downward move is coming to an end.
Although we remain bearish overall, a correction is possible without impacting the trend lower.
Risk/Reward would be poor to call a sell from current levels.
A move through 0.5770 will confirm the bearish momentum.
The measured move target is 0.5725.
We look to Sell at 0.5800 (stop at 0.5825)
Our profit targets will be 0.5750 and 0.5725
Resistance: 0.5800 / 0.5825 / 0.5850
Support: 0.5760 / 0.5750 / 0.5725
Risk Disclaimer
The trade ideas beyond this page are for informational purposes only and do not constitute investment advice or a solicitation to trade. This information is provided by Signal Centre, a third-party unaffiliated with OANDA, and is intended for general circulation only. OANDA does not guarantee the accuracy of this information and assumes no responsibilities for the information provided by the third party. The information does not take into account the specific investment objectives, financial situation, or particular needs of any particular person. You should take into account your specific investment objectives, financial situation, and particular needs before making a commitment to trade, including seeking, under a separate engagement, as you deem fit.
You accept that you assume all risks in independently viewing the contents and selecting a chosen strategy.
Where the research is distributed in Singapore to a person who is not an Accredited Investor, Expert Investor or an Institutional Investor, Oanda Asia Pacific Pte Ltd (“OAP“) accepts legal responsibility for the contents of the report to such persons only to the extent required by law. Singapore customers should contact OAP at 6579 8289 for matters arising from, or in connection with, the information/research distributed.

#028: USD/CHF SHORT Investment Opportunity
The USD/CHF exchange rate is once again in a crucial technical and psychological zone: the 0.8000 level remains a key barrier defended by institutional investors. Hello, I'm Andrea Russo, an independent Forex trader and prop trader with $200,000 in capital under management. Thank you in advance for your time.
🔎 Technical and Intermarket Analysis
The price has repeatedly reacted below this level, showing an inability to consolidate above 0.8010–0.8020.
The 8-hour structure remains in a medium-term bearish channel.
Indicators confirm bearish divergences, with the Swiss franc gradually strengthening against the dollar.
📊 Flows and Positioning
Retail remains heavily long (over 70%), a signal opposite to the banks' direction.
Open interest on CME highlights an increase in bearish positions, while FX options show a concentration of strikes in the 0.8000 area, with a negative range favoring short positions.
📉 Expected scenario
With these elements, the primary scenario remains bearish:
The psychological and institutional resistance at 0.8000 represents the level from which strong hands defend their positions.
The main risk is represented by spikes above 0.8015, which serve to absorb retail liquidity before a new downward momentum.

xauusdWell, we will have to wait and see what it does at the last traded high.
In any case, if the rate of 3600 holds, it will most likely reach the specified targets.

EURUSD 4H Channel Down targets 1.1600.The EURUSD pair is trading within a Channel Down on the 4H time-frame. As long as the 4H MA50 (blue trend-line) acts as Resistance, we expect the pattern to initiate its 3rd Bearish Leg, as at the same time, we have hit the 0.5 Fibonacci retracement level, which is where the previous Bearish Leg topped (Lower High).
If it repeats the recent Lower Low decline, we should see a 1.382 Fibonacci extension test. That more than covers our 1.16000 Target, which is where we believe contact can be made with the long-term Support of the 1D MA100 (red trend-line).
-------------------------------------------------------------------------------
** Please LIKE 👍, FOLLOW ✅, SHARE 🙌 and COMMENT ✍ if you enjoy this idea! Also share your ideas and charts in the comments section below! This is best way to keep it relevant, support us, keep the content here free and allow the idea to reach as many people as possible. **
-------------------------------------------------------------------------------
💸💸💸💸💸💸
👇 👇 👇 👇 👇 👇

USD/CHF - Trade Setup🔥 USD/CHF 1H Breakdown – Let’s Go! 🔥
Alright fam, here’s what’s cooking on the Swissy 👇
🕐 1H Structure
Price tapped that 4H demand zone around the 71% fib pocket and started bouncing. We’ve been bleeding inside a 1H liquidity trend channel (classic corrective pullback vibes), but now bulls are showing teeth.
📍 Key Levels
Entry : 0.7931 (right off that sweet spot discount)
Stop : 0.7907 (beneath the liquidity pocket / invalidation)
Target : 0.8026 (back into 4H supply – clean liquidity grab zone)
Risk/Reward sitting around 3.9R – tasty 🍽
🧠 Technical Breakdown
Liquidity sweep: Bears tried to drive price lower, but buyers defended the 71% retrace zone.
Trendline break: Watch for price to bust out of that 1H descending liquidity channel = rocket fuel 🚀.
Zones in play: 8H demand gave the bounce, 4H supply is the target. Classic AMD cycle loading.
🎯 Play Idea
Looking for a long as price flips structure. If bulls keep momentum, we ride it into that higher timeframe supply pocket. If stop gets clipped, we let it go and wait for deeper liquidity (no chasing).
✅ Summary
Bulls stepping back in. Long setup looks valid with nearly 4R on the table. Key is the break & hold above that liquidity channel.

NAS100 - Stock Market Awaits Employment Data!The index is above the EMA200 and EMA50 on the four-hour time frame and is in its long-term ascending channel. If the upward momentum decreases, we can expect a correction to the demand range and buy Nasdaq in that range with an appropriate reward for the risk.
According to reports released over the weekend, UBS stated that there is a 93% probability of the U.S. economy entering a recession this year. This figure implicitly suggests that the country may already be in recession, though some analysts remain skeptical of such a direct conclusion. UBS’s projection is based on indicators such as personal income, consumption, industrial production, and employment.
The bank warned that the U.S. economy has reached “historically troubling levels,” though no outright collapse has yet occurred. Analysts at UBS described the economy as “weak, soft, and fragile,” while noting that a definitive declaration of recession has not been made.
In the United States, an official declaration of recession is the responsibility of the Business Cycle Dating Committee at the National Bureau of Economic Research (NBER), which typically makes such calls with a lag of 6 to 18 months after the recession has started. Their assessment relies on revised data covering GDP, employment, income, sales, and production, and they generally avoid premature decisions.
In the meantime, policymakers and markets tend to act on real-time indicators such as GDP estimates, jobs data, yield curve signals, and credit spreads. In practice, traders react more strongly to price movements than to formal definitions of recession.
Separately, Michael Feroli, chief U.S. economist at J.P. Morgan, dismissed Fed board member Steven Miran’s call for cutting rates to 2.5% or lower. The bank has maintained its forecast for gradual 25-basis-point cuts, targeting a range of 3.25% to 3.5% by early next year.
A potential Supreme Court case involving Fed board member Lisa Cook has also emerged as a “wild card,” since a ruling against her could undermine the positions of other members as well. J.P. Morgan has warned that politicization of the Federal Reserve would leave the institution more vulnerable to pressure from a Trump administration on monetary policy.
The U.S. dollar remained relatively strong this week, as investors continued to parse the Fed’s less-dovish stance. While the latest dot plot showed policymakers aligned with the market on two additional rate cuts this year, the median dot for 2026 pointed to only one more 25-basis-point reduction. By contrast, markets still expect as many as three cuts next year.
However, following Chair Jerome Powell’s cautious tone on Tuesday—emphasizing that the Fed must continue balancing the competing risks of elevated inflation and a weakening labor market—investors scaled back some of their bets.
Inflation risks remain significant. The OECD highlighted this week that the full effects of tariff hikes are still unfolding. What supports Powell’s cautious approach is that, despite signs of labor market weakness, the Fed’s own forecasts remain relatively optimistic, with economic activity showing resilience. The Atlanta Fed’s GDPNow model projects 3.3% growth for Q3.
Although last week’s inflation data failed to dampen market optimism for rate cuts—and equities continued their rally—the focus in the coming week will shift back to labor market conditions.
The week begins Monday with pending home sales data. On Tuesday, the JOLTS job openings report and the consumer confidence index will be released. Wednesday brings private-sector employment data from ADP, followed by the ISM Manufacturing PMI. On Thursday, weekly jobless claims will be published as usual.
All of these releases will build up to Friday’s critical nonfarm payrolls (NFP) report, widely seen as the market’s ultimate test.Investors will closely monitor whether recent labor market weakness persists, and whether the Fed can move another step toward a rate cut at the October meeting. Finally, the ISM Services Index will provide a more comprehensive picture of U.S. economic health.
Ahead of the jobs data, traders may also take note of remarks from several Fed officials, including Vice Chair Jefferson, New York Fed President Williams, Atlanta Fed President Bostic, Chicago Fed President Goolsbee, and Dallas Fed President Logan. The ADP and NFP releases on Wednesday will likely provide the first snapshot of September labor market performance.

#029: EUR/USD Long Investment Opportunity
The pair recently broke the 1.1700 support zone, showing strong rejection and signs of a possible bullish reversal. Volume confirms accumulation near the lows, while retail traders remain largely positioned on the short side. Hello, I'm Forex Trader Andrea Russo, an independent trader and prop trader with $200,000 in capital under management. Thank you in advance for your time.
From an institutional perspective, this creates favorable conditions for a potential continuation of the upside.
Momentum indicators are turning positive, and the next few sessions could be crucial for a breakout attempt.
Key Focus:
Support zone around 1.1690-1.1700
Resistance area near 1.1810
Retail sentiment is still strongly short-term → possible upward pressure from institutional investors
⏳ The trend remains bullish in the short term, with expectations of a progressive upward move in the next 24-32 hours.

USDCAD H4 | Bullish momentum to extendUSD/CAD is falling towards the buy entry which is a pullback support that is slightly above the 38.2% Fibonacci retracement and could bounce from this levle to the upside.
Buy entry is at 1.3876, which is a pullback support that is slightly above the 38.2% Fibonacci retracement.
Stop loss is at 1.3830, which is a pullback support that is slightly below the 50% Fibonacci retracement.
Take profit is at 1.3948, which is a swing high resistance.
High Risk Investment Warning
Trading Forex/CFDs on margin carries a high level of risk and may not be suitable for all investors. Leverage can work against you.
Stratos Markets Limited (tradu.com ):
CFDs are complex instruments and come with a high risk of losing money rapidly due to leverage. 65% of retail investor accounts lose money when trading CFDs with this provider. You should consider whether you understand how CFDs work and whether you can afford to take the high risk of losing your money.
Stratos Europe Ltd (tradu.com ):
CFDs are complex instruments and come with a high risk of losing money rapidly due to leverage. 66% of retail investor accounts lose money when trading CFDs with this provider. You should consider whether you understand how CFDs work and whether you can afford to take the high risk of losing your money.
Stratos Global LLC (tradu.com ):
Losses can exceed deposits.
Please be advised that the information presented on TradingView is provided to Tradu (‘Company’, ‘we’) by a third-party provider (‘TFA Global Pte Ltd’). Please be reminded that you are solely responsible for the trading decisions on your account. There is a very high degree of risk involved in trading. Any information and/or content is intended entirely for research, educational and informational purposes only and does not constitute investment or consultation advice or investment strategy. The information is not tailored to the investment needs of any specific person and therefore does not involve a consideration of any of the investment objectives, financial situation or needs of any viewer that may receive it. Kindly also note that past performance is not a reliable indicator of future results. Actual results may differ materially from those anticipated in forward-looking or past performance statements. We assume no liability as to the accuracy or completeness of any of the information and/or content provided herein and the Company cannot be held responsible for any omission, mistake nor for any loss or damage including without limitation to any loss of profit which may arise from reliance on any information supplied by TFA Global Pte Ltd.
The speaker(s) is neither an employee, agent nor representative of Tradu and is therefore acting independently. The opinions given are their own, constitute general market commentary, and do not constitute the opinion or advice of Tradu or any form of personal or investment advice. Tradu neither endorses nor guarantees offerings of third-party speakers, nor is Tradu responsible for the content, veracity or opinions of third-party speakers, presenters or participants.

NZDUSD H4| Price faces major resistance aheadThe Kiwi (NZD/USD) is rising towards the sell entry which is a pullback resistance and could reverse from this levle to the take profit.
Sell entry is at 0.5835, which is a pullback resistance.
Stop loss is at 0.5884, which is a pullback resistance that aligns with the 50% Fibonacci retracement.
Take profit is at 0.5761, which is a pullback support.
High Risk Investment Warning
Trading Forex/CFDs on margin carries a high level of risk and may not be suitable for all investors. Leverage can work against you.
Stratos Markets Limited (tradu.com ):
CFDs are complex instruments and come with a high risk of losing money rapidly due to leverage. 65% of retail investor accounts lose money when trading CFDs with this provider. You should consider whether you understand how CFDs work and whether you can afford to take the high risk of losing your money.
Stratos Europe Ltd (tradu.com ):
CFDs are complex instruments and come with a high risk of losing money rapidly due to leverage. 66% of retail investor accounts lose money when trading CFDs with this provider. You should consider whether you understand how CFDs work and whether you can afford to take the high risk of losing your money.
Stratos Global LLC (tradu.com ):
Losses can exceed deposits.
Please be advised that the information presented on TradingView is provided to Tradu (‘Company’, ‘we’) by a third-party provider (‘TFA Global Pte Ltd’). Please be reminded that you are solely responsible for the trading decisions on your account. There is a very high degree of risk involved in trading. Any information and/or content is intended entirely for research, educational and informational purposes only and does not constitute investment or consultation advice or investment strategy. The information is not tailored to the investment needs of any specific person and therefore does not involve a consideration of any of the investment objectives, financial situation or needs of any viewer that may receive it. Kindly also note that past performance is not a reliable indicator of future results. Actual results may differ materially from those anticipated in forward-looking or past performance statements. We assume no liability as to the accuracy or completeness of any of the information and/or content provided herein and the Company cannot be held responsible for any omission, mistake nor for any loss or damage including without limitation to any loss of profit which may arise from reliance on any information supplied by TFA Global Pte Ltd.
The speaker(s) is neither an employee, agent nor representative of Tradu and is therefore acting independently. The opinions given are their own, constitute general market commentary, and do not constitute the opinion or advice of Tradu or any form of personal or investment advice. Tradu neither endorses nor guarantees offerings of third-party speakers, nor is Tradu responsible for the content, veracity or opinions of third-party speakers, presenters or participants.

AUDUSD H4 | Approaching key resistanceThe Aussie (AUD/USD) is rising towards the sell entry which is an overlap resistance that is slightly below the 38.2% Fibonacci retracement and could reverse from this level to the downside.
Sell entry is at 0.6582, which is an overlap resistance that is slightly below the 38.2% Fibonacci retracement.
Stop loss is at 0.6634, which is a pullback resistance that aligns with the 61.8% Fibonacci retracement.
Take profit is at 0.6510, which is a pullback support.
High Risk Investment Warning
Trading Forex/CFDs on margin carries a high level of risk and may not be suitable for all investors. Leverage can work against you.
Stratos Markets Limited (tradu.com ):
CFDs are complex instruments and come with a high risk of losing money rapidly due to leverage. 65% of retail investor accounts lose money when trading CFDs with this provider. You should consider whether you understand how CFDs work and whether you can afford to take the high risk of losing your money.
Stratos Europe Ltd (tradu.com ):
CFDs are complex instruments and come with a high risk of losing money rapidly due to leverage. 66% of retail investor accounts lose money when trading CFDs with this provider. You should consider whether you understand how CFDs work and whether you can afford to take the high risk of losing your money.
Stratos Global LLC (tradu.com ):
Losses can exceed deposits.
Please be advised that the information presented on TradingView is provided to Tradu (‘Company’, ‘we’) by a third-party provider (‘TFA Global Pte Ltd’). Please be reminded that you are solely responsible for the trading decisions on your account. There is a very high degree of risk involved in trading. Any information and/or content is intended entirely for research, educational and informational purposes only and does not constitute investment or consultation advice or investment strategy. The information is not tailored to the investment needs of any specific person and therefore does not involve a consideration of any of the investment objectives, financial situation or needs of any viewer that may receive it. Kindly also note that past performance is not a reliable indicator of future results. Actual results may differ materially from those anticipated in forward-looking or past performance statements. We assume no liability as to the accuracy or completeness of any of the information and/or content provided herein and the Company cannot be held responsible for any omission, mistake nor for any loss or damage including without limitation to any loss of profit which may arise from reliance on any information supplied by TFA Global Pte Ltd.
The speaker(s) is neither an employee, agent nor representative of Tradu and is therefore acting independently. The opinions given are their own, constitute general market commentary, and do not constitute the opinion or advice of Tradu or any form of personal or investment advice. Tradu neither endorses nor guarantees offerings of third-party speakers, nor is Tradu responsible for the content, veracity or opinions of third-party speakers, presenters or participants.

USDJPY H4 | Bullish bounce aheadUSD/JPY is falling towards the buy entry which is a pullback support that lines up with the 50% Fibonacci retracement and could bounce from this level to the upside.
Buy entry is at 147.86, which is a pullback support that lines up with the 50% Fibonacci retracement.
Stop loss is at 146.99, which is a pullback support that is slightly below the 61.8% Fibonacci retracement.
Take profit is at 149.81, which is a swing high resistance.
High Risk Investment Warning
Trading Forex/CFDs on margin carries a high level of risk and may not be suitable for all investors. Leverage can work against you.
Stratos Markets Limited (tradu.com ):
CFDs are complex instruments and come with a high risk of losing money rapidly due to leverage. 65% of retail investor accounts lose money when trading CFDs with this provider. You should consider whether you understand how CFDs work and whether you can afford to take the high risk of losing your money.
Stratos Europe Ltd (tradu.com ):
CFDs are complex instruments and come with a high risk of losing money rapidly due to leverage. 66% of retail investor accounts lose money when trading CFDs with this provider. You should consider whether you understand how CFDs work and whether you can afford to take the high risk of losing your money.
Stratos Global LLC (tradu.com ):
Losses can exceed deposits.
Please be advised that the information presented on TradingView is provided to Tradu (‘Company’, ‘we’) by a third-party provider (‘TFA Global Pte Ltd’). Please be reminded that you are solely responsible for the trading decisions on your account. There is a very high degree of risk involved in trading. Any information and/or content is intended entirely for research, educational and informational purposes only and does not constitute investment or consultation advice or investment strategy. The information is not tailored to the investment needs of any specific person and therefore does not involve a consideration of any of the investment objectives, financial situation or needs of any viewer that may receive it. Kindly also note that past performance is not a reliable indicator of future results. Actual results may differ materially from those anticipated in forward-looking or past performance statements. We assume no liability as to the accuracy or completeness of any of the information and/or content provided herein and the Company cannot be held responsible for any omission, mistake nor for any loss or damage including without limitation to any loss of profit which may arise from reliance on any information supplied by TFA Global Pte Ltd.
The speaker(s) is neither an employee, agent nor representative of Tradu and is therefore acting independently. The opinions given are their own, constitute general market commentary, and do not constitute the opinion or advice of Tradu or any form of personal or investment advice. Tradu neither endorses nor guarantees offerings of third-party speakers, nor is Tradu responsible for the content, veracity or opinions of third-party speakers, presenters or participants.

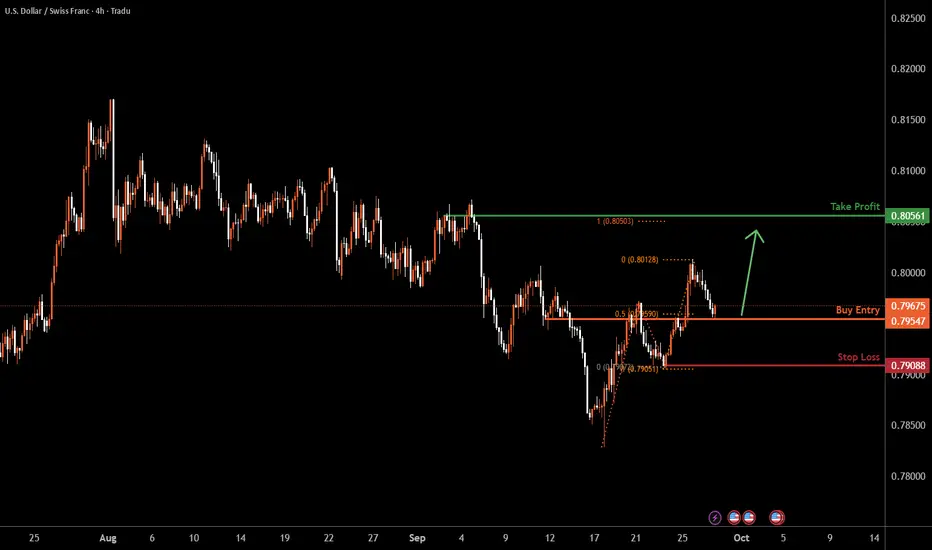
USDCHF H4 | Bullish reaction at 50% Fibonacci retracement levelUSD/CHF is reacting off the buy entry which acts as a pullback support that aligns with the 50% Fibonacci retracement and could bounce from this level to the upside.
Buy entry is at 0.7968, which is a pullback support that lines up with the 50% Fibonacci retracement.
Stop loss is at 0.79088, which is a pullback support.
Take profit is at 0.8056, which is a swing high resistance that lines up with the 100% Fibonacci projection.
High Risk Investment Warning
Trading Forex/CFDs on margin carries a high level of risk and may not be suitable for all investors. Leverage can work against you.
Stratos Markets Limited (tradu.com ):
CFDs are complex instruments and come with a high risk of losing money rapidly due to leverage. 65% of retail investor accounts lose money when trading CFDs with this provider. You should consider whether you understand how CFDs work and whether you can afford to take the high risk of losing your money.
Stratos Europe Ltd (tradu.com ):
CFDs are complex instruments and come with a high risk of losing money rapidly due to leverage. 66% of retail investor accounts lose money when trading CFDs with this provider. You should consider whether you understand how CFDs work and whether you can afford to take the high risk of losing your money.
Stratos Global LLC (tradu.com ):
Losses can exceed deposits.
Please be advised that the information presented on TradingView is provided to Tradu (‘Company’, ‘we’) by a third-party provider (‘TFA Global Pte Ltd’). Please be reminded that you are solely responsible for the trading decisions on your account. There is a very high degree of risk involved in trading. Any information and/or content is intended entirely for research, educational and informational purposes only and does not constitute investment or consultation advice or investment strategy. The information is not tailored to the investment needs of any specific person and therefore does not involve a consideration of any of the investment objectives, financial situation or needs of any viewer that may receive it. Kindly also note that past performance is not a reliable indicator of future results. Actual results may differ materially from those anticipated in forward-looking or past performance statements. We assume no liability as to the accuracy or completeness of any of the information and/or content provided herein and the Company cannot be held responsible for any omission, mistake nor for any loss or damage including without limitation to any loss of profit which may arise from reliance on any information supplied by TFA Global Pte Ltd.
The speaker(s) is neither an employee, agent nor representative of Tradu and is therefore acting independently. The opinions given are their own, constitute general market commentary, and do not constitute the opinion or advice of Tradu or any form of personal or investment advice. Tradu neither endorses nor guarantees offerings of third-party speakers, nor is Tradu responsible for the content, veracity or opinions of third-party speakers, presenters or participants.
GBPUSD H4 | Bearish reversal setupGBP/USD is rising towards the sell entry which is a pullback resistance that aligns with the 61.8% Fibonacci retracement and could reverse from this level to our take profit.
Sell entry is at 1.3460, which is a pullback resistance that lines up with the 61.8% Fibonacci retracement.
Stop loss is at 1.3533, which is an overlap resistance that aligns with the 50% Fibonacci retracement.
Take profit is at 1.3339, which is a multi swing low support.
High Risk Investment Warning
Trading Forex/CFDs on margin carries a high level of risk and may not be suitable for all investors. Leverage can work against you.
Stratos Markets Limited (tradu.com ):
CFDs are complex instruments and come with a high risk of losing money rapidly due to leverage. 65% of retail investor accounts lose money when trading CFDs with this provider. You should consider whether you understand how CFDs work and whether you can afford to take the high risk of losing your money.
Stratos Europe Ltd (tradu.com ):
CFDs are complex instruments and come with a high risk of losing money rapidly due to leverage. 66% of retail investor accounts lose money when trading CFDs with this provider. You should consider whether you understand how CFDs work and whether you can afford to take the high risk of losing your money.
Stratos Global LLC (tradu.com ):
Losses can exceed deposits.
Please be advised that the information presented on TradingView is provided to Tradu (‘Company’, ‘we’) by a third-party provider (‘TFA Global Pte Ltd’). Please be reminded that you are solely responsible for the trading decisions on your account. There is a very high degree of risk involved in trading. Any information and/or content is intended entirely for research, educational and informational purposes only and does not constitute investment or consultation advice or investment strategy. The information is not tailored to the investment needs of any specific person and therefore does not involve a consideration of any of the investment objectives, financial situation or needs of any viewer that may receive it. Kindly also note that past performance is not a reliable indicator of future results. Actual results may differ materially from those anticipated in forward-looking or past performance statements. We assume no liability as to the accuracy or completeness of any of the information and/or content provided herein and the Company cannot be held responsible for any omission, mistake nor for any loss or damage including without limitation to any loss of profit which may arise from reliance on any information supplied by TFA Global Pte Ltd.
The speaker(s) is neither an employee, agent nor representative of Tradu and is therefore acting independently. The opinions given are their own, constitute general market commentary, and do not constitute the opinion or advice of Tradu or any form of personal or investment advice. Tradu neither endorses nor guarantees offerings of third-party speakers, nor is Tradu responsible for the content, veracity or opinions of third-party speakers, presenters or participants.
