EURUSD Monday 27 to Friday 31 October 2025.Macro map for 27 to 31 Oct 2025
Concentration of policy and inflation prints means policy expectations and real yields will drive the United States dollar, global equities, bitcoin, and gold. The hinge events are Wednesday FOMC, Thursday US GDP advance and German data, Friday US Core PCE and Chicago PMI. Secondary drivers are BoJ policy guidance and ECB tone, plus BoC.
Watch list
Real ten year yield and the DXY dollar index after FOMC and PCE
EUR front end versus USD front end after ECB and FOMC
VIX around the FOMC window and into PCE
US liquidity windows around 14:00 Eastern on Wednesday and 08:30 Eastern on Thursday and Friday
EURUSD outlook for next week
Set up
EURUSD faces a rare three way cross current. The Federal Reserve delivers statement and press conference on Wednesday. The European Central Bank speaks on Thursday alongside German GDP and CPI. US growth and inflation updates arrive Thursday and Friday. The pair will key off two spreads. First, the real rate spread between United States and euro area. Second, the expected policy path into the December and January meetings.
Baseline view
The dollar leg is most sensitive to any hint that policy patience is the base case while inflation continues to glide toward target. If the statement and press conference lean patient and Core PCE cools on Friday, front end yields should soften and the dollar should slip. The euro leg depends on whether the ECB signals concern about growth. A balanced message with no rush to cut supports the euro. A growth heavy and overtly dovish tone weighs on it.
Scenarios and probabilities
Upside continuation toward the big round figure above. Probability forty. Triggers are a patient FOMC, softer US Core PCE, and ECB rhetoric that avoids a clear dovish pivot. German CPI in line or firmer would add confirmation.
Downside reaction into prior weekly support. Probability thirty five. Triggers are a firmer Core PCE, hawkish FOMC color on the balance of risks, or ECB emphasis on weak activity with openness to earlier easing.
Range behavior inside last week’s value with false breaks around event time. Probability twenty five. Triggers are mixed signals or offsetting messages across the two central banks.
Key levels and timing
Round numbers around one point zero eight, one point zero nine, and one point one zero matter. Prior week high and low define acceptance. Expect the largest one hour ranges near 14:00 Eastern on Wednesday and 08:30 Eastern on Friday. Cross asset confirms are a drop in real yields for the bullish case and a jump in the DXY for the bearish case.
Risk notes
BoJ guidance can move United States yields through global duration. A surprise from BoC can spill into USD crosses before the FOMC window. Liquidity is thin in the first minutes after statements. Fade the first spike only with a clearly defined risk budget and a close beyond level.
J-USD

USDCAD | Bearish Reversal Forming at Overlap ResistanceBased on the M30, we can see that the price is reacting off the sell entry whic is an overlap resistance and could drop from this level to the downside.
Sell entry is at 1.4004, which is an overlap resistance.
Stop loss is at 1.4019, which is a pullback resistance that aligns with the 61.8% Fibonacci retracement.
Take profit is at 1.3978, which is a multi swing low support.
Stratos Markets Limited (tradu.com ):
CFDs are complex instruments and come with a high risk of losing money rapidly due to leverage. 68% of retail investor accounts lose money when trading CFDs with this provider. You should consider whether you understand how CFDs work and whether you can afford to take the high risk of losing your money.
Stratos Europe Ltd (tradu.com ):
CFDs are complex instruments and come with a high risk of losing money rapidly due to leverage. 70% of retail investor accounts lose money when trading CFDs with this provider. You should consider whether you understand how CFDs work and whether you can afford to take the high risk of losing your money.

GOLD | Pullback Resistance AheadBased on the H4 chart analysis, we could see the price rise to the sell entry, which is a pullback resistance that aligns with the 161.8% Fibonacci extension and the 50% Fibonacci retracement, and could reverse from this level to the downside.
Stop loss is at 4,370.70, which is a multi-swing high resistance.
Take profit is at 3,946.74, which is a pullback support that is slightly above the 61.8% Fibonacci retracement.
Stratos Markets Limited (tradu.com ):
CFDs are complex instruments and come with a high risk of losing money rapidly due to leverage. 68% of retail investor accounts lose money when trading CFDs with this provider. You should consider whether you understand how CFDs work and whether you can afford to take the high risk of losing your money.
Stratos Europe Ltd (tradu.com ):
CFDs are complex instruments and come with a high risk of losing money rapidly due to leverage. 70% of retail investor accounts lose money when trading CFDs with this provider. You should consider whether you understand how CFDs work and whether you can afford to take the high risk of losing your money.

DOTUSD | Bearish Rejection at Overlap ResistanceDOT/USD is rising towards the sell entry, which is an overlap resistance and could reverse from this level to the downside.
Sell entry is at 3.065, which is an overlap resistance.
Stop loss is at 3.277, which is a swing high resistance that aligns with the 161.8% Fibonacci extension.
Take profit is at 2.806, which is an overlap support.
Stratos Markets Limited (tradu.com ):
CFDs are complex instruments and come with a high risk of losing money rapidly due to leverage. 68% of retail investor accounts lose money when trading CFDs with this provider. You should consider whether you understand how CFDs work and whether you can afford to take the high risk of losing your money.
Stratos Europe Ltd (tradu.com ):
CFDs are complex instruments and come with a high risk of losing money rapidly due to leverage. 70% of retail investor accounts lose money when trading CFDs with this provider. You should consider whether you understand how CFDs work and whether you can afford to take the high risk of losing your money.

SOLUSD | Approaching Major Resistance LevelSOL/USD is rising towards the sell entry, which is an overlap resistance and could reverse from this level to the downside.
Sell entry is at 198.22, which is an overlap resistance.
Stop loss is at 206.24, which is a swing high resistance that aligns with the 138.2% Fibonacci extension.
Take profit is at 187.02, which is an overlap support.
Stratos Markets Limited (tradu.com ):
CFDs are complex instruments and come with a high risk of losing money rapidly due to leverage. 68% of retail investor accounts lose money when trading CFDs with this provider. You should consider whether you understand how CFDs work and whether you can afford to take the high risk of losing your money.
Stratos Europe Ltd (thttps://tradu.com/eu ):
CFDs are complex instruments and come with a high risk of losing money rapidly due to leverage. 70% of retail investor accounts lose money when trading CFDs with this provider. You should consider whether you understand how CFDs work and whether you can afford to take the high risk of losing your money.

DOGEUSD | Bullish Bounce Off SupportThe price has bounced off the buy entry, which is a pullback support, and oculd rise from this level to he take profit.
Buy entry is at 0.19401, which is a pullback support.
Stop loss is at 0.18966, which is a pullback support.
Take profit is at 0.20603, which is an overlap resistance.
Stratos Markets Limited (tradu.com ):
CFDs are complex instruments and come with a high risk of losing money rapidly due to leverage. 68% of retail investor accounts lose money when trading CFDs with this provider. You should consider whether you understand how CFDs work and whether you can afford to take the high risk of losing your money.
Stratos Europe Ltd (tradu.com ):
CFDs are complex instruments and come with a high risk of losing money rapidly due to leverage. 70% of retail investor accounts lose money when trading CFDs with this provider. You should consider whether you understand how CFDs work and whether you can afford to take the high risk of losing your money.

EOS/USD | Bullish Momentum Building After BounceEOS/USD has bounced off the buy entry and could rise from this level to the upside.
Buy entry is at 0.2748, which is a pullback support.
Stop loss is at 0.2703, which is a pullbakc support.
Take profit is at 0.2908, which is an overlap resistance that is slightly below thhe 61.8% Fibonacci retracement.
Stratos Markets Limited (tradu.com ):
CFDs are complex instruments and come with a high risk of losing money rapidly due to leverage. 68% of retail investor accounts lose money when trading CFDs with this provider. You should consider whether you understand how CFDs work and whether you can afford to take the high risk of losing your money.
Stratos Europe Ltd (tradu.com ):
CFDs are complex instruments and come with a high risk of losing money rapidly due to leverage. 70% of retail investor accounts lose money when trading CFDs with this provider. You should consider whether you understand how CFDs work and whether you can afford to take the high risk of losing your money.

Bullish bounce off 50% Fibonacci support?The Gold (XAU/USD) is falling towards the pivot, which aligns with the 50% Fibonacci retracement and could bounce from this level to the swing high resistance.
Pivot: 3,847.44
1st Support: 3,701.62
1st Resistance: 4,357.81
Disclaimer:
The above opinions given constitute general market commentary, and do not constitute the opinion or advice of IC Markets or any form of personal or investment advice.
Any opinions, news, research, analyses, prices, other information, or links to third-party sites contained on this website are provided on an "as-is" basis, are intended only to be informative, is not an advice nor a recommendation, nor research, or a record of our trading prices, or an offer of, or solicitation for a transaction in any financial instrument and thus should not be treated as such. The information provided does not involve any specific investment objectives, financial situation and needs of any specific person who may receive it. Please be aware, that past performance is not a reliable indicator of future performance and/or results. Past Performance or Forward-looking scenarios based upon the reasonable beliefs of the third-party provider are not a guarantee of future performance. Actual results may differ materially from those anticipated in forward-looking or past performance statements. IC Markets makes no representation or warranty and assumes no liability as to the accuracy or completeness of the information provided, nor any loss arising from any investment based on a recommendation, forecast or any information supplied by any third-party.

Falling towards multi swing low support?The Cable (GBP/USD) is falling towards the pivot, which is a multi swing low support and oculd bounce to the 1st resistance.
Pivot: 1.3177
1st Support: 1.3009
1st Resistance: 1.3483
Disclaimer:
The above opinions given constitute general market commentary, and do not constitute the opinion or advice of IC Markets or any form of personal or investment advice.
Any opinions, news, research, analyses, prices, other information, or links to third-party sites contained on this website are provided on an "as-is" basis, are intended only to be informative, is not an advice nor a recommendation, nor research, or a record of our trading prices, or an offer of, or solicitation for a transaction in any financial instrument and thus should not be treated as such. The information provided does not involve any specific investment objectives, financial situation and needs of any specific person who may receive it. Please be aware, that past performance is not a reliable indicator of future performance and/or results. Past Performance or Forward-looking scenarios based upon the reasonable beliefs of the third-party provider are not a guarantee of future performance. Actual results may differ materially from those anticipated in forward-looking or past performance statements. IC Markets makes no representation or warranty and assumes no liability as to the accuracy or completeness of the information provided, nor any loss arising from any investment based on a recommendation, forecast or any information supplied by any third-party.

Potential bearish continuation?The Swissie (USD/CHF) is rising towards the pivot, which has been identified as an overlap resistance, and could drop to the 1st support, which is a swing low support.
Pivot: 0.8081
1st Support: 0.7833
1st Resistance: 0.8211
Disclaimer:
The above opinions given constitute general market commentary, and do not constitute the opinion or advice of IC Markets or any form of personal or investment advice.
Any opinions, news, research, analyses, prices, other information, or links to third-party sites contained on this website are provided on an "as-is" basis, are intended only to be informative, is not an advice nor a recommendation, nor research, or a record of our trading prices, or an offer of, or solicitation for a transaction in any financial instrument and thus should not be treated as such. The information provided does not involve any specific investment objectives, financial situation and needs of any specific person who may receive it. Please be aware, that past performance is not a reliable indicator of future performance and/or results. Past Performance or Forward-looking scenarios based upon the reasonable beliefs of the third-party provider are not a guarantee of future performance. Actual results may differ materially from those anticipated in forward-looking or past performance statements. IC Markets makes no representation or warranty and assumes no liability as to the accuracy or completeness of the information provided, nor any loss arising from any investment based on a recommendation, forecast or any information supplied by any third-party.

Bullish momentum expected?The Loonie (USD/CAD) is falling towards the pivot, which is a pullback support and could bounce to the 61.8% Fibonacci resistance.
Pivot: 1.3913
1st Support: 1.3753
1st Resistance: 1.4152
Disclaimer:
The above opinions given constitute general market commentary, and do not constitute the opinion or advice of IC Markets or any form of personal or investment advice.
Any opinions, news, research, analyses, prices, other information, or links to third-party sites contained on this website are provided on an "as-is" basis, are intended only to be informative, is not an advice nor a recommendation, nor research, or a record of our trading prices, or an offer of, or solicitation for a transaction in any financial instrument and thus should not be treated as such. The information provided does not involve any specific investment objectives, financial situation and needs of any specific person who may receive it. Please be aware, that past performance is not a reliable indicator of future performance and/or results. Past Performance or Forward-looking scenarios based upon the reasonable beliefs of the third-party provider are not a guarantee of future performance. Actual results may differ materially from those anticipated in forward-looking or past performance statements. IC Markets makes no representation or warranty and assumes no liability as to the accuracy or completeness of the information provided, nor any loss arising from any investment based on a recommendation, forecast or any information supplied by any third-party.

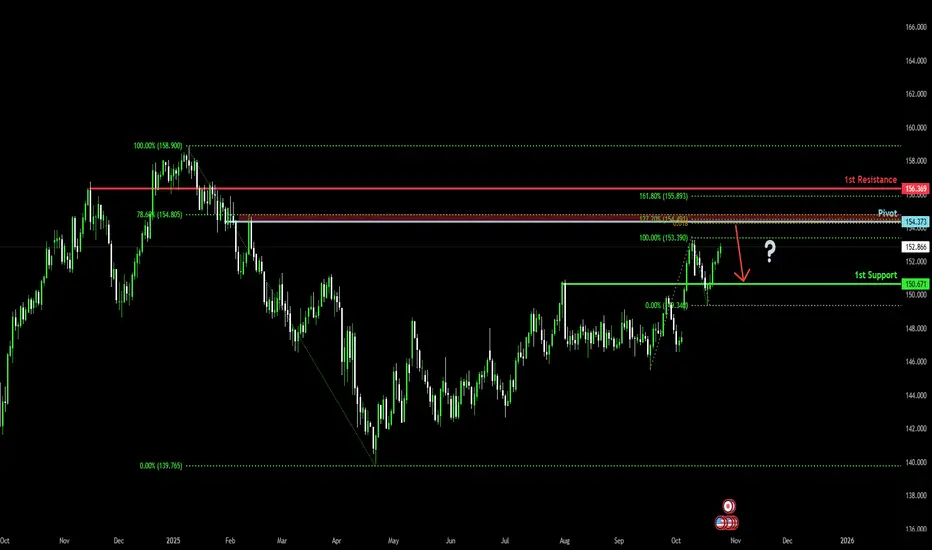
Heading into Fibonacci confluence?USD/JPY is rising towards the pivot, which is a pullback resistance and could reverse to the 1st suport, which acts as an overlap suport.
Pivot: 154.37
1st Support: 150.67
1st Resistance: 156.36
Disclaimer:
The above opinions given constitute general market commentary, and do not constitute the opinion or advice of IC Markets or any form of personal or investment advice.
Any opinions, news, research, analyses, prices, other information, or links to third-party sites contained on this website are provided on an "as-is" basis, are intended only to be informative, is not an advice nor a recommendation, nor research, or a record of our trading prices, or an offer of, or solicitation for a transaction in any financial instrument and thus should not be treated as such. The information provided does not involve any specific investment objectives, financial situation and needs of any specific person who may receive it. Please be aware, that past performance is not a reliable indicator of future performance and/or results. Past Performance or Forward-looking scenarios based upon the reasonable beliefs of the third-party provider are not a guarantee of future performance. Actual results may differ materially from those anticipated in forward-looking or past performance statements. IC Markets makes no representation or warranty and assumes no liability as to the accuracy or completeness of the information provided, nor any loss arising from any investment based on a recommendation, forecast or any information supplied by any third-party.
Bearish momentum to extend?The Kiwi (NZD/USD) is rising towards the pivot and could reverrse to the pullback support.
Pivot: 0.5831
1st support: 0.5675
1st Resistance: 0.5889
Disclaimer:
The above opinions given constitute general market commentary, and do not constitute the opinion or advice of IC Markets or any form of personal or investment advice.
Any opinions, news, research, analyses, prices, other information, or links to third-party sites contained on this website are provided on an "as-is" basis, are intended only to be informative, is not an advice nor a recommendation, nor research, or a record of our trading prices, or an offer of, or solicitation for a transaction in any financial instrument and thus should not be treated as such. The information provided does not involve any specific investment objectives, financial situation and needs of any specific person who may receive it. Please be aware, that past performance is not a reliable indicator of future performance and/or results. Past Performance or Forward-looking scenarios based upon the reasonable beliefs of the third-party provider are not a guarantee of future performance. Actual results may differ materially from those anticipated in forward-looking or past performance statements. IC Markets makes no representation or warranty and assumes no liability as to the accuracy or completeness of the information provided, nor any loss arising from any investment based on a recommendation, forecast or any information supplied by any third-party.

Bearish reversal off major resistance?The Aussie (AUD/USD) is rising towards the pivot, which has been identified as an overlap resistance that aligns with the 38.2% Fibonacci retracement and oculd reverse to the 1st support, which acts as a multi swing low support.
Pivot: 0.6545
1st Support: 0.6422
1st Resistance: 0.6628
Disclaimer:
The above opinions given constitute general market commentary, and do not constitute the opinion or advice of IC Markets or any form of personal or investment advice.
Any opinions, news, research, analyses, prices, other information, or links to third-party sites contained on this website are provided on an "as-is" basis, are intended only to be informative, is not an advice nor a recommendation, nor research, or a record of our trading prices, or an offer of, or solicitation for a transaction in any financial instrument and thus should not be treated as such. The information provided does not involve any specific investment objectives, financial situation and needs of any specific person who may receive it. Please be aware, that past performance is not a reliable indicator of future performance and/or results. Past Performance or Forward-looking scenarios based upon the reasonable beliefs of the third-party provider are not a guarantee of future performance. Actual results may differ materially from those anticipated in forward-looking or past performance statements. IC Markets makes no representation or warranty and assumes no liability as to the accuracy or completeness of the information provided, nor any loss arising from any investment based on a recommendation, forecast or any information supplied by any third-party.

Bullish bounce off?The Fiber (EUR/USD) has bounced off the pivot, which is an overlap support and could potentially rise to the 1st resistance.
Pivot: 1.1626
1st Support: 1.1512
1st Resistance: 1.1690
Disclaimer:
The above opinions given constitute general market commentary, and do not constitute the opinion or advice of IC Markets or any form of personal or investment advice.
Any opinions, news, research, analyses, prices, other information, or links to third-party sites contained on this website are provided on an "as-is" basis, are intended only to be informative, is not an advice nor a recommendation, nor research, or a record of our trading prices, or an offer of, or solicitation for a transaction in any financial instrument and thus should not be treated as such. The information provided does not involve any specific investment objectives, financial situation and needs of any specific person who may receive it. Please be aware, that past performance is not a reliable indicator of future performance and/or results. Past Performance or Forward-looking scenarios based upon the reasonable beliefs of the third-party provider are not a guarantee of future performance. Actual results may differ materially from those anticipated in forward-looking or past performance statements. IC Markets makes no representation or warranty and assumes no liability as to the accuracy or completeness of the information provided, nor any loss arising from any investment based on a recommendation, forecast or any information supplied by any third-party.

Forex: Weekly Review. Fundamental analysis The week starting Monday 20 October was a good week for overall market positivity. Political stability in Japan, optimism for US / CHINA trade de-escalation and below expectations inflation data from the UK and US, all contributed to the positive mood as the S&P once again hit all time highs.
It was very pleasing to see the JPY in particular acting in accordance to its (inverse) risk environment correlation. I felt the JPY was a potential short option all week, plus 'hopefully into next week', at least until the FOMC meeting.
On the catalyst front, below expectations UK inflation considerably weakened the GBP, a BOE rate cut may be on the cards sooner than the market previously predicted.
It is pleasing that despite the US government shutdown, there are still opportunities, it's just a little slow going sometimes. I have read that November's US CPI data isn't due to be reported, which doesn't bode well for an end to the shutdown anytime soon. We can only hope that won't be the case.
The fact US CPI was (eventually) reported below expectations, is good news and bodes well for a continuation of 'risk on trades'. But I expect we'll continue to get US / CHINA back and forth, plus Mr Trump is taking aim at Canada again. earnings season kicks into gear this coming week and we have the FOMC, a rate cut is heavily predicted. It'll be the narrative regarding the timing of further cuts that the market will be focused on.
All in all, I continue to hold my 'tentative risk on bias' likely preferring JPY short but not ruling out USD or possibly even CHF if one or the other is considerably the weakest at the time.
Finally, I still consider 'AUD NZD long' to be a viable 'interest rate differential trade.
On a personal note, it was another AUD JPY week. Two 'risk on' trades (see chart above). One on Monday, attempting to take advantage of JPY weakness following election news combining with dovish commentary from UEDA.
I unfortunately missed the GBP short inflation catalyst opportunity. And had to wait until Thursday for my second AUD JPY long trade. Although, post trade I realised I had neglected to note upcoming JPY inflation data, I therefore closed the trade early, to avoid holding risk during the release.
If US CPI data has been reported on any other day than Friday, I suspect I would have been very tempted to place another 'risk on' trade but I was ultimately put off by the possibility of 'strange Friday price action'.
Let's see what the new week brings.

Potential bullish bounce?AUD/USD has bounced off the support level, which serves as a pullback support and could rise from this level to our take-profit target.
Entry: 0.6500
Why we like it:
There is a pullback support level.
Stop loss: 0.6481
Why we like it:
There is a pullback support level.
Take profit: 0.6542
Why we like it:
There is a pullback resistance level.
Enjoying your TradingView experience? Review us!
Please be advised that the information presented on TradingView is provided to Vantage (‘Vantage Global Limited’, ‘we’) by a third-party provider (‘Everest Fortune Group’). Please be reminded that you are solely responsible for the trading decisions on your account. There is a very high degree of risk involved in trading. Any information and/or content is intended entirely for research, educational and informational purposes only and does not constitute investment or consultation advice or investment strategy. The information is not tailored to the investment needs of any specific person and therefore does not involve a consideration of any of the investment objectives, financial situation or needs of any viewer that may receive it. Kindly also note that past performance is not a reliable indicator of future results. Actual results may differ materially from those anticipated in forward-looking or past performance statements. We assume no liability as to the accuracy or completeness of any of the information and/or content provided herein and the Company cannot be held responsible for any omission, mistake nor for any loss or damage including without limitation to any loss of profit which may arise from reliance on any information supplied by Everest Fortune Group.

Bearish drop off for the Loonie?The price has reacted off the resistance level, which is a pullback resistance and could potentially drop from this level to our take profit.
Entry: 1.4003
Why we like it:
There is a pullback resistance level.
Stop loss: 1.4027
Why we like it:
There is a swing high resistance level.
Take profit: 1.3969
Why we like it:
There is a pullback support level.1
Enjoying your TradingView experience? Review us!
Please be advised that the information presented on TradingView is provided to Vantage (‘Vantage Global Limited’, ‘we’) by a third-party provider (‘Everest Fortune Group’). Please be reminded that you are solely responsible for the trading decisions on your account. There is a very high degree of risk involved in trading. Any information and/or content is intended entirely for research, educational and informational purposes only and does not constitute investment or consultation advice or investment strategy. The information is not tailored to the investment needs of any specific person and therefore does not involve a consideration of any of the investment objectives, financial situation or needs of any viewer that may receive it. Kindly also note that past performance is not a reliable indicator of future results. Actual results may differ materially from those anticipated in forward-looking or past performance statements. We assume no liability as to the accuracy or completeness of any of the information and/or content provided herein and the Company cannot be held responsible for any omission, mistake nor for any loss or damage including without limitation to any loss of profit which may arise from reliance on any information supplied by Everest Fortune Group.

Bearish continuation setup?GBP/USD is rising towards the resistance level which is a pullback resistance that aligns with the 61.8% Fibonacci retracement and could reverse from this level to our take profit.
Entry: 1.3332
Why we like it:
There is a pullback resistance that aligns with the 61.8% Fibonacci retracement.
Stop loss: 1.3372
Why we like it:
There is a pullback resistance that lines up with the 50% Fibonacci retracement.
Take profit: 1.3260
Why we like it:
There is a pullback support level.
Enjoying your TradingView experience? Review us!
Please be advised that the information presented on TradingView is provided to Vantage (‘Vantage Global Limited’, ‘we’) by a third-party provider (‘Everest Fortune Group’). Please be reminded that you are solely responsible for the trading decisions on your account. There is a very high degree of risk involved in trading. Any information and/or content is intended entirely for research, educational and informational purposes only and does not constitute investment or consultation advice or investment strategy. The information is not tailored to the investment needs of any specific person and therefore does not involve a consideration of any of the investment objectives, financial situation or needs of any viewer that may receive it. Kindly also note that past performance is not a reliable indicator of future results. Actual results may differ materially from those anticipated in forward-looking or past performance statements. We assume no liability as to the accuracy or completeness of any of the information and/or content provided herein and the Company cannot be held responsible for any omission, mistake nor for any loss or damage including without limitation to any loss of profit which may arise from reliance on any information supplied by Everest Fortune Group.

Bearish reversal off 50% Fibonacci resistance?EUR/USD could rise towards the resistance level, which is a pullback resistance that aligns with the 50% Fibonacci retracement and could reverse from this level to our take profit.
Entry: 1.1650
Why we like it:
There is. pullback resistance that aligns with the 50% Fibonacci retracement.
Stop loss: 1.1675
Why we like it:
There is a pullback resistance that is slightly above the 61.8% Fibonacci retracement.
Take profit: 1.1619
Why we like it:
There is a pullback support level that aligns with the 38.2% Fibonacci retracement.
Enjoying your TradingView experience? Review us!
Please be advised that the information presented on TradingView is provided to Vantage (‘Vantage Global Limited’, ‘we’) by a third-party provider (‘Everest Fortune Group’). Please be reminded that you are solely responsible for the trading decisions on your account. There is a very high degree of risk involved in trading. Any information and/or content is intended entirely for research, educational and informational purposes only and does not constitute investment or consultation advice or investment strategy. The information is not tailored to the investment needs of any specific person and therefore does not involve a consideration of any of the investment objectives, financial situation or needs of any viewer that may receive it. Kindly also note that past performance is not a reliable indicator of future results. Actual results may differ materially from those anticipated in forward-looking or past performance statements. We assume no liability as to the accuracy or completeness of any of the information and/or content provided herein and the Company cannot be held responsible for any omission, mistake nor for any loss or damage including without limitation to any loss of profit which may arise from reliance on any information supplied by Everest Fortune Group.

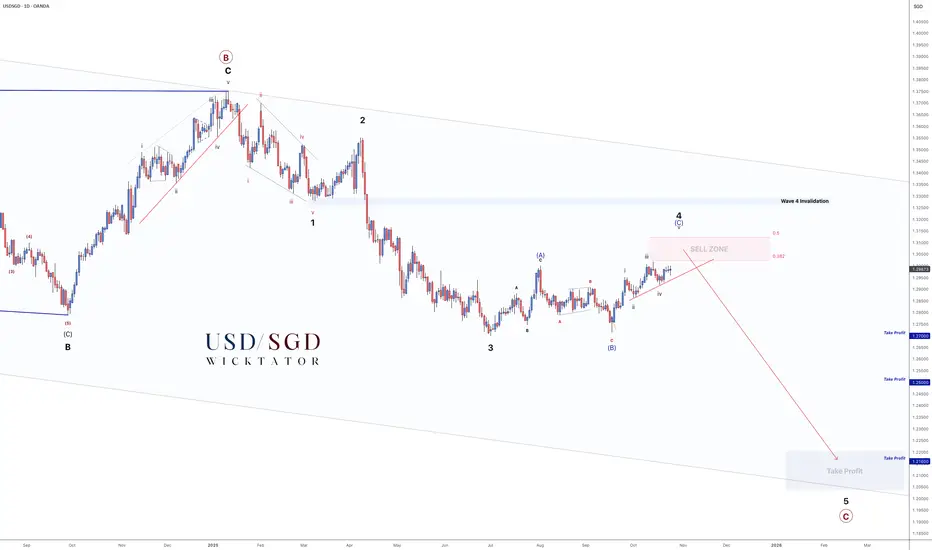
USDSGD - 1000pip Drop Almost Ready!1D Chart
In our previous breakdown, we highlighted the upcoming Wave 4 correction and the potential sell zone ahead — price has now followed that roadmap with precision and fast approaching our sell zone.
Wave 3 completed cleanly, and we’ve since seen a textbook ABC correction forming Wave 4.
Price is now approaching the Sell Zone (38.2–50% retracement), where we’ll be watching closely for confirmation to trigger shorts.
The structure remains intact — Wave 4 invalidation sits just above the 1.32 region. As long as we stay below that level, the bearish setup toward Wave 5 remains valid.
Trade Idea:
- Aggressive short: Rejection inside the Sell Zone
- Conservative short: Break of structure / trendline break confirmation
Targets:
TP1: 1.27 (400pips)
TP2: 1.25 (600pips)
TP3: 1.216 (1000pips)
Weekly Chart:
This is where patience pays off — we’ve tracked this correction from the start, and the final leg of Wave 5 is almost ready to begin.
Plan the trade. Wait for confirmation. Execute with precision.
Goodluck, and as always, Trade Safe!
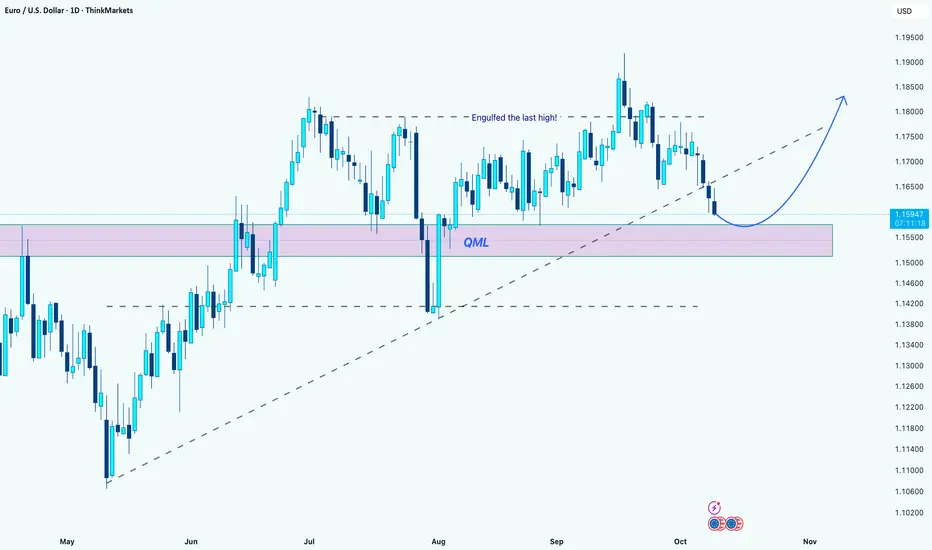
EUR/USD: Retesting QML Zone for a Potential Bullish ReversalHi Guys!
After breaking out from the previous range, EUR/USD has been respecting the ascending trendline quite well. Recently, the price pulled back toward the QML zone (marked in purple), which has acted as a strong demand area in the past.
We can see that price engulfed the last high before starting this correction phase, which indicates buyers are still dominant in the larger structure. Now the pair is retesting this demand area and the trendline simultaneously.
As long as the QML zone holds, I expect a reversal toward 1.175–1.185 in the coming days.
However, a clean break below 1.1550 would invalidate this setup and open the door for a deeper correction.
Bias: Bullish from demand zone
Key levels to watch:
Support: 1.1550 – 1.1580
Resistance: 1.1750 / 1.1850
Disclaimer: As part of ThinkMarkets’ Influencer Program, I am sponsored to share and publish their charts in my analysis.
Bitcoin Forms Head and Shoulders — Correction 107,500 in PlayHello traders! I’d like to share my view on the current market structure for Bitcoin. After a prolonged period of bullish momentum and multiple impulsive rallies, the market has entered a corrective phase. The price action has formed a clear Head and Shoulders pattern beneath the major resistance zone near 121,700, signaling growing selling pressure. Currently, BTC is trading within a short-term descending structure, staying below both the resistance line and the Seller Zone. The recent rejection from the right shoulder area confirms that sellers remain in control, and the market is now moving toward the Buyer Zone, located around 107,500.In my opinion, this movement represents a continuation of the ongoing correction rather than a full trend reversal. I expect the price to decline into the Buyer Zone, completing the right shoulder and reaching the TP1 target near 107,500. If the market finds strong support in this demand area and forms a confirmed reversal structure, it could mark the end of the corrective phase and initiate the next major bullish leg. A successful bounce from this level would open the way for a potential rally back toward the 114,000–115,000 resistance range.This setup provides a clear trading plan — I remain bearish in the short term, looking for a potential bullish reversal from the lower boundary of the structure. Please share this idea with your friends and click Boost 🚀
