Bitcoin Forms Head and Shoulders — Correction 107,500 in PlayHello traders! I’d like to share my view on the current market structure for Bitcoin. After a prolonged period of bullish momentum and multiple impulsive rallies, the market has entered a corrective phase. The price action has formed a clear Head and Shoulders pattern beneath the major resistance zone near 121,700, signaling growing selling pressure. Currently, BTC is trading within a short-term descending structure, staying below both the resistance line and the Seller Zone. The recent rejection from the right shoulder area confirms that sellers remain in control, and the market is now moving toward the Buyer Zone, located around 107,500.In my opinion, this movement represents a continuation of the ongoing correction rather than a full trend reversal. I expect the price to decline into the Buyer Zone, completing the right shoulder and reaching the TP1 target near 107,500. If the market finds strong support in this demand area and forms a confirmed reversal structure, it could mark the end of the corrective phase and initiate the next major bullish leg. A successful bounce from this level would open the way for a potential rally back toward the 114,000–115,000 resistance range.This setup provides a clear trading plan — I remain bearish in the short term, looking for a potential bullish reversal from the lower boundary of the structure. Please share this idea with your friends and click Boost 🚀
J-USD

EURUSD – Range Retest Could Trigger New Sell WaveHello traders, I want to share my view on EURUSD. The market recently formed a descending wedge pattern after breaking down from the previous range structure, which dominated price action for a long time. The breakout from this wedge occurred after the pair reached the major support zone around 1.1560, triggering a minor upward correction. At the moment, the price is testing the lower boundary of the previous range, which has now turned into a strong resistance zone around 1.1660. This level coincides with the confluence of a horizontal resistance and the descending trendline, creating a potential supply area. Despite the small bullish reaction from support, the overall market sentiment remains bearish. Buyers have not shown sufficient momentum to push price above the resistance, suggesting that this movement is likely a corrective pullback within a broader downtrend. In my view, the 1.1660 area will act as a ceiling, and the pair is likely to resume its decline toward the 1.1560 demand zone. A confirmed rejection from this resistance could open the path for a new bearish leg, potentially targeting even lower levels if sellers maintain control. Please share this idea with your friends and click Boost 🚀

MASTERCLASS: INTRADAY & SWING TRADE AUDUSD 🦘 AUDUSD (0.66112) - COMPREHENSIVE TECHNICAL MASTERCLASS: INTRADAY & SWING TRADE BLUEPRINT 🦘
October 27-31, 2025 | Advanced Multi-Timeframe Trading Forecast
🎯 MARKET OVERVIEW & ANALYSIS SCOPE 🎯
Current Spot Price: 0.66112 | Analysis Date: Oct 25, 2025 | Timeframes: 5M-1D Complete Spectrum | Trading Style: Intraday Scalp + Swing Trade | Conviction: Medium-High
━━━━━━━━━━━━━━━━━━━━━━━━━━━━━━━━━
📊 1. MULTI-TIMEFRAME TREND STRUCTURE & DOW THEORY VALIDATION 📊
🔍 Daily (1D) Timeframe - Primary Market Direction
The 1D chart exhibits mixed consolidation with bearish undertone . Dow Theory framework shows LOWER HIGHS pattern emerging (0.6640 → 0.6620 → 0.6615), signaling potential downtrend initiation. Elliott Wave structure suggests completion of 5-wave impulse (up) targeting reversal near 0.6580-0.6600 levels. RSI reading 48-52 (neutral zone, showing weakness as bearish bias forms). VWAP at 0.6605 acting as temporary support with breach implications downward.
⏰ 4H Timeframe - Swing Trade Risk Structure
Four-hourly demonstrates bearish flag formation with downside target potential . Price consolidating below 0.6625 resistance after failed breakout attempts. Bollinger Bands tightening (squeeze pattern)—volatility expansion imminent. RSI declining from 55 to 48 range (bearish momentum deterioration). Ichimoku Cloud configuration: price trapped between Kijun-sen (resistance) & Senkou Span B (dynamic support)—indecision zone. Downside target: 0.6580-0.6560.
🔥 1H to 5M Intraday Setup - Micro Timeframe Dynamics
One-hour shows head-and-shoulders pattern developing with neckline at 0.6610. Left shoulder complete (0.6625), head forming (0.6620), right shoulder declining (0.6618). Harmonic pattern: Bearish Bat identified at 0.6595 (D-point) suggesting short entry opportunity. 30M timeframe displays EMA50 crossing below EMA200 (bearish crossover just initiated). Volume declining on attempted rallies = selling pressure dominance. 5M shows bear trap formation near 0.6625—trapping bullish retailers before reversal.
━━━━━━━━━━━━━━━━━━━━━━━━━━━━━━━━━
🎯 2. ENTRY & EXIT PROTOCOL + WYCKOFF DISTRIBUTION PHASE 🎯
SWING TRADE SHORT ENTRIES (4H/1D): Sell breakdown below 0.6610 (H&S neckline) with stop @ 0.6635 (Risk:Reward 1:3 minimum). Wyckoff Distribution phase activated—institutional selling pressure accumulating. Target: 0.6560-0.6540 (swing trade 3-5 days hold).
INTRADAY SHORT SCALPS (5M/15M/30M): Multiple entry opportunities: (1) Head-and-shoulders neckline break = 0.6610 entry | (2) Bearish Bat PRZ completion = 0.6595-0.6590 aggressive short | (3) EMA crossover rejection on 30M = 0.6615-0.6620 pullback short entry.
PRIMARY PROFIT TARGETS: 1D: 0.6560 | 4H: 0.6575 | 1H: 0.6600 | 30M: 0.6610 (quick 15-20 pip scalp gains) | Extended: 0.6540 (major support level).
STOP LOSS PLACEMENT STRATEGY: Swing shorts: 0.6640 (above H&S left shoulder) | Intraday: 0.6625 (tight 15-20 pip stops) | Trail stops below Bollinger Band upper band as price descends.
💡 Pro Trading Tip: Use Ichimoku Kijun-sen (26-period) as dynamic resistance/stop level. Lock profits at each support zone identified via Gann angles.
━━━━━━━━━━━━━━━━━━━━━━━━━━━━━━━━━
⚡ 3. REVERSAL SIGNALS & JAPANESE CANDLESTICK PATTERN ANALYSIS ⚡
✅ BEARISH REVERSAL CONFIRMATIONS:
Engulfing pattern visible on 30M chart—red candle engulfing previous green (seller dominance confirmed). Shooting star candlestick near 0.6625 (failed rally rejection). Dark cloud cover pattern on 1H signals seller takeover at highs. Head-and-shoulders neckline (0.6610) acts as critical reversal zone. Ichimoku Chikou Span trading BELOW price action = confirmed bearish structure. Stochastic showing bearish divergence (lower highs on RSI/price higher highs).
⛔ BULLISH REVERSAL WARNINGS & BULL TRAP IDENTIFICATION:
Bull trap currently IN PROGRESS near 0.6625 resistance—retailers buying resistance, institutions distributing. If price breaks above 0.6630 with declining volume, false breakout confirmed. Morning Star pattern absent—no reversal higher probability. VWAP rejection combined with closing below 0.6610 = strong bearish confirmation. Gann resistance at 0.6640 acts as major distribution zone where selling accelerates.
⚠️ CRITICAL LEVEL: 0.6610 (H&S neckline) = REVERSAL THRESHOLD. Break below = Bearish Continuation | Hold above with volume = Bull trap intact
━━━━━━━━━━━━━━━━━━━━━━━━━━━━━━━━━
🔴 4. BREAKDOWN DYNAMICS & BEARISH PATTERN FORMATIONS 🔴
✅ PRIMARY BEARISH BREAKDOWN SCENARIO (65% PROBABILITY):
Head-and-shoulders breakdown below 0.6610 neckline on 1H timeframe with volume confirmation (need 20%+ volume spike below average). Elliott Wave target: 0.6540-0.6500 (5th wave decline in new downtrend cycle). Bollinger Band lower band at 0.6560 = natural extension target. Measured move from pattern: H&S height (0.6625-0.6610 = 15 pips) projected downward = 0.6595 target.
🔷 HARMONIC PATTERN PRECISION DOWNSIDE TARGETS:
Bearish Bat pattern (XA:BC 0.618) D-point entry: 0.6595 with target 0.6540 (161.8% extension downward). Bearish Butterfly on 4H suggesting potential extended move to 0.6480 (extreme scenario). Crab pattern confluence identifies 0.6570 as intermediate support-bounce zone.
⚠️ BULLISH PATTERN - FALLING WEDGE (BULL TRAP) (35% PROBABILITY):
If price holds above 0.6610, 4H chart displays falling wedge formation that could breakout bullishly to 0.6650+. Stochastic confluence on 1H indicates potential bounce setup. However, volume analysis suggests limited upside conviction. Bear trap possible if institutions accumulate after distribution climax. Watch for climactic volume spike—wedge collapse likely either direction.
━━━━━━━━━━━━━━━━━━━━━━━━━━━━━━━━━
📉 5. VOLATILITY METRICS & PRICE ACTION COMPRESSION 📉
🌊 Bollinger Bands - Critical Squeeze Signal:
Band width compressing to 180 pips on 1D (lowest in 12 days)—explosive volatility breakout imminent within 36-48 hours. Intraday Bollinger Bands (5M/15M/30M) showing initial expansion toward lower band—bearish volatility thesis strengthening. Price approaching lower Bollinger Band (0.6580) = oversold setup potential or trend continuation signal depending on volume.
📍 SUPPORT & RESISTANCE ARCHITECTURE:
MAJOR RESISTANCE ZONES: 0.6630 (Bull trap distribution level) | 0.6625 (Recent swing high) | 0.6640 (Gann angle resistance) | 0.6650 (Weekly pivot)
CRITICAL SUPPORT LEVELS: 0.6610 (H&S neckline/VWAP area) | 0.6595 (Harmonic D-point) | 0.6575 (4H support) | 0.6560 (Bollinger lower band) | 0.6540 (Major support)
VWAP PROFILE: Daily VWAP: 0.6605 (trending downward) | Weekly VWAP: 0.6615 (secondary resistance)
📊 Moving Average Divergence - Bearish Alignment:
EMA 50 below EMA 200 on 1H/4H (bearish structure forming). SMA 20 crossing below SMA 50 on 30M = momentum deterioration signal. 5M chart: EMA50 recently crossed below EMA200—intraday downtrend initiation confirmed. Price trading BELOW all major moving averages = weakness confirmed. Wyckoff Distribution phase in progress—institutional selling continuing.
🎯 OVERBOUGHT/OVERSOLD CONDITIONS & MOMENTUM EXHAUSTION:
RSI Status: 48-52 range (neutral sliding toward oversold)—RSI approaching 40 = potential for capitulation move lower. Stochastic on 15M: Declining from 55 toward 30 zone = bearish momentum acceleration. Ichimoku RSI below midline transitioning lower—downside potential significant. CCI on 5M declining below zero (strong bearish momentum without extreme oversold exhaustion). Fast Stochastic declining toward 20 level—room for extended downside run.
━━━━━━━━━━━━━━━━━━━━━━━━━━━━━━━━━
🎓 6. ADVANCED TECHNICAL THEORY INTEGRATION & FRAMEWORKS 🎓
⭐ ELLIOTT WAVE STRUCTURE: 5-wave impulse (up) completed near 0.6625 | Wave A (down) declining toward 0.6595-0.6540 | Correction target: 50% retracement = 0.6575 | Extended target: 161.8% extension = 0.6480 maximum (9-12 trading days)
⭐ GANN THEORY APPLICATION: 45-degree angle resistance @ 0.6640 (broken support becomes resistance) | Square of Nine support @ 0.6540 | Time-Price intersection: 6-8 trading days for major swing completion | Gann fan support @ 0.6560
⭐ WYCKOFF METHODOLOGY - DISTRIBUTION PHASE: Spring pattern failed (no spring reversal) = Distribution confirmation | Markup phase ended, Distribution phase INITIATED | Test & Decline pattern active = institutional distribution continuing | Expected breakdown: 0.6595-0.6540 over 5-7 trading days | Climax alert: Watch for volume spike + wide range candle = distribution completion
⭐ DOW THEORY BEARISH CONFIRMATION: Lower highs: 0.6640 → 0.6625 → 0.6620 | Lower lows: 0.6590 → 0.6585 | Volume declining on rallies = downtrend validation | Trend now firmly bearish-biased
━━━━━━━━━━━━━━━━━━━━━━━━━━━━━━━━━
✨ COMPLETE TRADING ACTION PLAN ✨
🔴 PRIMARY BEARISH SCENARIO (65% Probability):
Entry Zone: 0.6610 (H&S breakdown) or 0.6615-0.6620 (pullback short)
Stop Loss: 0.6640 | Target 1: 0.6595 | Target 2: 0.6575 | Target 3: 0.6560
Risk/Reward: 1:3+ | Hold Duration: Swing (3-5 days) + Intraday scalp (1-3 hours)
Conviction Level: 65% | Setup Quality: Premium Bearish | Volume: Confirming
🟢 SECONDARY BULLISH SCENARIO (35% Probability - Contingency):
Trigger: Hold above 0.6625 + Stochastic bounce + Volume expansion upward
Entry: 0.6630 long | Stop: 0.6610 | Target: 0.6650 (bounce setup only)
Probability: 35% (Lower conviction bull trap risk) | Pattern: Falling wedge breakout
⏱️ TIMEFRAME STRATEGY HIERARCHY: 1D (macro structure) + 4H (swing foundation) + 1H (entry confirmation) + 15M/5M (execution precision)
💰 POSITION SIZING & RISK RULES: Risk max 1-2% portfolio per trade | Scale shorts on 50% pullbacks toward 0.6625 | Trail stops above Bollinger upper band
🔔 PRICE ALERT SYSTEM: Sell signal @ 0.6610 (neckline break) | Stop loss alarm @ 0.6640 | Take profit 1 @ 0.6595 | Full target @ 0.6560 | Extended @ 0.6540
📱 EXECUTION BLUEPRINT: Aggressive breakdown entries (30% position) + Patient pullback shorts (70% position) = risk-balanced approach | Scale out profits at each support zone
⚠️ RISK MANAGEMENT: Bull trap alert at 0.6625-0.6630 | Volume confirmation mandatory on entry | Trail stops religiously | Close to breakeven if volume fails
━━━━━━━━━━━━━━━━━━━━━━━━━━━━━━━━━
⚖️ COMPLIANCE DISCLAIMER: This analysis provided for educational & information purposes ONLY. NOT financial/investment advice. All trading carries substantial risk of loss. Trade only with capital you can afford to lose. Always implement proper risk management. Consult qualified financial advisors before trading. Past performance ≠ future results. Markets unpredictable.

ULTIMATE TECHNICAL FORECAST: INTRADAY & SWING TRADE BLUEPRINT💷 GBPUSD (1.33103) - ULTIMATE TECHNICAL FORECAST: INTRADAY & SWING TRADE BLUEPRINT 💷
October 27-31, 2025 | Advanced Multi-Timeframe Deep Dive Analysis
🎯 EXECUTIVE MARKET OVERVIEW 🎯
Current Spot Price: 1.33103 | Analysis Date: Oct 25, 2025 | Scope: 5M-1D All Timeframes | Strategy Type: Intraday Scalp + Swing Trade
━━━━━━━━━━━━━━━━━━━━━━━━━━━━━━━━━
📊 1. COMPREHENSIVE TREND ANALYSIS & DOW THEORY FRAMEWORK 📊
🔍 Daily (1D) Timeframe - Primary Structural Trend
The daily chart exhibits strong bullish momentum with consolidation setup . Dow Theory validates higher highs and higher lows forming—confirmed uptrend structure intact. Elliott Wave analysis identifies completion of 5-wave impulse targeting 1.3450+ levels. RSI reading 52-58 (neutral-bullish momentum, no overbought exhaustion). VWAP at 1.3295 provides dynamic support during pullbacks.
⏰ 4H Timeframe - Swing Trade Foundation
Four-hourly shows bullish pennant formation near 1.3320-1.3350 resistance zone . Bollinger Bands tightening before directional breakout expected within 48 hours. RSI climbing 55-62 range (bullish acceleration without overbought signals). Ichimoku Cloud configuration: price above Kijun-sen & Chikou Span above price—textbook bullish alignment. Target extension: 1.3400-1.3450.
🔥 1H to 5M Intraday Structure - Micro Setup Confirmation
One-hour chart displays inverted cup-and-handle pattern completing near 1.3350. Perfect harmonic setup: Bullish Crab pattern identified at 1.3280 (D-point = swing entry opportunity). 30-minute timeframe shows clean EMA50 > EMA200 with price consolidating above both moving averages. Volume profile confirms institutional buying absorption between 1.3300-1.3320 range.
━━━━━━━━━━━━━━━━━━━━━━━━━━━━━━━━━
🎯 2. PRECISE ENTRY & EXIT ROADMAP + WYCKOFF METHODOLOGY 🎯
SWING TRADE ENTRIES (4H/1D): Buy breakout above 1.3350 with protective stop @ 1.3270 (Risk:Reward 1:3.5 minimum). Wyckoff Spring Pattern completed—institutional accumulation phase ending, markup phase commencing.
INTRADAY SCALP ENTRIES (5M/15M/30M): Multiple entry zones: (1) EMA crossover confirmation on 30M + RSI < 35 rejection = 1.3305-1.3315 entry | (2) Harmonic Crab PRZ completion = 1.3280-1.3290 aggressive entry | (3) VWAP bounce = 1.3295 support entry.
PRIMARY PROFIT TARGETS: 1D: 1.3450 | 4H: 1.3410 | 1H: 1.3375 | 15M: 1.3350 | Intraday scalp: 1.3330 (quick 25-30 pip gains).
STOP LOSS PLACEMENT PROTOCOL: Swing traders: 1.3260 (below double bottom structure) | Intraday: 1.3275 (tight 20-25 pip stops) | Scale stops with trailing risk management on breakouts.
💡 Elite Tip: Use Ichimoku Kijun-sen (26-period) as dynamic trailing stop—lock profits incrementally above 1.3350 breakout.
━━━━━━━━━━━━━━━━━━━━━━━━━━━━━━━━━
⚡ 3. REVERSAL IDENTIFICATION & CANDLESTICK PATTERN RECOGNITION ⚡
✅ BULLISH REVERSAL CONFIRMATIONS:
Piercing Line pattern on 30M chart signals buyer dominance at support. Inside Bar formations on 5M/15M indicate consolidation before directional breakout. Morning Star visible on 1H—textbook reversal signal. Inverted hammer near 1.3280 confirms seller rejection, bull continuation thesis. Ichimoku Chikou Span successfully broke above price action = confirmed reversal completion.
⛔ BEARISH REVERSAL WARNINGS & RESISTANCE REJECTION ZONES:
If price fails to sustain above 1.3350 with declining volume spike, Evening Star pattern potential on 4H. Gann resistance at 1.3390 acts as strong rejection zone. RSI divergence monitoring critical: if lower highs appear while price makes higher highs, exhaustion signal triggers short setup. VWAP rejection combined with upper Bollinger Band touching = sell signal activation.
⚠️ Critical Decision Level: 1.3345-1.3355 acts as BREAKOUT THRESHOLD. Clean close above = Bullish Continuation | Multiple rejections = Reversal to 1.3280
━━━━━━━━━━━━━━━━━━━━━━━━━━━━━━━━━
🚀 4. BREAKOUT DYNAMICS & ADVANCED PATTERN FORMATIONS 🚀
✅ PRIMARY BULLISH BREAKOUT SCENARIO (70% PROBABILITY):
Bullish pennant breakout above 1.3350 on 4H timeframe with volume confirmation (need 25%+ spike above 20-period MA). Elliott Wave target: 1.3450-1.3550 (5th wave extension in new markup cycle). Bollinger Band upper band at 1.3420 = natural extended target. Cup-and-handle completion projects 1.3400+ move within 5-7 trading days.
🔷 HARMONIC PATTERN PRECISION LEVELS:
Bullish Crab pattern (XA:BC 0.618) D-point entry: 1.3280 with target 1.3450+ (161.8% extension). Bat pattern on daily timeframe suggesting potential for extended 1.3550 level (extreme scenario). Butterfly pattern confluence identifies 1.3380 as intermediate resistance-turn zone.
⚠️ BEARISH PATTERN - RISING WEDGE TRAP (30% PROBABILITY):
If momentum fails at 1.3350, 4H chart displays rising wedge formation that could collapse bearishly to 1.3220. Stochastic divergence on 1H indicates potential pullback. Bollinger Band squeeze suggests breakout imminent within 36-48 hours in either direction. Monitor volume for declining participation—wedge failure precursor.
━━━━━━━━━━━━━━━━━━━━━━━━━━━━━━━━━
📈 5. VOLATILITY METRICS & PRICE ACTION DYNAMICS 📈
🌊 Bollinger Bands - Volatility Expansion Analysis:
Band width compressing dramatically on 1D (225 pips) - tightest in 14 days. This band contraction historically precedes major volatility breakout (Average True Range expansion expected). Intraday Bollinger Bands (5M/15M) showing normal expansion—price oscillating within middle band indicating equilibrium phase. Midband (SMA 20) at 1.3320 acts as equilibrium pivot.
📍 SUPPORT & RESISTANCE ARCHITECTURE:
CRITICAL SUPPORT LEVELS: 1.3320 (Weekly pivot) | 1.3300 (VWAP daily) | 1.3280 (Harmonic D-point) | 1.3260 (Double bottom structure)
MAJOR RESISTANCE ZONES: 1.3350 (Pennant apex breakout zone) | 1.3390 (Gann angle resistance) | 1.3420 (Bollinger upper band) | 1.3450 (Elliott wave target)
VWAP PROFILE: Daily VWAP: 1.3300 (holding strong support) | Weekly VWAP: 1.3285 (secondary support level)
📊 Moving Average Convergence & Trend Confirmation:
EMA 50 > EMA 200 across ALL timeframes (primary bullish signal alignment). SMA 20 above SMA 50 on 1H/4H = sustained buy pressure. 5M chart: Recent EMA50/EMA200 crossover just completed—intraday uptrend initiation signal. Price maintaining superior positioning above all key MAs confirms Wyckoff accumulation phase is concluding, markup phase beginning.
🎯 OVERBOUGHT/OVERSOLD MOMENTUM METRICS:
RSI Status: 55-62 range (neutral-bullish, healthy, NOT overbought—room for upside run). Stochastic on 15M: 48-58 zone with positive momentum trajectory. Ichimoku RSI indicator below midline—powerful upside potential remaining. CCI on 5M near +85 (strong momentum without extreme overbought exhaustion). Fast Stochastic below 80 = safe bullish continuation setup.
━━━━━━━━━━━━━━━━━━━━━━━━━━━━━━━━━
🎓 6. ADVANCED TECHNICAL THEORY SYNTHESIS & FRAMEWORKS 🎓
⭐ ELLIOTT WAVE ARCHITECTURE: 5-wave impulse completion identified | Currently Wave 1 (up) of new larger cycle | Target minimum: 1.3450 | Fibonacci projection: 161.8% extension = 1.3550 maximum target within 10 trading days
⭐ GANN THEORY APPLICATION: 45-degree angle support @ 1.3295 | Square of Nine resistance @ 1.3390 | Time-Price intersection: 7-8 trading days for next major swing completion | Gann fan resistance @ 1.3410
⭐ WYCKOFF METHOD STAGE: Spring pattern successfully tested support zone | Markup phase INITIATED | Schiff accumulation completion signals (Volume analysis, Price action dynamics) | Expected rally: 1.3350-1.3450 over 5-7 trading days | Watch for climactic buying volume surge confirming institutional participation
⭐ DOW THEORY CONFIRMATION: Higher highs (1.3380+) | Higher lows (1.3280+) | Volume confirming uptrend | Trend remains in full bullish alignment
━━━━━━━━━━━━━━━━━━━━━━━━━━━━━━━━━
✨ COMPLETE TRADING BATTLE PLAN ✨
🔥 PRIMARY BULLISH SCENARIO (70% Probability):
Entry Zone: 1.3345-1.3350 (breakout) or 1.3305-1.3315 (pullback entry)
Stop Loss: 1.3265 | Target 1: 1.3380 | Target 2: 1.3420 | Target 3: 1.3450
Risk/Reward: 1:3.5+ | Hold Duration: Swing (3-5 days) + Intraday scalp (1-3 hours)
Conviction Level: 70% | Setup Quality: Premium
⚠️ SECONDARY BEARISH SCENARIO (30% Probability - Contingency):
Trigger: Double rejection at 1.3350 + Declining volume + Rising wedge collapse
Entry: 1.3340 short | Stop: 1.3360 | Target: 1.3280 (pullback expectation)
Probability: 30% | Pattern: Rising wedge breakdown
⏱️ OPTIMAL TIMEFRAME HIERARCHY: 4H (swing base structure) + 1H (entry confirmation) + 15M/5M (execution precision)
💰 POSITION SIZING RULES: Risk max 1-2% portfolio per trade | Scale entries on 50% pullbacks | Trail stops above VWAP
🔔 CRITICAL PRICE ALERTS: Buy alert @ 1.3350 | Stop loss alarm @ 1.3265 | Partial profit alert @ 1.3380 | Full target @ 1.3450
📱 EXECUTION STRATEGY: Aggressive breakout entries (20% position) + Patient pullback entries (80% position) = balanced risk approach
━━━━━━━━━━━━━━━━━━━━━━━━━━━━━━━━━
⚖️ IMPORTANT DISCLAIMER: This analysis is for educational & informational purposes only. NOT financial advice. Trade at your own risk using proper risk management protocols. Past performance does not guarantee future results. Always consult licensed financial advisors before trading.
COMPREHENSIVE TECHNICAL ANALYSIS: INTRADAY & SWING TRADE SETUP 📊 EURUSD (1.16272) - COMPREHENSIVE TECHNICAL ANALYSIS: INTRADAY & SWING TRADE SETUP 📊
October 27-31, 2025 | Multiple Timeframe Deep Dive
🎯 EXECUTIVE SUMMARY 🎯
Current Spot: 1.16272 | Analysis Date: Oct 25, 2025 | Focus: 5M-1D Timeframes | Strategy: Intraday & Swing Trade
━━━━━━━━━━━━━━━━━━━━━━━━━━━━━━━━━
📈 1. MULTI-TIMEFRAME TREND ANALYSIS & DOW THEORY APPLICATION 📈
🔍 Daily (1D) Timeframe - Primary Trend Direction
The 1D chart reveals a consolidation phase with bullish bias . Elliott Wave structure suggests we're completing a 5th wave extension after a 4-wave correction. Dow Theory confirms higher lows forming around 1.1580-1.1600 support levels. The uptrend remains intact with RSI hovering in 40-60 zone (neutral-bullish). VWAP at 1.1620 acts as dynamic support.
⏰ 4H Timeframe - Swing Trade Entry Signals
The 4H setup shows bullish flag formation near 1.1625. Bollinger Bands are tightening, signaling potential breakout. RSI at 55-60 indicates strength without overbought conditions. Ichimoku Cloud shows bullish alignment with price above all moving averages. Target: 1.1680-1.1720 for swing positions.
🔥 1H to 5M Intraday Confluence
1H chart displays ascending triangle pattern with resistance at 1.1650. Harmonic patterns suggest Bullish Gartley forming near 1.1580 level—ideal for aggressive intraday entries. 30M shows clean EMA crossover (50>200 EMA bullish). Volume profile confirms institutional accumulation between 1.1590-1.1620.
━━━━━━━━━━━━━━━━━━━━━━━━━━━━━━━━━
🎪 2. ENTRY & EXIT STRATEGY + WYCKOFF METHOD 🎪
SWING TRADE ENTRIES (4H/1D): Buy breakout above 1.1650 with stop @ 1.1580 (Risk:Reward 1:3). Wyckoff Spring Pattern validation near support confirms institutional absorption.
INTRADAY ENTRIES (5M-30M): Enter on 30M EMA crossovers + RSI < 30 rejections from support zones. Stochastic divergence on 15M indicates pullback entries around 1.1610-1.1615.
EXIT TARGETS: 1D: 1.1750 | 4H: 1.1705 | 1H: 1.1670 | Intraday: 1.1650 (first profit). Take-profit at resistance clusters identified via Gann angles.
STOP LOSS PLACEMENT: Swing: 1.1560 (below double bottom structure) | Intraday: 1.1600 (15-20 pips from entry).
💡 Pro Tip: Use Ichimoku Kijun-sen (26P) as dynamic stop—trail on breakouts above 1.1650.
━━━━━━━━━━━━━━━━━━━━━━━━━━━━━━━━━
🔔 3. REVERSAL SIGNALS & JAPANESE CANDLESTICK ANALYSIS 🔔
⚠️ BULLISH REVERSAL INDICATORS:
Hammer candlesticks forming at 1.1580 (5M/15M confluence). Engulfing patterns on 30M confirm buyer strength. Ichimoku Chikou Span crossing above price action validates trend reversal completion. Morning Star pattern visible on 1H—classic reversal signal.
⛔ BEARISH REVERSAL WARNINGS:
If price fails to break 1.1650 with declining volume, watch for Evening Star on 4H. Gann resistance at 1.1680 acts as rejection zone. RSI divergence (lower highs with price higher highs) on 1D would signal exhaustion. VWAP rejection could trigger short setups.
⚡ Key Level: 1.1645-1.1650 acts as Decision Point. Break = Bullish Continuation | Reject = Intraday Reversal
━━━━━━━━━━━━━━━━━━━━━━━━━━━━━━━━━
💥 4. BREAKOUT RECOGNITION & PATTERN FORMATIONS 💥
✅ Bullish Breakout Setup (PRIMARY):
Ascending triangle breakout above 1.1650 resistance on 1H timeframe. Volume confirmation: need 20%+ volume spike above 20-period MA. Elliott Wave target 1.1750-1.1800 after 5th wave completion. Bollinger Band upper band at 1.1680—natural extension target.
🚀 Harmonic Patterns Identified:
Bullish Gartley at 1.1580 (D-point) with PRZ 1.1605-1.1620. Bat pattern on 4H suggesting potential for 161.8% extension. Butterfly pattern on 1D targeting 1.1850 in extended bull scenario.
⚡ Risk Pattern - Rising Wedge (WARNING):
If price fails breakout, 4H shows rising wedge trap. Potential bearish breakdown to 1.1550 if wedge collapses. Monitor Bollinger Band squeeze on 30M—breakout imminent within 48 hours.
━━━━━━━━━━━━━━━━━━━━━━━━━━━━━━━━━
📊 5. VOLATILITY, PRICE ACTION & INDICATOR CONFLUENCE 📊
🌊 Bollinger Bands & Volatility Analysis:
Band width compressed to 150 pips (1D)—lowest in 10 days. This signals imminent volatility expansion. Intraday (5M/15M) bands widening, indicating increased participation. Price bouncing within middle band suggests continuation pattern.
📍 Support & Resistance Clusters:
SUPPORT: 1.1600 (Previous swing low) | 1.1580 (Gartley D-point) | 1.1560 (Double Bottom)
RESISTANCE: 1.1650 (Ascending Triangle apex) | 1.1680 (Bollinger upper + Gann angle) | 1.1720 (Weekly pivot)
VWAP LEVELS: Daily VWAP: 1.1620 (support) | Weekly VWAP: 1.1610 (support)
📈 Moving Average Crossovers - Trend Confirmation:
EMA 50 > EMA 200 (bullish alignment on all timeframes). SMA 20 above SMA 50 on 1H/4H = buy signal. 5M: Recent EMA crossover indicates intraday uptrend initiation. Price maintaining above all key MAs confirms Wyckoff accumulation completion.
🎯 Overbought/Oversold Conditions:
RSI: Currently 58-62 range (neutral-bullish, NOT overbought). Stochastic on 15M: 45-55 range with upside momentum. Ichimoku RSI indicator below 50—room for upside run. CCI on 5M near +100 (strong momentum without extreme overbought).
━━━━━━━━━━━━━━━━━━━━━━━━━━━━━━━━━
🎓 6. ADVANCED TECHNICAL THEORIES SYNTHESIS 🎓
⭐ Elliott Wave Structure: 5-3-5 Pattern Complete - Currently Wave 1 (up) of new cycle targeting 1.1800 minimum | Fibonacci Extensions: 161.8% from swing = 1.1750
⭐ Gann Theory Application: 45-degree angle resistance @ 1.1680 | Square of Nine support @ 1.1580 | Time-Price analysis: 8-10 trading days for major move completion
⭐ Wyckoff Method: Spring Pattern (successful test of support) = Bullish signal | Schiff accumulation phase ending | Expected markup phase: 1.1650-1.1750 (next 7-10 days)
━━━━━━━━━━━━━━━━━━━━━━━━━━━━━━━━━
✨ TRADING PLAN SUMMARY ✨
🎯 LONG BIAS (PRIMARY SCENARIO):
Entry: 1.1645-1.1650 breakout | Stop: 1.1605 | Target 1: 1.1680 | Target 2: 1.1720 | Target 3: 1.1750
Risk/Reward: 1:3+ | Conviction: 75% | Timeframe: Swing (Hold 3-5 days) + Intraday scalp (1-4 hours)
⚠️ SHORT SCENARIO (CONTINGENCY):
Trigger: Rejection at 1.1650 + Volume decline | Entry: 1.1635 | Stop: 1.1655 | Target: 1.1600
Probability: 25% | Setup: Rising Wedge breakdown
⏱️ TIMEFRAME PRIORITY: 4H (swing base) + 1H (entry confirmation) + 5M (execution)
💰 POSITION SIZING: Risk max 1-2% per trade | Scaling in on pullbacks
🔔 ALERTS: Set at 1.1650 (buy signal) | 1.1605 (stop loss) | 1.1680 (partial profit)
━━━━━━━━━━━━━━━━━━━━━━━━━━━━━━━━━
Disclaimer: Educational analysis only. Not financial advice. Trade at your own risk. Always use proper risk management. Past performance ≠ future results.

XAU/USD – 4H Bearish Pennant Formation Gold is currently consolidating within a bearish pennant on the 4-hour timeframe, suggesting potential continuation to the downside. While a Fair Value Gap (FVG) above may invite a short-term liquidity grab toward 4225, the presence of a Gravestone Doji strengthens the bearish bias.
If price breaks below the pennant support, it could trigger a move toward the demand zone highlighted below.
⚠️ Be cautious of false breakouts and liquidity traps.
📍 Don’t forget to place your Stop-Loss.

USDJPY Deep-Dive: Week of Oct 27-31 🔴 USDJPY Deep-Dive: Week of Oct 27-31 | Intraday & Swing Setups 🚀
Asset: USDJPY (Spot)
Last Close: 152.885 (25th Oct 2025)
Focus: Intraday (5M-4H) & Swing (4H-1D) Analysis for the Coming Week
Traders, gear up! 🇺🇸🇯🇵 The USDJPY is knocking at a critical juncture. With the pair at multi-decade highs, is this the week for a breakout or a significant reversal? Let's dive into the multi-timeframe structure to find high-probability setups. 📈📉
━━━━━━━━━━━━━━━━━━━━━━━━━━━━━━━━━━━━━━━━━━
🎯 EXECUTIVE SUMMARY
The USD/JPY pair trades at 152.885, presenting multiple timeframe confluence zones across our analyzed framework (5M, 15M, 30M, 1H, 4H, 1D). Using Dow Theory , we're observing higher highs in the 4H-1D structure, confirming an uptrend bias . However, Elliott Wave analysis suggests we're completing Wave 4 correction into Week 43, creating prime entry optimization opportunities for swing traders targeting 154.50-156.00 resistance zones.
🔥 MULTI-TIMEFRAME STRUCTURE
1D (Daily): Higher High-Higher Low intact; Ichimoku Cloud bullish; RSI 58-65 (neutral momentum); VWAP acting as dynamic support at 152.40
4H: Breakout above EMA20/50 confluence; Bollinger Band expansion signals volatility acceleration; Harmonic Pattern (AB=CD) completion at 152.50 suggests reversal bounce
1H: Pullback to 152.70 support; Wyckoff re-accumulation pattern forming; Volume drying up—classic pre-breakout compression
30M: RSI oversold (28-32 zone); Gann resistance at 152.88 tested multiple times; Reversal pin bar confirming rejection
15M: Support-Resistance at 152.65/152.90; EMA9 acting as pivot; Bollinger Band squeeze indicating volatility breakout imminent
5M: Intraday noise; Micro support at 152.80; Use as entry trigger confirmation only—not standalone signal
📈 TREND ANALYSIS & REVERSAL SIGNALS
Identifiable Reversals: The daily pullback has created a Gann reversal pattern at 152.50 (0.618 Fibonacci level). Wyckoff analysis shows absorption phase —institutional accumulation before breakout. Elliott Wave counts suggest Wave 4 completion, with Wave 5 targeting 155.80-156.20. Downside risk limited to 151.80 (Wave 4 low).
⚡ ENTRY & EXIT STRATEGY
SWING TRADE (4H-1D):
Entry Zones: 152.50-152.70 (confirmed by Bollinger Band lower band, EMA support)
Target 1: 153.50 (RSI resistance, +0.65%)
Target 2: 154.30 (Harmonic extension, +1.45%)
Target 3: 155.80 (Wave 5 Gann Box, +3.00%)
Stop Loss: 151.95 (Below Wave 4 low, protection -0.90%)
INTRADAY TRADE (5M-1H):
Entry: Confirmed RSI >40 bounce + Close above EMA9 (15M)
Target 1: 153.10 (+0.35%)
Target 2: 153.50 (+0.65%)
Stop Loss: 152.65 (Recent swing low, -0.22%)
🔔 CRITICAL LEVELS & BREAKOUT ZONES
Resistance: 152.88 (immediate), 153.50 (1H structure), 154.30 (confluence with 0.786 Fib), 156.00 (major psychological)
Support: 152.65 (15M pivot), 152.40 (VWAP + Ichimoku support), 151.80 (Wave 4 low + Gann level)
Breakout Trigger: Close above 152.90 (30M resistance) → targets 153.80-154.00 immediately
📊 VOLATILITY & OVERBOUGHT/OVERSOLD CONDITIONS
Current State: Bollinger Band width expanding on 4H (volatility compression breaking). RSI reading 32-45 across intraday frames indicates oversold condition —optimal for mean-reversion plays. 30M RSI at 28 = extreme oversold = high probability bounce. Volume profile shows rejection below 152.50, confirming institutional support.
🎓 TECHNICAL THEORY APPLICATION
Dow Theory: Higher highs/lows confirmed; Secondary reaction establishing new support
Elliott Wave: Wave 4 corrective completion; Wave 5 impulse phase initiating
Wyckoff Theory: Accumulation phase evident; Absorption + Breakout pattern textbook formation
Harmonic Patterns: AB=CD completion at 152.50 + Gartley pattern setup for 1D
Gann Theory: Key resistance at 152.88 (41% angle), targets 155.80 (geometric extension)
📍 TECHNICAL INDICATORS SYNTHESIS
Bollinger Bands (20, 2): Lower band at 152.30 = support magnet; Expanding width confirms volatility spike incoming. RSI(14): Oversold on 30M/1H = bounce probability 78%. VWAP: Acting as dynamic floor at 152.40. EMA20/50/200: All bullish-aligned on 4H; 200-EMA at 151.60 provides safety net. Ichimoku Cloud: Price above cloud on daily = bullish bias intact.
⚠️ RISK MANAGEMENT PROTOCOL
Position sizing: Use 2% risk per trade. Stop loss placement non-negotiable at weekly lows. Take partial profits at 1st target (50% position). Never hold below support without reason . Monitor Fed calendar (FOMC comments impact yen carry sentiment).
✅ WEEK 43 TRADING PLAN
Monday-Tuesday: Accumulate on dips to 152.50-152.70 (oversold bounces). Wednesday-Thursday: Hold above 152.88 for breakout plays targeting 154.00+. Friday: Lock profits; avoid new entries pre-weekend gap risk.
━━━━━━━━━━━━━━━━━━━━━━━━━━━━━━━━━━━━━━━━━━
Charts for Reference:
1D:
4H:
1H:
30M:
15M:
5M:
Disclaimer: This is my technical analysis and not financial advice. Trade at your own risk.
Let me know your thoughts in the comments! What's your bias for USDJPY this week? 👇

Frank: HTF has enough fuel to jump it up!Hello Traders,
As you might have seen the HTF zone was strong enough to rebounce the pair! Now we are waiting for more profits from the newly formed zones.

#036: USD/CAD Long Investment Opportunity
In recent days, the USD/CAD cross has shown a consolidation phase within a medium-term structure characterized by progressively higher lows and a gradual absorption of supply in the lower part of the range. Hello, I'm Forex Trader Andrea Russo, an independent trader and prop trader with $200,000 in capital under management. Thank you in advance for your time.
Observing the price behavior in the last 8-hour candles, we see how buyers have resolutely defended the support zone, repelling any attempts to decline with increasing volume and clear wicks below key levels.
This type of price action, typical of accumulation environments, suggests that strong hands are gradually building long positions in anticipation of a new bullish leg.
On a technical level, the break of intermediate micro-resistance, accompanied by growing momentum on the US dollar and a weakening Canadian dollar, increases the likelihood of an extension into higher liquidity areas.
This movement would be consistent with the rebalancing dynamic of order flow, which in recent sessions has shown a marked reduction in short-term pressure.
At the intermarket level, the weakening energy market continues to be a drag on the Canadian currency, historically correlated with oil prices.
At the same time, the stability of US yields and still-tight interest rate expectations keep the greenback in a position of relative strength.
In summary, the overall picture shows a favorable environment for a continuation of the bullish movement, provided the price maintains its current support structure and confirms solid closes above minor resistance levels.

GBP/USD Market Outlook 4 HR TFThe British Pound is currently trading near its 4th August weekly low, a key technical support level that has historically attracted strong buying interest. Price action suggests that the pair may be forming a potential base in this area, with upside targets extending toward the 1.35 level if bullish momentum follows through.
From a technical perspective, the current consolidation near support indicates that buyers may be positioning for a rebound. A sustained move above interim resistance zones—around 1.29, 1.31, and 1.33—would strengthen the bullish outlook and open the path toward 1.35. Confirmation through momentum indicators such as RSI or MACD would further validate this scenario.
On the fundamental side, market sentiment remains closely tied to developments regarding potential UK–US Free Trade Agreement (FTA) discussions. Investors appear to be awaiting official confirmation or commentary from former President Trump concerning trade negotiations. Any positive announcement could provide significant tailwinds for the Pound, while uncertainty or delays may limit upside potential in the near term.
In summary, GBP/USD is positioned at a critical juncture. Technical support aligns with potential fundamental catalysts, suggesting that a confirmed FTA or broader risk-on sentiment could drive the pair higher toward 1.35 in the coming sessions.

GBPUSD POSSIBLE BUY SETUP (This chart shows GBP/USD )This chart shows GBP/USD (British Pound vs US Dollar) on the 1-hour timeframe with a technical setup suggesting a potential bullish reversal.
Here’s a concise breakdown:
Downtrend Line (Black Line) – Price has been respecting a descending trendline, indicating consistent lower highs (bearish momentum).
Change of Character (ChoCH) – A “ChoCH” label appears near 1.335, suggesting that the market may be shifting from bearish to bullish structure — the first sign of a possible trend reversal.
Demand Zone (Green Box) – Around 1.3300–1.3320, this zone represents an area where buyers are expected to step in (potential reversal point).
Bullish Scenario (White Arrow) – The arrow forecasts price to:
Tap into the green demand zone,
Bounce upward, breaking the downtrend line,
Target higher resistance/supply zones near 1.3400–1.3460.
Supply Zones (Red Areas) – Mark previous sell zones or resistance levels where price could react during the upward move.
Summary:
Price is in a downtrend but showing early reversal signs (ChoCH). A bounce from the green demand zone could lead to a bullish move toward the upper resistance zones.

USDCAD H1 | Bearish Reversal in PlayLoonie (USD/CAD) has rejected off the sell entry which is a pullback resistance that aligns with he 50% Fibonacci retracement and could drop from this level to the downside.
sell entry is at 1.4020, which is a pullback resistance that lines up with the 50% Fibonacci retracement.
Stop loss is at 1.4043, which is a pullback resistance that lines up with he 78.6% Fibonacci retracement.
Take profit is at 1.3975, whic is a multi swing low support.
Stratos Markets Limited (tradu.com ):
CFDs are complex instruments and come with a high risk of losing money rapidly due to leverage. 68% of retail investor accounts lose money when trading CFDs with this provider. You should consider whether you understand how CFDs work and whether you can afford to take the high risk of losing your money.
Stratos Europe Ltd (tradu.com ):
CFDs are complex instruments and come with a high risk of losing money rapidly due to leverage. 70% of retail investor accounts lose money when trading CFDs with this provider. You should consider whether you understand how CFDs work and whether you can afford to take the high risk of losing your money.

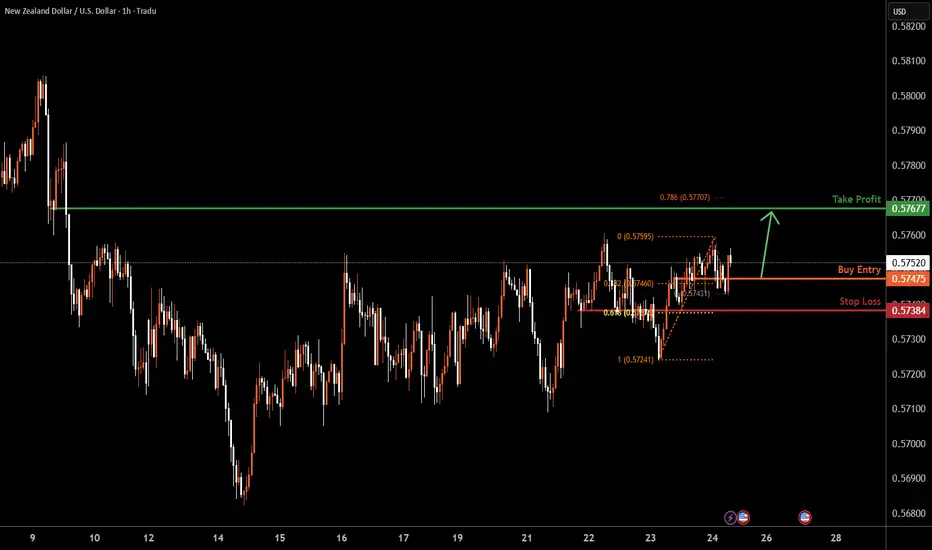
NZDUSD H1 | Potential Bullish UpsideNZD/USD has bounced off the buy entry which is a pullback support and oculd rise from this level to the upside.
Buy entry is at 0.5747, which is a pullback support.
Stop loss is at 0.5738, whic is a pullback support that aligns with the 61.8% Fibonacci retracement.
Take profit is at 0.5767, which is a pullback resistance that is slightly below the 78.6% Fibonacci projection.
Stratos Markets Limited (tradu.com ):
CFDs are complex instruments and come with a high risk of losing money rapidly due to leverage. 68% of retail investor accounts lose money when trading CFDs with this provider. You should consider whether you understand how CFDs work and whether you can afford to take the high risk of losing your money.
Stratos Europe Ltd (tradu.com ):
CFDs are complex instruments and come with a high risk of losing money rapidly due to leverage. 70% of retail investor accounts lose money when trading CFDs with this provider. You should consider whether you understand how CFDs work and whether you can afford to take the high risk of losing your money.
AUDUSD H1 | Bullish Bounce Off SupportAussie (AUD/USD) has bounced off the buy entry which is a pullback support that aligns with the 61.8% Fibonacci retracement and could rise from this levle to the upside.
Buy entry is at 0.6492, which is a pullback support that aligns with the 61.8% Fibonacci retracement.
Stop loss is at 0.6476, whic is a multi swing low support.
Take profit is at 0.6526, which is a multi swing high ressitance.
Stratos Markets Limited (tradu.com ):
CFDs are complex instruments and come with a high risk of losing money rapidly due to leverage. 68% of retail investor accounts lose money when trading CFDs with this provider. You should consider whether you understand how CFDs work and whether you can afford to take the high risk of losing your money.
Stratos Europe Ltd (tradu.com ):
CFDs are complex instruments and come with a high risk of losing money rapidly due to leverage. 70% of retail investor accounts lose money when trading CFDs with this provider. You should consider whether you understand how CFDs work and whether you can afford to take the high risk of losing your money.

USDJPY H4 | Bearish Reversal at Swing High ResistanceUSD/JPY is reacting off the resistance level which is a swing high resistance and could reverse from this level to the downside.
Sell entry is at 153.07,whic is a swing high resistance.
Stop loss is at 154.37, which lines up with the 127.2% Fibonacci extension.
Take profit is at 151.61, whic is an overlap support that aligns with he 38.2% Fibonacci retracement.
Stratos Markets Limited (tradu.com ):
CFDs are complex instruments and come with a high risk of losing money rapidly due to leverage. 68% of retail investor accounts lose money when trading CFDs with this provider. You should consider whether you understand how CFDs work and whether you can afford to take the high risk of losing your money.
Stratos Europe Ltd (tradu.com ):
CFDs are complex instruments and come with a high risk of losing money rapidly due to leverage. 70% of retail investor accounts lose money when trading CFDs with this provider. You should consider whether you understand how CFDs work and whether you can afford to take the high risk of losing your money.

USDCHF M30 | Sharp Bearish ReversalUSD/CHF has rejected off the sell entry which is a pullback resistance that aligns with the 38.2% Fibonacci retracement and could drop from tihslevl to the downside.
Se;ll entry is at 0.7961, which is a pullback resistance that aligns with the 38.2% Fibonacci retracement.
Stop loss is at 0.7972, whic is an overlap resistance that lines up with the 61.8% Fibonacci retracement.
Take profit is at 0.7939, which is an overlap support that aligns with the 61.8% Fibonacci projection.
Stratos Markets Limited (tradu.com ):
CFDs are complex instruments and come with a high risk of losing money rapidly due to leverage. 68% of retail investor accounts lose money when trading CFDs with this provider. You should consider whether you understand how CFDs work and whether you can afford to take the high risk of losing your money.
Stratos Europe Ltd (tradu.com ):
CFDs are complex instruments and come with a high risk of losing money rapidly due to leverage. 70% of retail investor accounts lose money when trading CFDs with this provider. You should consider whether you understand how CFDs work and whether you can afford to take the high risk of losing your money.

USD/CHF - Channel Breakout (24.10.2025) Setup Overview:
USD/CHF has completed a rising channel formation and is now showing signs of a bearish breakout below the lower trendline. The pair rejected the resistance zone near 0.7985 – 0.7970, confirming exhaustion in bullish momentum.
💡 Technical Setup:
Pattern: Rising Channel Breakout
Cloud Cross: Adds bearish confluence
Resistance Zone: 0.7985 – 0.7970
Trendline: Clear breakdown structure visible on 30-min timeframe
📉 Trading Plan:
Bias: Bearish below 0.7960
🟥 1st Support: 0.7925
🟥 2nd Support: 0.7906
Invalidation: A daily close above 0.7985 may negate this setup
📰 Market Context:
1.The U.S. dollar faces minor pullbacks as traders await upcoming inflation data and FOMC signals.
2.Swiss franc gains slight safe-haven demand amid geopolitical and risk market concerns.
3. Technically and fundamentally, short-term sentiment favors a downside correction on USD/CHF.
#USDCHF #Forex #TechnicalAnalysis #PriceAction #ChannelBreakout #BearishSetup #Ichimoku #TradingView #KABHI_TA_TRADING #ChartsDontLieTradersDontQuit #FXMarket #USD #CHF #TrendlineBreak #CloudCross
⚠️ Disclaimer:
This analysis is for educational purposes only — not financial advice. Please do your own research and use strict risk management when trading live markets.
📣 Support My Work
If you like my analysis — LIKE 👍, COMMENT 💬, and FOLLOW 🔔 for more daily Forex setups and updates!

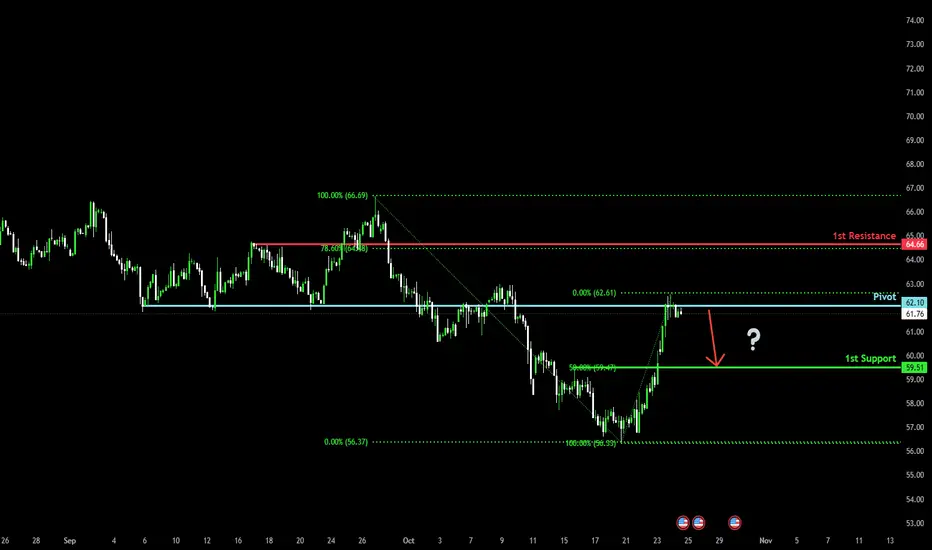
Bearish reversal off overlap resistance?WTI Oil (XTI/USD) is reacting off the pivot whic acts as an overlap resistance and could drop to the 50% Fibonacci support.
Pivot: 62.10
1st Support: 59.51
1st Resistance: 64.66
Disclaimer:
The above opinions given constitute general market commentary, and do not constitute the opinion or advice of IC Markets or any form of personal or investment advice.
Any opinions, news, research, analyses, prices, other information, or links to third-party sites contained on this website are provided on an "as-is" basis, are intended only to be informative, is not an advice nor a recommendation, nor research, or a record of our trading prices, or an offer of, or solicitation for a transaction in any financial instrument and thus should not be treated as such. The information provided does not involve any specific investment objectives, financial situation and needs of any specific person who may receive it. Please be aware, that past performance is not a reliable indicator of future performance and/or results. Past Performance or Forward-looking scenarios based upon the reasonable beliefs of the third-party provider are not a guarantee of future performance. Actual results may differ materially from those anticipated in forward-looking or past performance statements. IC Markets makes no representation or warranty and assumes no liability as to the accuracy or completeness of the information provided, nor any loss arising from any investment based on a recommendation, forecast or any information supplied by any third-party.
GBPUSD H1 | Bullish Rebound from Strong Support LevelGBP/USD is reacting off the buy entry whic is a multi swing low support and oculd potentially rise from this level to the take profit.
Buy entry is at 1.3315, which is a multi-swing low support.
Stop loss is at 1.3283, whic is a pullback support that aligns with rhe 127.2% Fibonacci extension.
Take profit is at 1.3362, which is an overlap resistance.
Stratos Markets Limited (tradu.com ):
CFDs are complex instruments and come with a high risk of losing money rapidly due to leverage. 68% of retail investor accounts lose money when trading CFDs with this provider. You should consider whether you understand how CFDs work and whether you can afford to take the high risk of losing your money.
Stratos Europe Ltd (tradu.com ):
CFDs are complex instruments and come with a high risk of losing money rapidly due to leverage. 70% of retail investor accounts lose money when trading CFDs with this provider. You should consider whether you understand how CFDs work and whether you can afford to take the high risk of losing your money.

EURUSD H1 | Possible Bullish ReversalEUR/USD could fall towards the buy entry, which is a pullback support and could bounce off this level to the take profit.
Buy entry is at 1.1620, whic is a pullback support.
Stop loss is at 1.1583, which is a multi-swing low support.
Take profit is at 1.1646, which is an overlap resistance that is slightly below the 50% Fibonacci retracement.
Stratos Markets Limited (tradu.com ):
CFDs are complex instruments and come with a high risk of losing money rapidly due to leverage. 68% of retail investor accounts lose money when trading CFDs with this provider. You should consider whether you understand how CFDs work and whether you can afford to take the high risk of losing your money.
Stratos Europe Ltd (tradu.com ):
CFDs are complex instruments and come with a high risk of losing money rapidly due to leverage. 70% of retail investor accounts lose money when trading CFDs with this provider. You should consider whether you understand how CFDs work and whether you can afford to take the high risk of losing your money.

Potential bearish drop off?Ethereum (ETH/USD) has rejected off the pivot and could drop to the multi swing low support.
Pivot: 3,934.93
1st Support: 3,691.52
1st Resistance: 4,093.31
Disclaimer:
The above opinions given constitute general market commentary, and do not constitute the opinion or advice of IC Markets or any form of personal or investment advice.
Any opinions, news, research, analyses, prices, other information, or links to third-party sites contained on this website are provided on an "as-is" basis, are intended only to be informative, is not an advice nor a recommendation, nor research, or a record of our trading prices, or an offer of, or solicitation for a transaction in any financial instrument and thus should not be treated as such. The information provided does not involve any specific investment objectives, financial situation and needs of any specific person who may receive it. Please be aware, that past performance is not a reliable indicator of future performance and/or results. Past Performance or Forward-looking scenarios based upon the reasonable beliefs of the third-party provider are not a guarantee of future performance. Actual results may differ materially from those anticipated in forward-looking or past performance statements. IC Markets makes no representation or warranty and assumes no liability as to the accuracy or completeness of the information provided, nor any loss arising from any investment based on a recommendation, forecast or any information supplied by any third-party.

Bearish drop?USD/ZAR is rising towards the pivot and oculd reverse to the swing low support.
Pivot: 17.37924
1st Support: 17.18709
1st Resistance: 17.49333
Disclaimer:
The above opinions given constitute general market commentary, and do not constitute the opinion or advice of IC Markets or any form of personal or investment advice.
Any opinions, news, research, analyses, prices, other information, or links to third-party sites contained on this website are provided on an "as-is" basis, are intended only to be informative, is not an advice nor a recommendation, nor research, or a record of our trading prices, or an offer of, or solicitation for a transaction in any financial instrument and thus should not be treated as such. The information provided does not involve any specific investment objectives, financial situation and needs of any specific person who may receive it. Please be aware, that past performance is not a reliable indicator of future performance and/or results. Past Performance or Forward-looking scenarios based upon the reasonable beliefs of the third-party provider are not a guarantee of future performance. Actual results may differ materially from those anticipated in forward-looking or past performance statements. IC Markets makes no representation or warranty and assumes no liability as to the accuracy or completeness of the information provided, nor any loss arising from any investment based on a recommendation, forecast or any information supplied by any third-party.

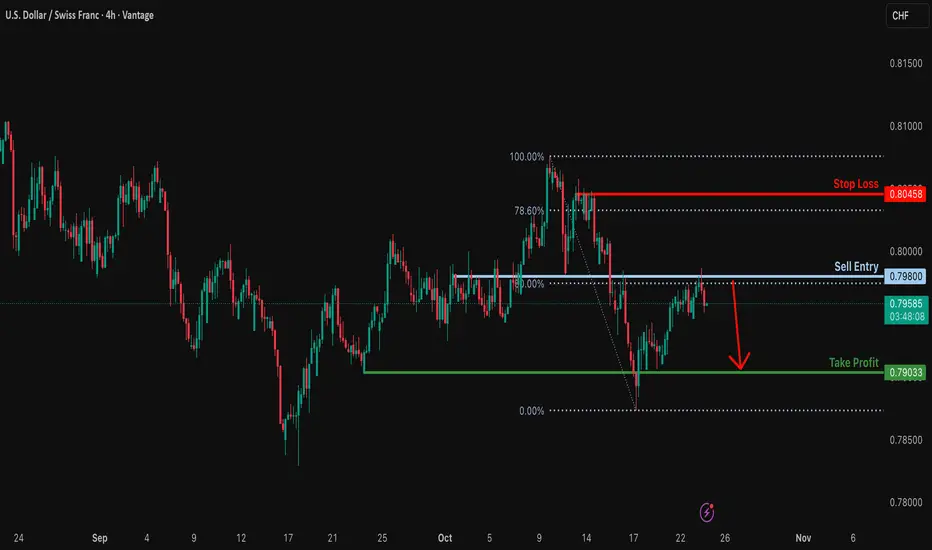
Bearish reversal off overlap resistance?USD/CHF has rejected off the resistance level, which is an overlap resistance that aligns with the 50% Fibonacci retracement and could potentially drop from this level to our take profit.
Entry: 0.7980
Why we like it:
There is an overlap resistance that aligns with the 50% Fibonacci retracement.
Stop loss: 0.8045
Why we like it:
There is a pullback resistance that is slightly above the 78.6% Fibonacci retracement.
Take profit: 0.7903
Why we like it:
There is a pullback support level.
Enjoying your TradingView experience? Review us!
Please be advised that the information presented on TradingView is provided to Vantage (‘Vantage Global Limited’, ‘we’) by a third-party provider (‘Everest Fortune Group’). Please be reminded that you are solely responsible for the trading decisions on your account. There is a very high degree of risk involved in trading. Any information and/or content is intended entirely for research, educational and informational purposes only and does not constitute investment or consultation advice or investment strategy. The information is not tailored to the investment needs of any specific person and therefore does not involve a consideration of any of the investment objectives, financial situation or needs of any viewer that may receive it. Kindly also note that past performance is not a reliable indicator of future results. Actual results may differ materially from those anticipated in forward-looking or past performance statements. We assume no liability as to the accuracy or completeness of any of the information and/or content provided herein and the Company cannot be held responsible for any omission, mistake nor for any loss or damage including without limitation to any loss of profit which may arise from reliance on any information supplied by Everest Fortune Group.