$BTC Vs. $GOLDBitcoin / Gold is near its historical bottom.
Is back in the long-term demand zone, as it was at the 2020 and 2023 lows.
RSI indicator is also almost exactly the same as the previous two lows.
This structure has historically always been a precursor to a strong trend reversal.
Reaction from these areas in 2020 and 2023 led to significant appreciation in Bitcoin against gold.
Today the picture is similar again both price and momentum point to the same bottom scenario.
J-XAU


Nears the Boss Resistance at $4,489 — Revaluation Era Incoming?Gold (GC1!) Nears the Boss Resistance at $4,489 — Revaluation Era Incoming? 🟡👑
No hype — this is it.
Gold Futures (GC1!) have pushed past $4,400 , approaching what I’ve long marked as the Boss Resistance at $4,489 . This is the final gate — and it's been sitting on my chart for years, untouched... until now.
That $4,000 level? It was our signal. The failed short attempt there wasn’t a mistake — it was confirmation. Since that breakout, gold’s been in vertical mode.
📍 Now we’re in the danger zone.
Expect chop, traps, or a reversal between $4,000 and $4,489 unless the Boss gets taken out with strength.
🔍 Big Picture: Revaluation May Be Coming...
The price action is wild — but the backdrop is even bigger.
🧾 Did you know the official U.S. valuation of gold is still $42.22 per ounce?
New research suggests Washington may be considering a gold revaluation — just like Roosevelt did in 1933. That move alone boosted U.S. gold wealth by 69% overnight.
Why revalue now? Here’s what’s brewing:
• 📉 National debt is exploding
• 🪙 Gold ETFs are soaking up demand
• 🌍 Central banks are stacking gold to escape USD dependency
• 💰 Revaluation would instantly add trillions in assets — without printing a dime
This isn’t just a rally — this is a structural reset.
📈 Levels Recap:
• Boss Resistance: $4,489 👑
• Breakout Floor: $4,000
• Intermediate Support: $3,602 and $3,000
• Long-Term Flip Zone: $2,537
Markets don’t move because of candles — they move because of confidence.
🧘 Mindset Check 🧘
Gold is rising because trust is falling.
We are entering an era where sound money is not just a preference — it’s a necessity.
One Love,
The FXPROFESSOR 💙
Gold front runs-----BTC Follows....


Gold's Historic Rally: Why It HappenedGold approaches $4,500 per ounce for the first time in history. Up more than 50% in less than a year. Everyone's asking the same question: Is this a historic breakout, or the setup for a massive crash?
The answer requires looking at three things: what brought us here, where we are technically, and what could go wrong.
PART 1: THE MACRO STORY
Gold doesn't just rally because people are "scared." It rallies because of structural shifts in how the world's largest institutions view money, risk, and trust.
Central Banks Are Buying Gold at Record Pace
Here's a number that should get your attention: Central banks bought 1,045 tons of gold in 2024. That's the second-highest annual total on record.
In 2025, the buying hasn't slowed down. Poland alone has accumulated 67 tons year-to-date. Turkey, India, Kazakhstan, and others are following suit.
But here's what's really happening: This isn't about inflation hedging. If it were, Western central banks (US, Europe) would be buying too. They're not. Instead, emerging market central banks are diversifying away from the dollar.
Why? Because they watched what happened in 2022 when the US froze Russian reserves. When you hold dollar-denominated assets, they can be weaponized. Gold can't be sanctioned. Gold can't be frozen.
Central banks don't panic sell on a 5% dip. When they buy, they hold. This creates a structural price floor. Every pullback gets accumulated.
What this means: Central bank buying is the foundation of this rally, not a temporary catalyst.
The Federal Reserve is Cutting Interest Rates
According to the CME FedWatch Tool, there is a level of certainty that the Fed would cut rates in October 2025, with markets pricing in another cut in December this year.
When interest rates fall, something important happens to gold: its "opportunity cost" decreases.
Here's the simple version: Gold pays no interest. So when bonds also pay almost nothing (after inflation), holding gold looks pretty reasonable. But when real yields are high, bonds look better and gold looks worse.
Right now, the market is pricing in lower real yields ahead. That's bullish for gold. If the Fed doesn't cut as much as the market expects, that changes everything.
What this means: Rate cuts fuel the rally.
Geopolitical Instability & Currency Debasement
Global tensions remain elevated: Middle East instability, US-China friction, and the ongoing Russia-Ukraine conflict. But that's not the real driver here.
The real driver is the loss of faith in government money.
Gold is at an all-time high, not just in US dollars. It's also hitting all-time highs in euros, yen, and yuan. This isn't a dollar story. This is a global reassessment of what "money" actually means.
Meanwhile, the US national debt is over $35 trillion. Debt-to-GDP is at World War II levels. Other countries (Japan, Europe) are in similar situations, printing money and running massive deficits.
When governments print excessively, investors need a hedge. Gold can't be printed.
What this means: As long as deficits remain high and geopolitical chaos persists, gold has structural demand that goes beyond cycles.
The Bottom Line
Three powerful forces are all pushing in the same direction:
Central banks structurally accumulating gold (de-dollarization)
The Fed cutting rates (lower real yields = gold support)
Global monetary instability (currency debasement = safe-haven bid)
This combination hasn't existed in most traders' lifetimes. That's why this rally feels different. And why it's lasted this long.

Gold Still Running Hot — No Real Pullback YetPrice exploded out of the 15m FVG during Thursday’s Asian session and hasn’t looked back. Took a long right off that 8PM impulsive candle, scaling in as we broke back above the Previous Daily High.
Now we’re holding steady above 4345 — the midpoint of the Asian range looks like short-term support. If bulls defend this level, we could see continuation toward 4380–4400.
Friday bias: Bullish, unless 4340 gives out.
No clean pullback = no reason to force entries. Let the market prove it.
#GoldFutures #MGC #ICTConcepts #NOFOMO #DayTrading

Gold traders - White House to speak on China shortlyGold’s impressive rally has been powered by a mix of rate-cut expectations, political risk, central bank buying, and dollar weakness.
Gold traders’ focus this week has been on the escalating U.S.–China trade tensions though.
Markets are standing by for a statement from the White House, expected within the hour.
We’ll post updates here once the White House statement is released and markets begin to react.

Gold Hits New Record as U.S.–China Tensions and Rate-Cut Bets FuGOLD – PREMIUM UPDATE | Gold Hits New Record as U.S.–China Tensions and Rate-Cut Bets Fuel Rally
Gold hit a fresh record high at $4,218, driven by escalating U.S.–China trade tensions, renewed rate-cut expectations, and rising geopolitical uncertainty.
Investors continue to increase exposure to bullion as a hedge against risk, while Fed Chair Powell’s dovish comments in Philadelphia strengthened rate-cut bets, putting additional pressure on the U.S. dollar and reinforcing gold’s bullish tone.
Key Levels
Pivot: 4,202
Resistance: 4,224 · 4,250 · 4,267
Support: 4,174 · 4,162 · 4,140
Trading Plan
Buy Setup: Long positions remain valid above 4,162, targeting 4,224 / 4,250 / 4,267.
Sell Setup: Shorts correction valid below 4211, targeting 4,175 / 4,162.
Premium Takeaway
Gold maintains strong bullish control above $4,162, with momentum favoring another leg higher toward 4,250–4,267.
Only a decisive break below 4,162 would trigger a short-term correction, while sustained strength above 4,211 keeps the uptrend intact and opens the path toward a new ATH above $4,300.

Rotation Gold to BTCEvery time gold reaches the top, Bitcoin has a 20% correction. Then money flows from gold to the Bitcoin market, and Bitcoin starts a rally.

Asian Session Prep | Price Holding Above Yesterday’s HighNew day, new opportunity — and the bulls are still in control.
Price broke above yesterday’s high before the Asian killzone, showing strong intent early. Now, as we move into the session, it looks like we’re setting up for a continuation — using the previous Daily High (4234.7) as intraday support.
I’ll be watching for a clean reaction around that level during the next impulsive hour. As long as price continues respecting that structure, I’ll maintain a bullish bias.
💡 Key Notes:
Setup: Killzone Continuation
Bias: Bullish
Key Level: 4234.7 (Previous Daily High → Support)
Session Focus: Asian Killzone (8PM–11PM CST)
Target Zones: 4250 short-term, 4280 stretch target
Blind Spot: Price might retrace deeper before expansion — watch for liquidity sweeps near 4220 before continuation.
#Gold #Futures #DayTrading #PriceAction #AsianSession #KillzoneTrading #NoFOMO #Discipline #ICTInspired #TraderMindset

Bullish continuation?Gold (XAU/USD) could fall to the pivot, which is a pullback support, and could bounce to the 1st resistance.
Pivot: 4,168.43
1st Support: 4,108.32
1st Resistance: 4,242.14
Disclaimer:
The above opinions given constitute general market commentary, and do not constitute the opinion or advice of IC Markets or any form of personal or investment advice.
Any opinions, news, research, analyses, prices, other information, or links to third-party sites contained on this website are provided on an "as-is" basis, are intended only to be informative, is not an advice nor a recommendation, nor research, or a record of our trading prices, or an offer of, or solicitation for a transaction in any financial instrument and thus should not be treated as such. The information provided does not involve any specific investment objectives, financial situation and needs of any specific person who may receive it. Please be aware, that past performance is not a reliable indicator of future performance and/or results. Past Performance or Forward-looking scenarios based upon the reasonable beliefs of the third-party provider are not a guarantee of future performance. Actual results may differ materially from those anticipated in forward-looking or past performance statements. IC Markets makes no representation or warranty and assumes no liability as to the accuracy or completeness of the information provided, nor any loss arising from any investment based on a recommendation, forecast or any information supplied by any third-party.

In the game of global trade, the referee is gold!!!What appears to be the convergence of two long-term downtrends formed by the parity of the gold to bitcoin ratio, and at this point when gold has broken its grip (thanks to the foolishness of Western governments past and present), we should see the price rise to the 1.59 range.
This is evidence that gold prices, even if they have not increased since the time of writing, are still in high demand! And gold is the best judge of the global economy!
Good luck

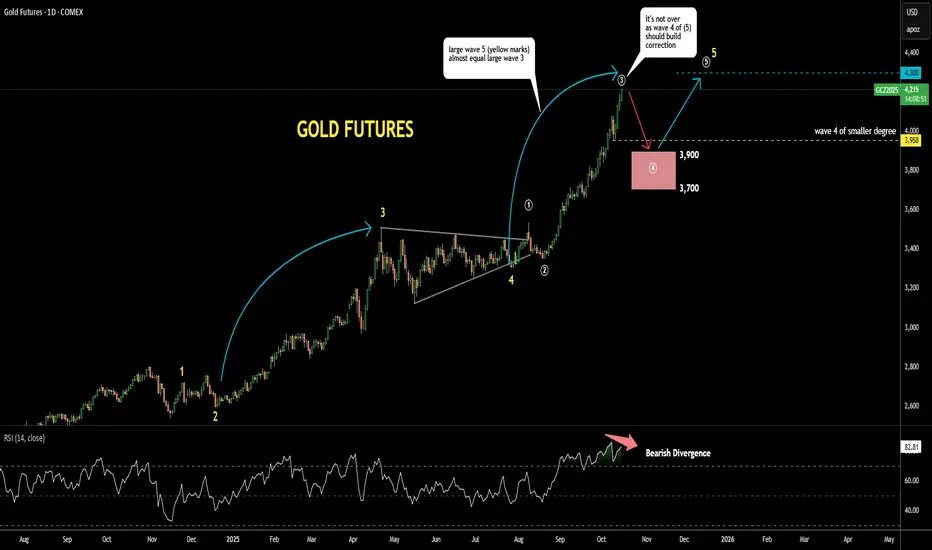
Gold Update 15OCT2025: RSI Hints at CorrectionGold continues to dominate headlines, printing new all-time highs one after another
The 4-hour Bearish Divergence earlier failed to halt the rally
Now, a Bearish Divergence has appeared on the daily time frame, as the latest price high was not confirmed by RSI
This signals that a peak may be forming
A corrective phase could soon unfold as wave 4 within the larger wave (5) structure
The expected retracement could reach the 38.2–61.8% Fibonacci zone of wave 3 of (5), targeting the pink box between $3,700 and $3,900
The low of the previous minor wave 4, near $3,958, may serve as initial support during the pullback
It is worth noting that the magnitude of wave (5) so far mirrors that of the prior large wave (3)
Therefore, the projected target for the final wave 5 of (5) remains around $4,300 as a conservative objective
However, if momentum extends further, wave 5 could evolve into an extended move and drive prices toward new record highs beyond that level
Gold Is on Fire: Can XAU/USD Hit $4130 Gold’s price is really strong right now. As long as gold stays above $4000, it can move up to $4130. But if gold drops below $4000, it could slow down or even start to fall.
What do you think will happen next, do you think gold will keep going up or fall back down? Have you ever watched gold make a big move before?
If you want to know what to do or have any questions, just ask me! Sometimes a simple question can help you learn something new about trading gold. What do you want to know about gold today?
Mindbloome Exchange
Trade Smarter Live Better

A Roadmap for GOLD to $4,240Gold and silver futures jumped to new highs on Monday, with gold breaking past $4,100 per ounce for the first time and silver exceeding its January 1980 peak. The jump was spurred by rising US-China trade tensions and the possibility of future interest rate reduction by the Federal Reserve, which increased demand for precious metals. October gold futures jumped 3.3% to $4,108.60 per ounce, while silver gained 6.8% to $50.13 per ounce. This year, gold has risen 56.3%, while silver has risen 74.2%.
While some analysts expect a short-term pullback, the long-term view is still strong. According to Bank of America, gold prices might reach $5,000 and silver $65 per ounce by 2026. Julius Baer and Standard Chartered believe fundamentals continue to support an upward trend, but Goldman Sachs warns of increased volatility in silver due to its considerably smaller and less liquid market than gold. A physical supply deficit is also contributing to the pressure, with reports indicating that merchants have begun moving silver to London to capitalize on the price difference.

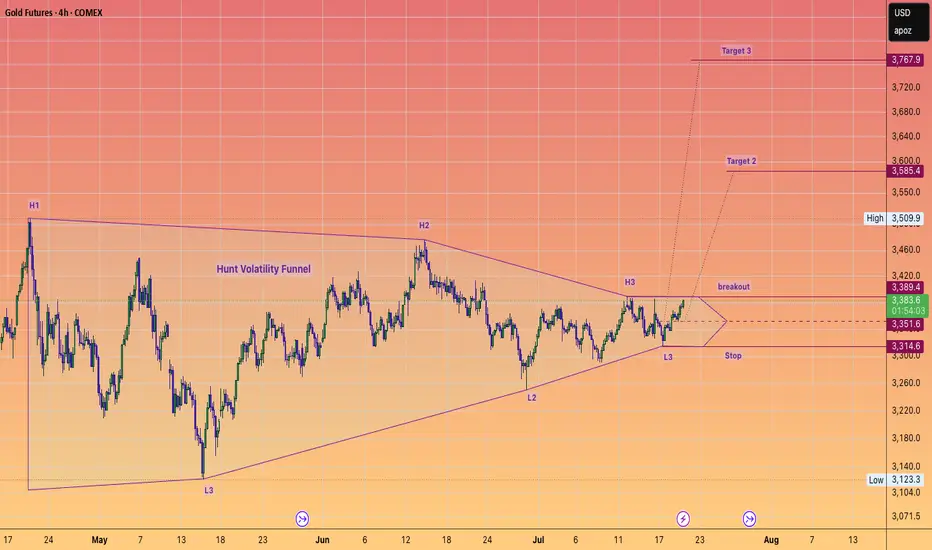
Trade Alert! GOLD to $3800 SOON.#HuntVolatilityFunnel setup which is about to trigger to the upside.
This setup should take gold to or very close to $4K IMHO
#GC
#GOLD
#SILVER
#METALS
GOLD – Bullish Above 4011 Ahead of Tariff TensionsGOLD – Outlook
Gold remains supported by bullish momentum ahead of the renewed tariff tensions between the U.S. and China.
These developments are expected to strengthen safe-haven demand, keeping gold on track toward new all-time highs if momentum continues.
Technically, as long as the price trades above 4011, the bullish trend is likely to extend toward 4040 and 4058, with potential continuation toward 4092.
A bearish correction would require a 1H candle close below 4011, which could trigger a move down to 3980, and below 3965 the decline may extend to 3944.
Gold will likely trade sensitively in the short term, reacting to any new statements from President Trump or updates on the tariff situation between Washington and Beijing.
Pivot Line: 4011
Resistance Levels: 4040 / 4058 / 4092
Support Levels: 3980 / 3965 / 3944
📈 Summary:
Bullish bias remains above 4011, targeting 4058 → 4092, while a close below 4011 may trigger a short-term correction.

BITCOIN BULLISH MOMENTUM CONTINUATION? 125K Still possible?BTC/USDT 1H – Breakout Setup
Cup & Handle forming right under FVG zone, showing early bullish intent.
Recent tariff crash created the swing low and possible reaccumulation zone.
POC: 121K — strong magnet if price breaks higher.
Key Levels:
🔹 115K → Breakout confirmation level
🔹 120K → Mid FVG / Resistance
🔹 121K → POC target
🔹 125K → Next liquidity zone
🔹 110K / 105K / 100K → Downside supports
Bullish case:
Close above 115K = breakout → target 121K–125K (FVG fill + liquidity grab).
Bearish case:
Fail to hold 115K → drop to 110K → 105K → 100K possible.
Summary:
Cup & Handle under FVG + tariff crash low = potential bullish reversal zone.
Watch 115K — that’s the key trigger for direction.

Gold/USD: Bullish Climb to $4100?OANDA:XAUUSD is showing a bullish setup on the 1-hour chart , with an entry zone between $3,963-$3,985 near a key support level.
First target at $4,075 marks initial resistance, while the second at $4,100 offers a deeper upside potential. Set a stop loss on a close below $3,940 to manage risk effectively. 🌟
A break above $3,985 with strong volume could confirm this move, driven by safe-haven demand and USD dynamics. Watch economic data trends! 💡
📝 Trade Plan:
✅ Entry Zone: $3,963 – $3,985 (support area)
❌ Stop Loss: Daily close below $3,940
🎯 Targets:
TP1: $4,075 (initial resistance)
TP2: $4,100 (extended target)
Ready for this rally? Drop your thoughts below! 👇

GOLD Free Signal! Buy!
Hello,Traders!
GOLD breaks above a key horizontal level, confirming bullish momentum as Smart Money drives price toward premium zones. The breakout suggests continuation to the 4,035$ target while respecting liquidity structure.
-------------------
Stop Loss: 3,993$
Take Profit: 4,035$
Entry: 4,016$
Time Frame: 1H
-------------------
Buy!
Comment and subscribe to help us grow!
Check out other forecasts below too!
Disclosure: I am part of Trade Nation's Influencer program and receive a monthly fee for using their TradingView charts in my analysis.

GOLD BULLISH CONTINUATION EXPECTED|LONG|
✅XAUUSD confirms a clean breakout above the key level, shifting order flow bullish under ICT principles. A retest may follow before continuation, with price expected to seek buy-side liquidity near 4,030$. Time Frame 1H.
LONG🚀
✅Like and subscribe to never miss a new idea!✅

XAUUSD M30 | Bullish riseGold (XAU/USD) is reacting off the buy entry at 4,000.37, which is a pullback support and could potentially rise from this level to the upside.
Stop loss is at 3,950.65, which is a multi-swing low support.
Take profit is at 4,056.76, which is a multi swing high resistance.
High Risk Investment Warning
Trading Forex/CFDs on margin carries a high level of risk and may not be suitable for all investors. Leverage can work against you.
Stratos Markets Limited (tradu.com ):
CFDs are complex instruments and come with a high risk of losing money rapidly due to leverage. 65% of retail investor accounts lose money when trading CFDs with this provider. You should consider whether you understand how CFDs work and whether you can afford to take the high risk of losing your money.
Stratos Europe Ltd (tradu.com ):
CFDs are complex instruments and come with a high risk of losing money rapidly due to leverage. 66% of retail investor accounts lose money when trading CFDs with this provider. You should consider whether you understand how CFDs work and whether you can afford to take the high risk of losing your money.
Stratos Global LLC (tradu.com ):
Losses can exceed deposits.
Please be advised that the information presented on TradingView is provided to Tradu (‘Company’, ‘we’) by a third-party provider (‘TFA Global Pte Ltd’). Please be reminded that you are solely responsible for the trading decisions on your account. There is a very high degree of risk involved in trading. Any information and/or content is intended entirely for research, educational and informational purposes only and does not constitute investment or consultation advice or investment strategy. The information is not tailored to the investment needs of any specific person and therefore does not involve a consideration of any of the investment objectives, financial situation or needs of any viewer that may receive it. Kindly also note that past performance is not a reliable indicator of future results. Actual results may differ materially from those anticipated in forward-looking or past performance statements. We assume no liability as to the accuracy or completeness of any of the information and/or content provided herein and the Company cannot be held responsible for any omission, mistake nor for any loss or damage including without limitation to any loss of profit which may arise from reliance on any information supplied by TFA Global Pte Ltd.
The speaker(s) is neither an employee, agent nor representative of Tradu and is therefore acting independently. The opinions given are their own, constitute general market commentary, and do not constitute the opinion or advice of Tradu or any form of personal or investment advice. Tradu neither endorses nor guarantees offerings of third-party speakers, nor is Tradu responsible for the content, veracity or opinions of third-party speakers, presenters or participants.

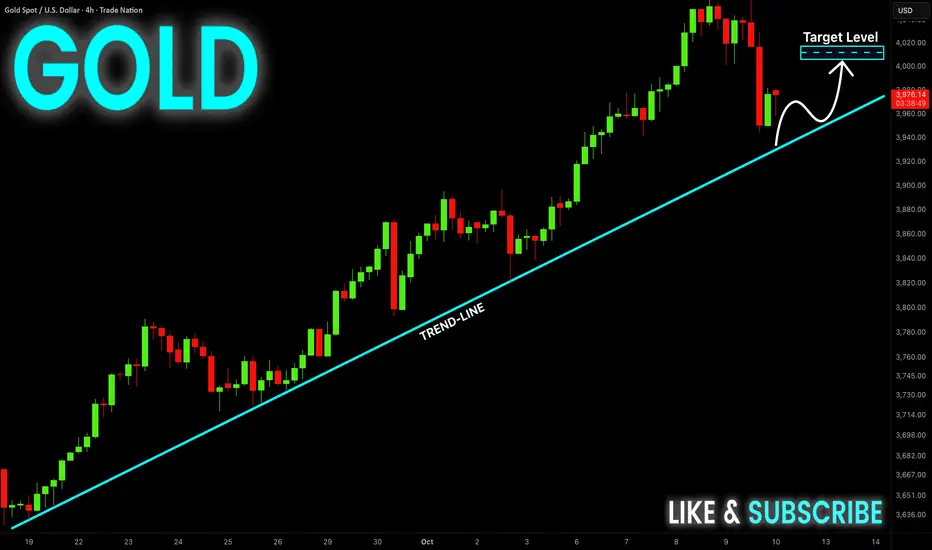
GOLD Long From The Trend-Line! Buy!
Hello,Traders!
GOLD is expected to retest the ascending trendline as Smart Money accumulates around dynamic support. Liquidity has been swept above prior highs, and a correction into discount pricing could spark a bullish continuation toward 4,000$. Time Frame 4H.
Buy!
Comment and subscribe to help us grow!
Check out other forecasts below too!
Disclosure: I am part of Trade Nation's Influencer program and receive a monthly fee for using their TradingView charts in my analysis.