Technical Analysis Of 10 Mentioned Stocks!Hi,
Long time no see! ;)
Actually, quite a busy time but still, have some old depths again and here they are - the stocks you mentioned in the comment section. Probably you don't even remember them :)
Sadly this series is not popular amongst crypto followers but still got enough data to sort out some stocks which may indicate that technically we get short-term bounces from shown areas.
To be said, it is the only technical side, fundamental analysis is your homework to do. These aren't my picks, these are your mentioned stocks.
Remember - fundamental analysis showing what to buy, technical analysis showing when to buy. So, do your homework and select what to buy ;)
1. Adobe
2. Alibaba
3. NVIDIA
4. Ball Corporation
5. Block
6. JD.com
7. Ford
8. CRISPR Therapeutics
9. Intel
10. PayPal
If you were interested in anything, go and do your homework! ;)
Regards,
Vaido
JD

JD is still strong for longI’ve been watching this company for a long time, and even have long position at the price of 65.6.
JD.com made clear impulse up by Feb 2021 after which it began to decline.
At the moment, the entire decline after ATH I can count as zigzag ABC, where B is triangle. From level 61.65 (+ reaction from 50% Fibo level) the price formed leading diagonal plus ABC correction. After that, the price bounced again and met resistance in the middle of the channel formed by the previous waves.
BTW, what is interesting - JD didn’t show us a fairly strong decline while NASDAQ index corrected well down.
So, for now I have 2 scenarios:
1. At the main scenario, I think that the price has formed wave 1 of (3) and expect further upward movement from the channel and extension of the waves.
2. But I also consider an alt. scenario in which wave (2) isn’t completed yet and price want to form wave X (as ZZ) of a double zigzag WXY. In fact, it confuses me that wave (2) ended so quickly and perhaps the price will meet good resistance at the border of the channel. I’ll watch the volumes and further price action near resistance zone (92.6 - 94.5).

accurate forecast and long entry now we are waiting my thoughts were accurate for the 3 Chinese stocks and now we are waiting for re-entry after the decline.
the positions were closed half yesterday and half before yesterday trading day
disclaimer

$JD Inverse Head and ShouldersNew trader here, would greatly appreciate any feedback on my rudimentary analysis.
I have been watching $JD and am proposing the potential development of an Inverse Head and Shoulders pattern.
I would now be looking for a pullback from the neckline (top purple box ~$71) to the shoulder line (middle purple box ~$65), before a break of the neckline to enter a long position.
I still haven't really nailed the best way of setting targets but suppose you could use a risk reward SL-TP .
Additionally, based on another community post, I have been exposed to a bullish signal within the RSI indicator forming inline with the pattern.
Thanks in advance.
*Not financial advice*

JD, 6 Jan. Two buy levels.JD has lost a third of its value in just over a month. Let’s take a look if we can pick the stock up over the next days.
Elliott:
We are looking for a wave C with 5 sub-waves. We can count a completed 5-wave move to the downside now. Alternatively we expect one more wave to completion. These two interpretations give us two potential buy levels.
Geometry:
Price bounced at the lower boundary of the upward channel, which is the .5 fib mark of the downward facing channel.
Oscillators:
The RSI shows a bullish divergence. The Stochastic is oversold for over a month and due to move up.
How to trade it:
The two levels (green arrows) give us excellent risk-reward ratios to try long positions with tight stop losses. The lower level at 54 is more likely to hold when we expect an expanded flat correction. JD needs to re-gain the 21 day MA and hold it in order to further increase long exposure safely.

JDPushing off from a daily support, broke out of a downward channel with retest of $69 area. Expected a move to the upside.

finally $jd break out after crack down with great balance sheetjd finally make the break out from downtrend line, mow is time to buy!
happy new year with health and gains!!
disclaimer


JD ShortWith the news of DIDI listing, Im thinking there will be pressure on other China Tech stocks. Nice setup on JP.. Look to play this break and implied move or fill of gap..

JD - ARC ENDING - UP OR DOWN?All,
JD looks like it's going to make a pretty sizeable move here. My honest guess is the downside. With that said I don't think they are a bad company by any means. Decent earnings etc. I just don't see the traffic/high level interest to really keep the momentum up. That being said I always plot both theories up and down so of course do your own DD. Like most of these plays I would do 1:1 puts/calls and drop the other when you have conformation.

JD.com Analysis 19.11.2021Hello Traders,
welcome to this free and educational analysis.
I am going to explain where I think this asset is going to go over the next few days and weeks and where I would look for trading opportunities.
If you have any questions or suggestions which asset I should analyse tomorrow, please leave a comment below.
If you enjoyed this analysis, I would definitely appreciate it, if you smash that like button.
Thank you for watching and I will see you tomorrow!

JD is on a path to $88.86 in the short termI am bullish on JD in the short term based on the following:
20th Oct - 8th Nov - JD had 3 waves down; and on the 8th Nov, it found support and closed above a key level. After 3 waves down, based on what I have seen, there is usually a change in direction.
9th Nov - A bullish inverted hammer candle was formed and it closed above $77.05.
10th Nov - I entered a long position based on the aforementioned items, in addition to the formation of the StochRSI and the break of the static horizontal level on RSI.
My strategy dictates, after back testing, that i take profits, four levels up from my initial entry, which will be @ $88.86.
Thank you for your time.

JD set for further drops. JDWe are not excluding a possibility of an interim rise, but that will not last. We have much potential to drop on this one. Appearances can be deceiving.
We are not in the business of getting every prediction right, no one ever does and that is not the aim of the game. The Fibonacci targets are highlighted in purple with invalidation in red. Fibonacci goals, it is prudent to suggest, are nothing more than mere fractally evident and therefore statistically likely levels that the market will go to. Having said that, the market will always do what it wants and always has a mind of its own. Therefore, none of this is financial advice, so do your own research and rely only on your own analysis. Trading is a true one man sport. Good luck out there and stay safe!


JD.com Analysis 28.10.2021Hello Traders,
welcome to this free and educational analysis.
I am going to explain where I think this asset is going to go over the next few days and weeks and where I would look for trading opportunities.
If you have any questions or suggestions which asset I should analyse tomorrow, please leave a comment below.
If you enjoyed this analysis, I would definitely appreciate it, if you smash that like button.
Thank you for watching and I will see you tomorrow!

BABABABA can be heating up here ..
As long as above 148 this one can maintain some steam back into the 200's and lead China stocks with it.. very oversold from highs -- can be looking at near 100% ROI back towards highs from here!
Over 170 -- 210 - 230 target is in tact.
Further R LVLs are 248 - 270.
Good buy along with NASDAQ:JD
( Pretty soon this account will become private for only paying subscribers.. to keep up with the plays subscribe to my newletter :) )
- nick

JD.com Analysis 10.10.2021Hello Traders,
welcome to this free and educational analysis.
I am going to explain where I think this asset is going to go over the next days/weeks and where I would look for trading opportunities.
If you have any questions or suggestions which asset I should analyse tomorrow, please leave a comment below.
I would also appreciate, if you would smash that like button and help me to create more free analysis like that.
Thank you for watching and I will see you tomorrow!

Stocks - JD Bull Flag LongBrief for JD:
- China is now beginning an easing cycle.
- While rising yields may take the wind out of US tech's sails, there is an opportunity in China tech, if one can stomach the regulation risks.
- This may go on a 6month+ rally
GLHF
- DPT

$TCEHY / TENCENT has bottomedTencent has bottomed.
- Inverse H&S
- High volume
- Support from 200 WMA
- Support from trend line
- Oversold RSI
What else bottoming out needs? Nothing IMO.

$TCEHY / TENCENT has bottomed- Inverse H&S
- High volume
- Support from 200 WMA
- Support from trend line
- Oversold RSI
What else bottoming out needs? Nothing IMO.

$TCEHY / TENCENT has bottomedTencent has bottomed.
- Inverse H&S
- High volume
- Support from 200 WMA
- Support from trend line
- Oversold RSI
What else bottoming out needs? Nothing IMO.

JD.com Analysis 08.09.2021Hello Traders,
welcome to this free and educational analysis.
I am going to explain where I think this asset is going to go over the next days/weeks and where I would look for trading opportunities.
If you have any questions or suggestions which asset I should analyse tomorrow, please leave a comment below.
I would also appreciate, if you would smash that like button and help me to create more free analysis like that.
Thank you for watching and I will see you tomorrow!

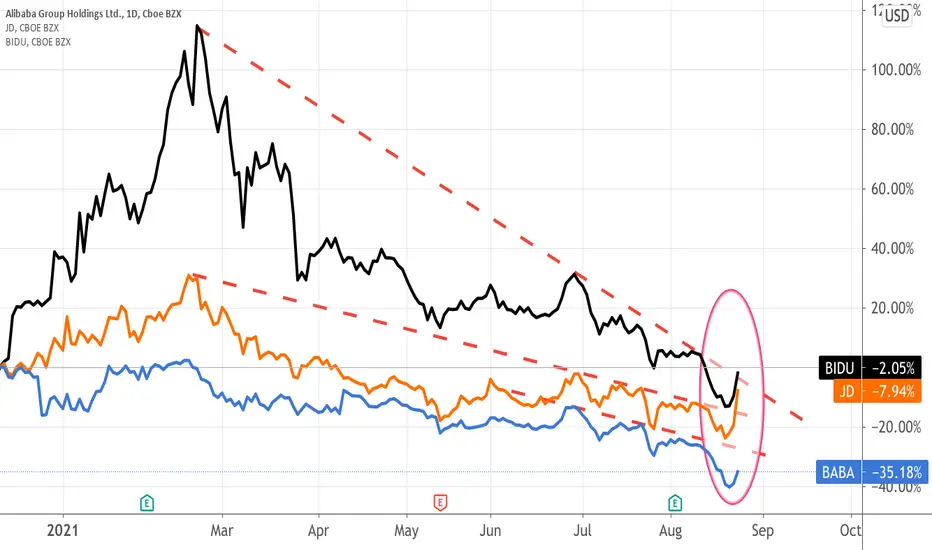
Time to get J.A.BJ.A.B refers to JD.com, Alibaba and Baidu , all of which I have vested interest in.
You can see from the chart except for Alibaba, both JD.com and Baidu since yesterday had broke out of the bearish trend and I hope I am lucky enough to scoop more of these good companies shares.
You can google more about these companies and find out more about its business, cash flows and latest news.
I also think the Chinese government has more or less done with the latest regulations on the internet industry! And thus far , these tech companies are also complying with the regulations, making adjustments to their business, cut out excess fats , etc. Thus, I think this irrational price drop is a significant discount for those who believe in their growth story.
Please do your own due diligence and assess these companies using your own metrics.