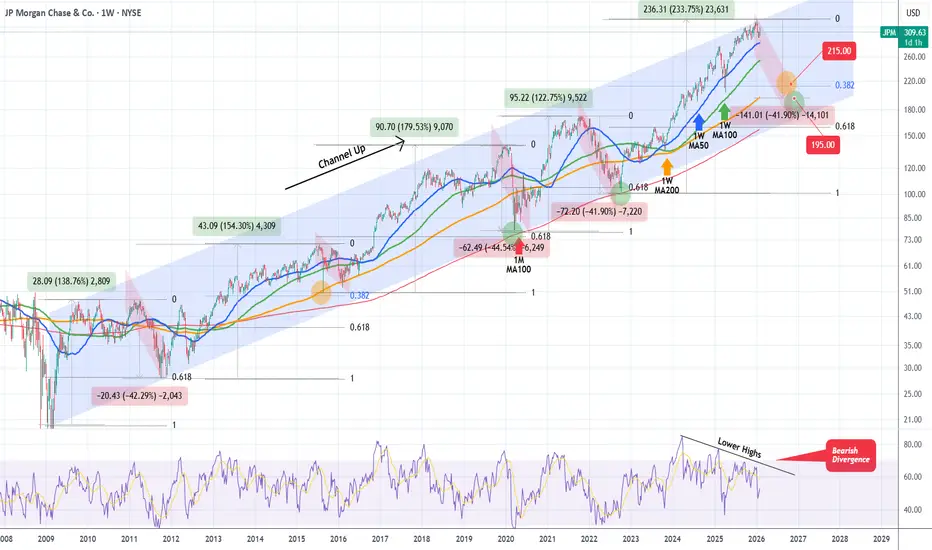
JP MORGAN topped on its 17-year Channel Up. Bear Cycle started.JP Morgan Chase (JPM) has been trading within a 17-year Channel Up since the March 2009 market bottom of the U.S. Housing Crisis. Last month the price hit the exact top of that multi-year pattern and got rejected. Despite the recent rebound, we expect that to be short-lived, as it's not just the Head and Shoulders (H&S) pattern that is being formed but that Channel Up Top alone calls for a strong, potentially 1-year long Bear Cycle.
Such have historically been most major corrections within this pattern, with the last two (2022 Inflation Crisis and 2020 COVID crash) bottomed near the 1M MA100 (red trend-line), which is the utmost long-term Support and the before (2015) bottoming on the 1W MA200 (orange trend-line).
With the 1W RSI currently on a huge Bearish Divergence (Lower Highs against price's Higher Highs) since March 2024, we expect the stock to drop to at least $215.00, which like 2015 will make contact with both the 1W MA200 and the 0.382 Fibonacci retracement level. At most, if the market repeats the -41.90% decline of 2022, we expect it to hit $195.00 just above the 1M MA100.
A deeper correction (which is quite unlikely based on the current fundamentals) would see JPM target the 0.618 Fib, which is where the 2022 and 2020 corrections bottomed, at $160.00.
---
** Please LIKE 👍, FOLLOW ✅, SHARE 🙌 and COMMENT ✍ if you enjoy this idea! Also share your ideas and charts in the comments section below! This is best way to keep it relevant, support us, keep the content here free and allow the idea to reach as many people as possible. **
---
💸💸💸💸💸💸
👇 👇 👇 👇 👇 👇
JPM
JPM TO LEAD RALLY FOR DJIThe chart is my view of JPM I had picked up a position in Call at 299 but Sold today As I had a nice gain But as you can see the labeling I am looking for the next and most likely The final rally in the banks This sector should take The DJI To above The target 50450 in the DJI by early feb By the 9th to be clear . This is my next group of Spirals See charts posted today for the MAJOR turn THE TOP /

ZEC Zcash redemption arc 2025 $500This Privacy Project has been a terrible performer. So anticipate more of that trend.
However since it is PoW and has a Halving in just over 1 year, that following supply deterioration should create a pump cycle
In the 12 months ahead prior to halving I will recommend DCA under $30 and then plan to begin selling above $150
O' Barry Where Art Thou?

Will the party continue at $JPM?An excerpt from analysis covered on the @ForexTraderPaul Monday Market Update.
JPM often leads financial sentiment — weakness here can signal broader risk-off across US equities. Hence why we're interested in a) its numbers and b) how it reacts.
JPM has been on a great trend, and remain the quality benchmark for US Banks, and the financial sector. Will this week’s earnings add fuel to the fire, or prove a damp squib?
Will Trumps plan to curb credit-card interest rates to 10% prove to be a turning point? or merely a small bump in the road? Certainly, this week’s gap down on open was referenced to the Tump initiative. Whether it makes any different we'll see after tomorrow’s numbers.

JPM JP Morgan Chase 1Y Chart Review - RSI focus pointToday you can review the technical analysis idea on a 1Y linear scale chart for JP Morgan Chase Bank (JPM).
It seems there is some action going on here with JPM reviewing the RSI and the ATH. This may be a concern.
If you enjoy my ideas, feel free to like it and drop in a comment. I love reading your comments below.
Disclosure: This is just my opinion and not any type of financial advice. I enjoy charting and discussing technical analysis. Don't trade based on my advice. Do your own research! #millionaireeconomics #JPM

JPMJPMorgan Chase, the largest U.S. bank, reported its strongest Q3 2025 financial results in history. Yet, its stock declined following the release.
Highlights:
Revenue: $46.43B (+9% YoY)
Net Income: $14.4B
EPS: $5.07 (4.75% above estimates)
Record trading performance, investment banking fees up 14% YoY
J.P. Morgan Payments revenue surged 13% YoY to $4.9B
ROE: 17% — among the best in the industry
So why did the stock fall?
🔎

Just In: JPMorgan Launches New Crypto Fund for Wealthy InvestorsJPMorgan Chase — whose CEO Jamie Dimon once dismissed bitcoin as a “fraud” and likened cryptocurrencies to a “Ponzi scheme” — is diving further into crypto with a money-market fund that’s based on blockchain.
The bank’s asset-management division, which handles $4 trillion, will start the Wall Street giant’s first tokenized money-market fund — this one on the Ethereum network — with $100 million of its own money, the Wall Street Journal reported.
The fund — called the My OnChain Net Yield Fund, or MONY — will be opened to outside investors on Tuesday, but it’s not aimed at the masses: The minimum investment is $1 million, and individuals need at least $5 million in investments to qualify. Institutions need at least $25 million.
Technically, shares of NYSE:JPM stock are gearing for a breakout as the stock is moving in tandem with the resistant point in the $300 zone a breakout above that region could resort to a bullish continuation from the present level.
Analyst Summary
According to 13 analysts, the average rating for JPM stock is "Buy." The 12-month stock price target is $326.08, which is an increase of 1.90% from the latest price.

Weekly Bearish Key Reversal on JPMJPM has had a good run - but look at the price action now. I see a Weekly Bearish Engulfing Candle / Key Reversal Candle as part of a double top reversal pattern, whilst sat above $300, and the 20 Weekly MA.
Will $300 and the Weekly 20MA hold and provide support to JPM? If they do then I expect us to retest those recent highs at $320. If they do not then we move lower towards the $280- region.
Weirdly I think a lot of these analysis pieces for this week will be determined by NVDAs results.

JPMorgan( $JPM) Gains on New Paid Fintech Data DealsJPMorgan Chase & Co. (JPM) has reached a series of landmark agreements requiring fintech companies to pay for access to customer bank-account data, marking a major shift in how financial data is shared across the U.S. banking ecosystem.
For years, data aggregators such as Plaid, Yodlee, Morningstar, and Akoya accessed JPMorgan customer data for free, enabling popular fintech apps to offer budgeting tools, payments, and portfolio tracking. Banks have long argued this model was unfair and risky, raising concerns over data privacy, security, and uncompensated use of bank infrastructure.
JPMorgan spokesperson Drew Pusateri confirmed the new paid arrangements, calling them a step toward a safer and more sustainable open-banking framework. The deals were finalized after weeks of negotiation, with JPMorgan reportedly settling for lower fees than initially proposed. In return, aggregators secured concessions on how data requests are processed and stored.
These agreements come as the CFPB’s updated “open banking” rule continues to reshape the data-sharing landscape. Introduced last year, the rule allows consumers to move financial data freely at no cost, sparking pushback from banks but support from fintechs and crypto-adjacent firms. After industry pressure, regulators began revising the rule earlier this year.
For JPMorgan, the new paid model could generate a fresh revenue stream while tightening oversight on third-party data access. It also positions the bank strategically as demand grows for secure data connectivity across fintech platforms.
Technical Outlook: JPM Eyes Bounce Toward $350
JPM has pulled back from recent highs and is now approaching a major support zone around $280, which previously acted as a breakout level. If the stock retests this area and holds, the structure favors a strong upside continuation.
A rebound from support could send JPM back toward $330 and $350, aligning with the stock external bullish trend.

JP MORGAN eyes a potential correction to $210 at least.JP Morgan Chase (JPM) has been trading within a Channel Up since the 2009 bottom of the Housing Crisis. Throughout its course, it has posted 5 strong Bullish Legs, with the current one being the strongest (+221% so far). The result of its strength is the price being exactly at the top (Higher Highs trend-line) of the Channel.
With the 1M RSI extremely overbought and on its highest level since February 2018, the pattern may have reached its upper limit and could be calling for a technical correction. This correction should be in the form of a long-term Bear Cycle (Bearish Leg). Out of the 4 previous Bearish Legs, 3 pulled-back to their 0.618 Fibonacci retracement levels, while 1 to its 0.382 (Fib). That was the only one that found Support on the 1W MA50 (blue trend-line), while the most recent two bottomed on the 1M MA100 (green trend-line).
Note also that 3 of those corrections dropped by around the same %, with the 'weakest' being -41.90% (also the most recent in 2022).
As a result, if JPM has indeed priced its new Top (Channel Up Higher High) currently, a minimum correction to the 0.382 Fib would target $210, while a -41.90% (also minimum) drop would test $190. The latter would also potentially made an ideal contact with the 1M MA100. A 0.618 Fib correction would be at $158, but also below the Channel Up, unless executed very violently, which makes it a less realistic scenario.
---
** Please LIKE 👍, FOLLOW ✅, SHARE 🙌 and COMMENT ✍ if you enjoy this idea! Also share your ideas and charts in the comments section below! This is best way to keep it relevant, support us, keep the content here free and allow the idea to reach as many people as possible. **
---
💸💸💸💸💸💸
👇 👇 👇 👇 👇 👇

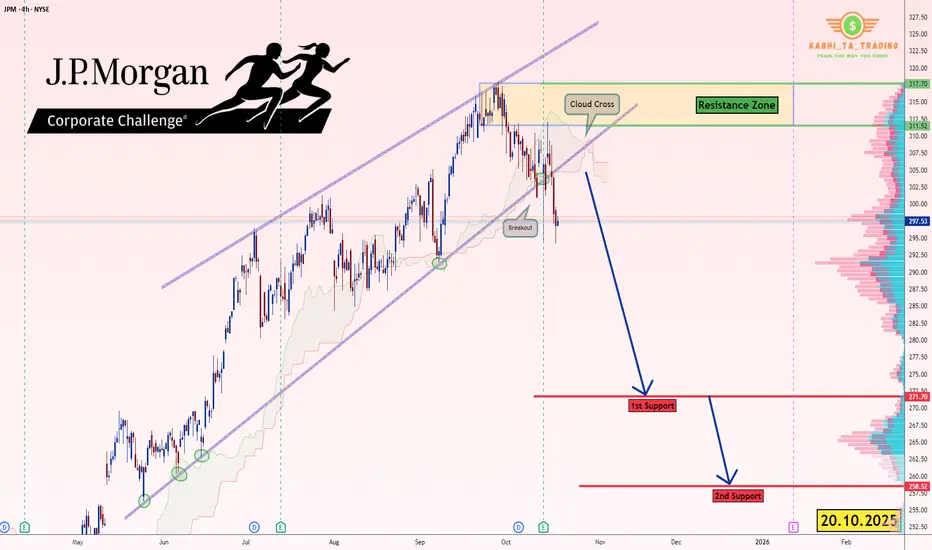
JP Morgan (JPM) - H4 - Breakout Pattern (20.10.2025)📊 Setup Overview:
J.P. Morgan ( NYSE:JPM ), presenting a bearish outlook based on the price action.
📈 Trade Plan:
Bias: Bearish below $310
1st Target: $272 ✅
2nd Target: $258.52 🎯
Resistance Zone: $311 – $318
🧩 Technical Confluence:
1.Price Breaks the Wedge Pattern.
2.Trendline break confirming reversal
3.Ichimoku Cloud crossover indicating bearish momentum
🏦 Key Fundamentals & Recent Performance
1.JPM reported third-quarter 2025 adjusted revenue of ~$47.12 billion, topping estimates.
2.Net interest income (NII) rose only ~2% YoY in Q3 to $24.1 billion, and the bank raised its 2025 NII outlook to ~$95.8 billion.
3.JPM itself flags major risks: ongoing geopolitical uncertainty, elevated asset valuations, potential credit stress and slower growth.
#JPM #JPMStock #NASDAQ #USStocks #TechnicalAnalysis #wedgePattern #BearishSetup #PriceAction #EarningsWatch #StockMarket #SwingTrading #TradingView #Ichimoku #CloudCrossover #ChartsDontLie #Kabhi_TA_Trading
⚠️ Disclaimer:
This analysis is for educational purposes only and not investment advice. Always perform your own due diligence and manage risk appropriately before taking any position.
💬 Support the Analysis:
If this chart helped you — LIKE 👍, COMMENT 💬 your thoughts, and FOLLOW ✅ for more daily stock & forex chart breakdowns from Kabhi_TA_Trading!
Regional Banking Crisis 2.0? KRE fell over 6% today due to mounting concerns about sour loans and weakening credit quality across regional banks.
Many regional bank earnings reactions are not supporting positive price action.
Loan Quality Fears: Wall Street is increasingly worried about deteriorating credit conditions in regional banks’ loan portfolios. Reports suggest rising delinquencies and potential defaults, especially in commercial real estate and small business lending.
Jefferies & Zions Drag: Shares of Jefferies and Zions Bancorporation were among the hardest hit, amplifying pressure on the ETF. Zions, in particular, saw double-digit losses amid speculation about its exposure to risky assets.
Tariff-Driven Recession Fears: Broader macro concerns, including recession risks tied to recent tariff policies, are weighing on bank stocks. Tariffs are seen as “unconditionally bad” for financials due to their impact on growth and lending demand.

JPM Swing Plan → Layered Entries & Profit Targets Mapped😂 JPMorgan Chase (JPM) Swing/Day Trade: The Great Heist Blueprint 🤑💰
🚀 Asset: JPMorgan Chase & Co. ( NYSE:JPM )🎯 Market Profit Realization Plan: Swing/Day Trade📈 Outlook: Bullish vibes confirmed! 💪
📜 The Setup: Why JPM is Ready to Pop! 🎉
Bullish Confirmation: The chart is screaming BULLISH! 📈 A clean pullback to the moving average shows institutional big dogs 🐶 holding strong. This isn’t just a random pump — it’s a calculated move!
Market Context: JPM’s price action shows resilience, with buyers stepping in at key levels. The moving average is acting like a trusty springboard for the next leg up. 🏀
🕵️♂️ The Thief Strategy: Layered Entries for Max Gains! 🏦
Dear Ladies & Gentlemen, Thief OGs 😎, here’s how we pull off this heist with style:
Entry Plan: Use a layering strategy with multiple limit orders to stack your position like a pro. 🧱
Suggested buy limit layers: $302, $304, $306, $308, $310.
Pro Tip: Feel free to add more layers based on your risk appetite and account size! More layers = more flexibility. 🥞
New traders? You can enter at any price level within this range — the trend is your friend! 🤝
Why Layering?: This strategy lets you scale into the trade, reducing risk while catching the move. It’s like sneaking into the vault with multiple keys! 🔑
🛑 Stop Loss: Protect Your Loot! 💼
Thief SL: Set your stop loss at $298, just below the breakout level to dodge any fakeouts. 🕳️
Note: Dear Thief OGs, this SL is a suggestion. Adjust it based on your strategy and risk tolerance. You’re the mastermind of your own heist! 🧠
Risk Management: Never risk more than you’re willing to lose. Protect your hard-earned cash! 💸
🎯 Target: Cash Out Before the Trap! 🏃♂️
Profit Target: Aim for $325, where we expect strong resistance and potential overbought conditions. 📉
Why $325?: Historical resistance + overbought signals = a classic trap zone. Cash out your profits before the market pulls a fast one! 🪤
Note: Dear Thief OGs, this TP is a guideline. Take profits at your own discretion — secure the bag when you feel it’s right! 💰
🔗 Related Pairs to Watch (with $ Correlations) 👀
Keep an eye on these financial sector buddies to gauge market sentiment:
NYSE:BAC (Bank of America): Moves in tandem with JPM as a fellow banking giant. If BAC is pumping, it’s a good sign for JPM! 📈
Correlation: High positive correlation (~0.8). Strong financial sector momentum often lifts both.
NYSE:WFC (Wells Fargo): Another banking heavyweight. Watch for similar price action to confirm sector strength. 🏦
Correlation: Moderate positive correlation (~0.7). WFC’s moves can signal broader banking trends.
AMEX:XLF (Financial Select Sector SPDR Fund): Tracks the financial sector as a whole. If XLF is bullish, it’s a tailwind for JPM! 🌬️
Correlation: Strong positive correlation (~0.85). XLF’s direction often sets the tone for JPM’s price action.
Key Point: Monitor these pairs for confirmation of JPM’s bullish move. If they’re lagging, proceed with caution — the heist might need a backup plan! 🕵️♀️
✨ If you find value in my analysis, a 👍 and 🚀 boost is much appreciated — it helps me share more setups with the community!
#TradingView #JPM #StockMarket #SwingTrading #DayTrading #TechnicalAnalysis #ThiefStrategy #Bullish
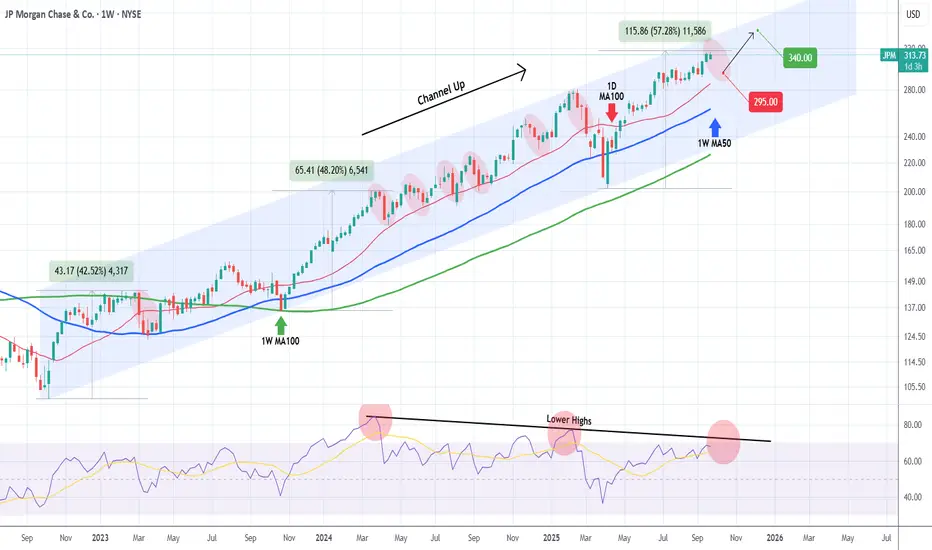
JP MORGAN In need of a relief correction.Last time we took a look at JP Morgan Chase (JPM) was 5 months ago (April 28, see chart below), issuing a strong long-term buy signal, which 2 weeks ago hit our $310 Target:
This time, having already completed a +57.28% rise from the April 07 bottom (Higher Low for the 3-year Channel Up), we expect a medium-term pull-back towards its 1D MA100 (red trend-line), which has systematically been its most common buy entry. The 1W MA50 (blue trend-line) - 1W MA100 (green trend-line) Zone has been the ultimate buy range but since March 2023 has only emerged 3 times.
As a result, given the trajectory of the 1D MA100, we expect the stock to pull-back to $295.00 and if it holds, rebound for an end-of-year rally to $340.00.
-------------------------------------------------------------------------------
** Please LIKE 👍, FOLLOW ✅, SHARE 🙌 and COMMENT ✍ if you enjoy this idea! Also share your ideas and charts in the comments section below! This is best way to keep it relevant, support us, keep the content here free and allow the idea to reach as many people as possible. **
-------------------------------------------------------------------------------
💸💸💸💸💸💸
👇 👇 👇 👇 👇 👇
JPM JPMorgan Chase & Co Options Ahead of EarningsIf you haven`t bought JPM befor the rally:
Now analyzing the options chain and the chart patterns of JPM JPMorgan Chase & Co prior to the earnings report this week,
I would consider purchasing the 290usd strike price Calls with
an expiration date of 2026-1-16,
for a premium of approximately $20.20.
If these options prove to be profitable prior to the earnings release, I would sell at least half of them.
Disclosure: I am part of Trade Nation's Influencer program and receive a monthly fee for using their TradingView charts in my analysis.
$JPM Tradespoon – Long Entry $296.36Tradespoon model generated long signal for NYSE:JPM . Predicted range: $296.36–$298.79. Trend: +0.10%. NYSE:JPM

US Banks on Fire | Revenues Soar, and So Do the ProfitsWho Needs a Recession? Banks Are Swimming in Cash!
The largest U.S. banks have reported some of their best quarterly performances in recent years, with surging trading revenues, a resurgence in dealmaking, and an overall renewal of corporate confidence playing pivotal roles. Let’s break down the key details of the results.
Market Recovery
Across the major banks, investment banking and trading activities recorded impressive performances. Goldman Sachs saw investment banking revenue increase by 24%, while Bank of America (BofA) experienced a massive 44% jump, marking its strongest quarter in three years.
The market volatility stemming from factors like the U.S. election and changing expectations around interest rates continued to fuel robust trading revenues. Morgan Stanley’s equities division, for example, reached an all-time high, while JPMorgan and Goldman Sachs enjoyed notable gains in fixed-income trading.
A surge in CEO optimism has led to an uptick in mergers and acquisitions (M&A), initial public offerings (IPOs), and private credit demand. Morgan Stanley, in particular, is seeing the largest M&A pipeline in seven years, signaling a sustained wave of dealmaking.
Mixed Results for NII
Net interest income showed varying results across the banks, but forward guidance indicates that NII will likely see moderate growth in 2025, spurred by continued loan demand and higher asset yields.
Credit Risks on the Rise
Consumer lending pressures have persisted, with JPMorgan’s charge-offs rising by 9%. Many banks are preparing for a further increase in delinquencies, particularly in credit cards.
Commercial Real Estate Challenges
While the office sector remains under stress, banks are managing their exposures cautiously and have yet to face significant shocks in this area.
Regulatory Scrutiny Continues
Citigroup lowered its 2026 profitability target as it undergoes a transformation, while Bank of America faced increased scrutiny over its anti-money laundering compliance.
Resilient U.S. Economy
Banks are reporting strong consumer spending, loan growth, and corporate profitability, which supports an optimistic outlook for earnings growth heading into 2025.
Performance Breakdown for Each Bank
JPMorgan Chase
- JPMorgan posted a record annual net income of $58.5 billion, marking an 18% increase from the previous year.
- Investment banking saw a 46% surge in revenue, driven by strong advisory and equity underwriting.
- Trading revenue climbed by 21%, led by a 20% increase in fixed-income trading.
- Despite the impressive results, JPMorgan is still facing challenges such as rising charge-offs and pressures on loan margins. CEO Jamie Dimon emphasized concerns about persistent inflation and growing geopolitical risks.
Bank of America
- BofA experienced an 11% year over year growth in revenue, reaching $25.3 billion, with net income up 112% from the previous year.
- The investment banking division saw a dramatic 44% rise in revenue, the highest in three years, thanks to strong debt and equity underwriting.
- Trading revenue grew by 10%, driven by solid performance in fixed income (up 13%) and equities (up 6%) as market volatility spurred client activity.
- BofA also reported growth in its consumer and wealth management divisions, with credit card fees and asset management showing strength. Client balances grew to $4.3 trillion, a 12% increase from the previous year.
- After several quarters of decline, BofA’s NII grew by 3%, exceeding expectations and signaling stability. The bank expects NII to continue rising through 2025, with projections of $15.7 billion per quarter by the end of the year.
Wells Fargo
- Wells Fargo’s revenue remained flat at $20.4 billion, but net income surged by 50%.
- NII declined by 8% year-over-year but is expected to rise slightly in 2025 due to higher reinvestment rates on maturing assets.
- The bank made significant progress in cost-cutting efforts, reducing non-interest expenses by 12%, thanks to workforce reductions and efficiency initiatives.
- Investment banking fees rose by 59%, benefiting from the broader market recovery and the bank’s renewed focus on its Wall Street presence.
- Wells Fargo returned $25 billion to shareholders in 2024, including a 15% dividend increase and $20 billion in stock buybacks. However, the bank continues to face regulatory constraints, notably the asset cap imposed by the Federal Reserve.
- Looking ahead to 2025, Wells Fargo anticipates modest growth in fee-based revenue, with cost discipline and efficiency gains driving improvements.
Morgan Stanley
- Morgan Stanley saw a 26% increase in revenue, reaching $16.2 billion, while net income soared by 142%.
- Equity trading revenue jumped by 51%, setting a new all-time high as market volatility sparked increased client activity, particularly in prime brokerage and risk-repositioning trades.
- Investment banking revenue grew by 25%, fueled by strong demand for debt underwriting, stock sales, and M&A activity. CEO Ted Pick noted that the M&A pipeline is the strongest in seven years, signaling a potential multi-year recovery in dealmaking.
- Morgan Stanley’s wealth management division saw $56.5 billion in net new assets, increasing total client assets to $7.9 trillion. The firm is pushing toward its goal of $10 trillion in assets under management.
- In response to growing business complexities, the firm launched a new Integrated Firm Management division to streamline services across investment banking, trading, and wealth management.
Goldman Sachs
- Goldman Sachs experienced a 23% increase in revenue, reaching $13.9 billion, while net income more than doubled, up 105%.
- Record performance in equity trading contributed to a 32% increase in revenue from this segment, as market volatility drove greater client activity.
- Investment banking revenue grew by 24%, boosted by significant gains in equity and debt underwriting.
- The firm’s asset management division saw an 8% rise in assets under management, reaching $3.1 trillion, while management fees exceeded $10 billion for the year.
- Goldman is winding down legacy balance-sheet investments but also saw a gain of $472 million from these investments in Q4. The firm’s recent launch of its Capital Solutions Group is aimed at capturing growth opportunities in private credit and alternative financing.
Citigroup
- Citigroup posted a 12% increase in revenue, reaching $19.6 billion, with non-interest revenue surging 62%.
- Fixed-income and equity markets were key drivers, growing 37% and 34%, respectively, as market volatility tied to the U.S. election boosted performance.
- Investment banking revenue climbed by 35%, supported by strong corporate debt issuance and a pickup in dealmaking activity.
- The bank unveiled a $20 billion stock repurchase program, signaling confidence in future earnings.
- Citigroup also made strides in controlling operating expenses, which declined by 2% quarter-over-quarter. However, the bank lowered its 2026 return on tangible common equity (RoTCE) guidance to 10%-11% due to the costs of its ongoing transformation.
- CEO Jane Fraser emphasized Citigroup’s long-term growth trajectory, noting improvements in credit quality and continued progress with the strategic overhaul, including the postponed IPO of Banamex, the bank’s Mexican retail unit, now expected in 2026.
Long story short
Heading into 2025, the major U.S. banks are in strong positions, buoyed by a favorable economic backdrop, continued growth in trading, and a rebound in corporate dealmaking. Despite challenges such as rising credit risks, regulatory hurdles, and potential macroeconomic uncertainties, the outlook remains positive. With a recovering IPO market, continued wealth management growth, and strong trading revenue, the banks are poised to capitalize on the renewed corporate optimism. The key question will be whether the dealmaking frenzy continues or whether uncertainties in the global economy and market dynamics could temper the rally.

SPX - Are you catching the rotation trends? SPX is still holding very bullish price action. Technicals are pointing towards higher price and todays inside consolidation day certainly helps digest recent gains.
Along with the flat indices market session, we did observe some massive capital rotation trends.
Financials saw a pretty strong down move across the board. JPM / BAC / C all saw large outflows. We were positioned on the short side of financials and took profits on JPM puts.
Even with the big selloff in financials, SPX held up surprisingly well.
Capital simply rotated instead of outright leaving the market. Bullish Signal.
Technology, Energy, Materials, Health care, Transports all saw capital inflow trends.
Rotation into under preforming sectors is a sign that markets could be staging another healthy leg up.
We still have an upside target over 6300 on SPX.

JP MORGAN's long-term bullish trend restored above the 1D MA50.JP Morgan Chase (JPM) broke above its 1D MA50 (red trend-line) last week for the first time since the first week of March and technically put an official end to the 3-month 'Trade War' correction.
This correction has technically been the Bearish Leg of the 2.5-year Channel Up. Every time the 1D MA50 broke and closed a 1W candle above it, the stock started the new Bullish Leg of the pattern. The last Bullish Leg was +6% (+48% against +42%) stronger than the previous one before the first pull-back to the 1D MA50 again.
As a result, we expect to see $310 (+54%) before this year is over.
-------------------------------------------------------------------------------
** Please LIKE 👍, FOLLOW ✅, SHARE 🙌 and COMMENT ✍ if you enjoy this idea! Also share your ideas and charts in the comments section below! This is best way to keep it relevant, support us, keep the content here free and allow the idea to reach as many people as possible. **
-------------------------------------------------------------------------------
💸💸💸💸💸💸
👇 👇 👇 👇 👇 👇

Banking on Strength: Trade of the WeekNYSE:JPM surges into focus with AI model grade: A and +8.81% upside potential by April 30. Strong Q1 results, resilient fundamentals, and predicted range up to $258.08 make this a compelling buy-the-dip candidate. Key support: $220.32 | Resistance: $258.08 NYSE:JPM

JPMorgan Chase Reports Earnings Today, Topping Q1 EstimatesShares of JPMorgan Chase (NYSE: NYSE:JPM ) are currently up 3% in Friday's premarket session as the asset tops Q1 estimates.
The company reported better-than-expected fiscal first-quarter results as big banks kicked off the new earnings season.
The banking giant reported earnings per share (EPS) of $5.07 on revenue of $45.31 billion, each up from $4.44 and $41.93 billion, respectively, a year ago. According to estimates compiled by Visible Alpha, some analysts had expected $4.64 and $43.55 billion. It generated $23.4 billion in net interest income (NII), above the $23.00 billion consensus.
Shares of JPMorgan were up 3% immediately following the release of Friday's report. They entered the day down roughly 5% year-to-date but up about 16% in the last 12 months.
"The economy is facing considerable turbulence (including geopolitics), with the potential positives of tax reform and deregulation and the potential negatives of tariffs and 'trade wars,' ongoing sticky inflation, high fiscal deficits and still rather high asset prices and volatility," JPMorgan CEO Jamie Dimon said. "As always, we hope for the best but prepare the Firm for a wide range of scenarios."
Dimon wrote in his annual letter to shareholders this week that he expected the Trump administration's tariffs "will slow down growth."
technical Outlook
As of the time of writing, NYSE:JPM shares are already up 1.5% with the asset trading above the support point. A break above the 1-month high pivot could set the course for a bullish campaign eyeing the $260- $280 region.
With the last close RSI at 46, NYSE:JPM shares has more room to capitalize on the dip and make a comeback prior the earnings beat.

OptionsMastery: H&S on JPM! Sound on!🔉
📣Make sure to watch fullscreen!📣
Thank you as always for watching my videos. I hope that you learned something very educational! Please feel free to like, share, and comment on this post. Remember only risk what you are willing to lose. Trading is very risky but it can change your life!

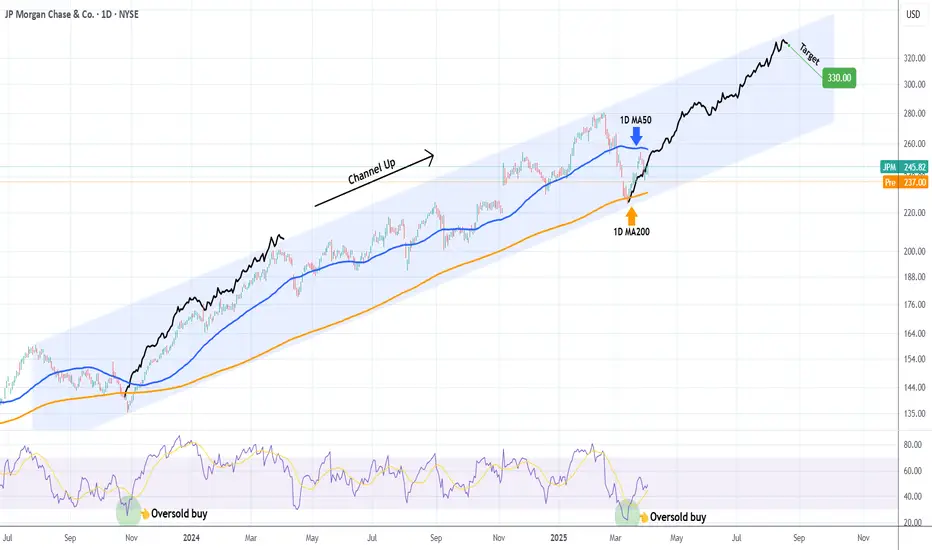
JP MORGAN won't give a better buy opportunity in 2025.Last time we looked at JP Morgan Chase (JPM) on November 27 2024 (see chart below), it gave us a clear sell signal that went straight to our $236 Target:
Now that the price rebounded not only on the 1D MA200 (orange trend-line) but also on the bottom (Higher Lows trend-line) of the long-term Channel Up, we are switching back to buying a we even got the first pull-back on the 1D MA50 (blue trend-line).
Given that the 1D RSI also rebounded from oversold (<30.00) territory like the October 27 2023 Low did, we expect a similar Bullish Leg to follow and thus our Target is $330 at the top of the Channel Up.
-------------------------------------------------------------------------------
** Please LIKE 👍, FOLLOW ✅, SHARE 🙌 and COMMENT ✍ if you enjoy this idea! Also share your ideas and charts in the comments section below! This is best way to keep it relevant, support us, keep the content here free and allow the idea to reach as many people as possible. **
-------------------------------------------------------------------------------
💸💸💸💸💸💸
👇 👇 👇 👇 👇 👇